


Executive Summary
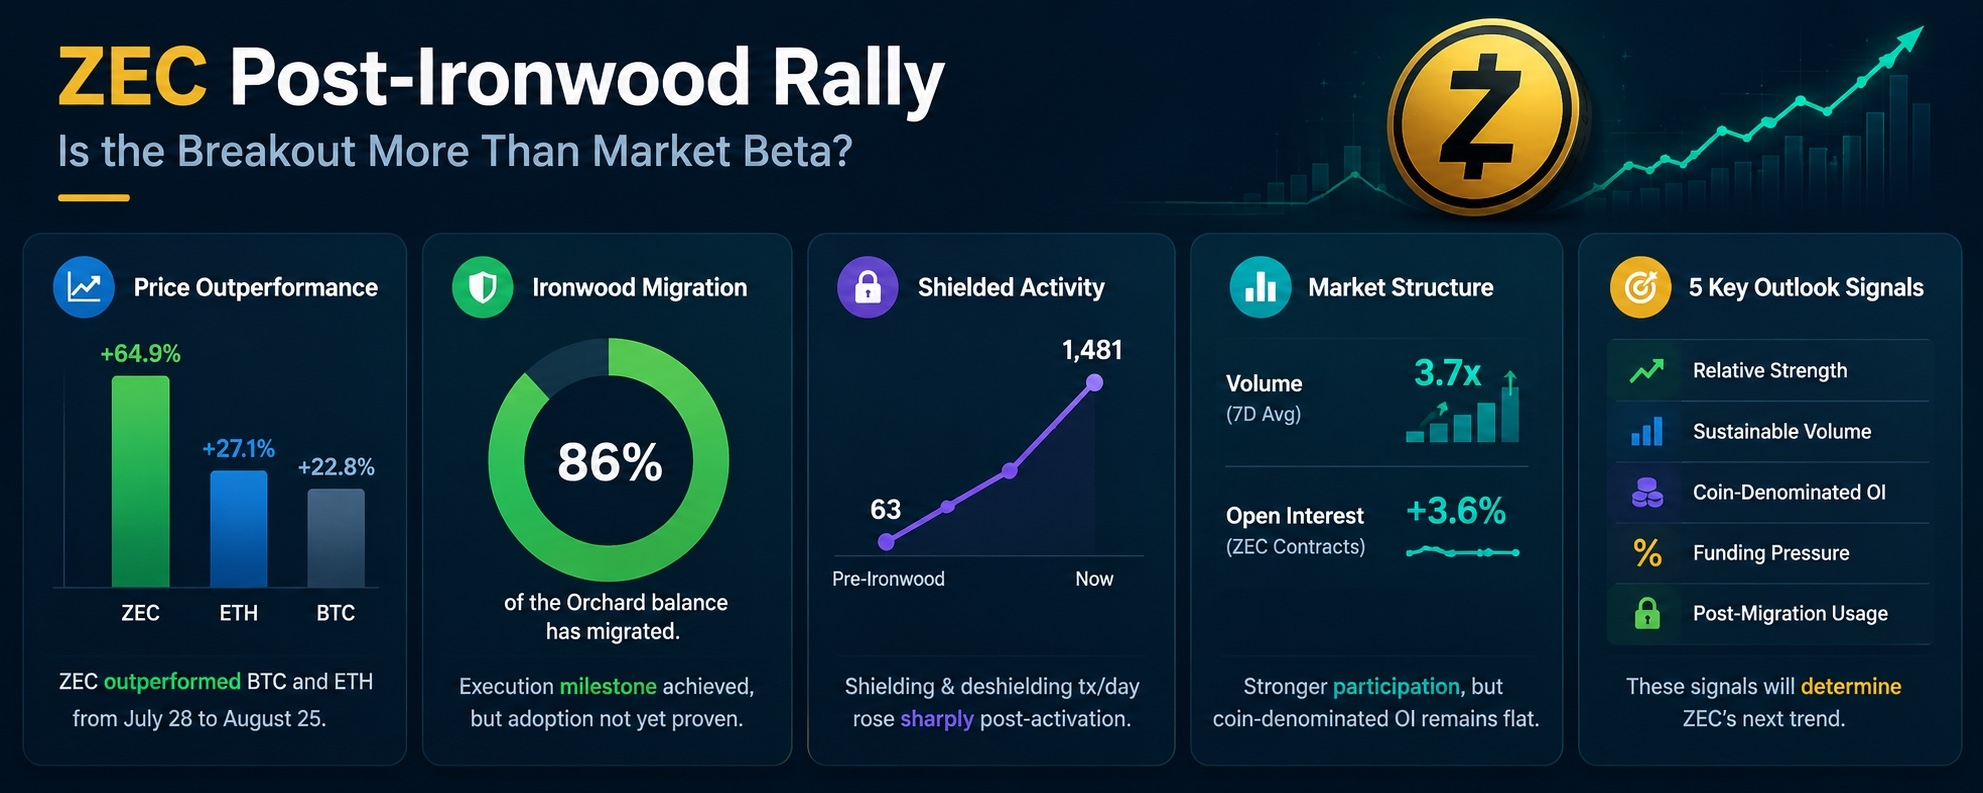
Zcash (ZEC) has delivered one of the strongest moves in the crypto market following the activation of the Ironwood upgrade. From July 28 through August 25, ZEC gained approximately 64.9%, significantly outperforming Bitcoin (+22.8%) and Ethereum (+27.1%).
At first glance, this looks like a clear breakout driven by renewed interest in Zcash. But price alone is not enough to confirm a sustainable trend.
A deeper analysis reveals a more complicated picture:
Price performance: Strongly bullish and substantially ahead of BTC and ETH.
Trading volume: Increased dramatically, indicating much greater market participation.
Orchard migration: Approximately 86% of the activation balance has migrated, showing strong execution of Ironwood’s immediate objective.
Shielded activity: Increased sharply, but migration-related transactions make it difficult to distinguish genuine adoption from operational activity.
Derivatives: Dollar-denominated open interest increased substantially, but ZEC-denominated exposure grew only modestly.
Funding: Positive but not yet extreme, suggesting leverage exists without clear evidence of excessive crowding.
ETF access: The ZEC ETF listing broadens access, but one trading day is insufficient to prove sustained institutional demand.
The key question is therefore no longer “Did ZEC break out?”
It clearly did.
The more important question is:
Can ZEC maintain its relative strength after the Ironwood migration effect and broader crypto-market momentum begin to fade?
1. ZEC Has Clearly Outperformed the Broader Market
The strongest evidence supporting the breakout is ZEC’s relative performance.
From Ironwood activation on July 28 to August 25:
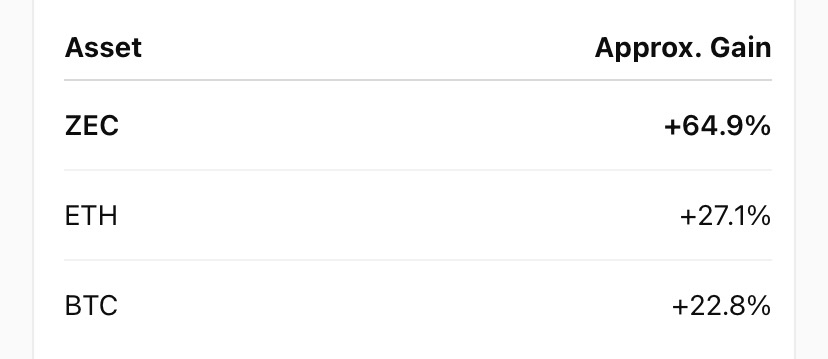
ZEC therefore generated nearly three times Bitcoin’s return during the same period.
The divergence became even more obvious during the week from August 18 to August 25:
ZEC: +51.0%
BTC: +21.3%
ETH: +27.4%
This is important because it suggests that ZEC was not simply moving upward because the entire crypto market was bullish.
There was clearly a ZEC-specific momentum component.
However, there is an important warning.
ZEC reached an event-window closing high of approximately $848.64 on August 23, before falling to $767.88 on August 25.
That represents roughly a 9.5% decline from the peak.
What does this tell us?
The first phase of the breakout has already happened.
The next phase is about holding the breakout.
If ZEC/BTC and ZEC/ETH continue to outperform after the broader market cools down, the argument for a structural repricing becomes much stronger.
If ZEC begins losing its relative strength and simply follows BTC lower, then the move may have been primarily momentum-driven.
2. Ironwood Migration: A Major Execution Milestone
One of the biggest developments behind the ZEC narrative is the migration of funds from the sealed Orchard pool.
At Ironwood activation, approximately 3.599 million ZEC were held in the relevant Orchard balance.
By August 25, that figure had fallen to roughly 504,437 ZEC.
That means approximately:
3.599M − 0.504M = 3.095M ZEC
had migrated.
In percentage terms, approximately:
86% of the activation Orchard balance had migrated.
This is a significant operational achievement.
It indicates that the network successfully executed a major transition following the protocol’s emergency response.
But there is an important distinction:
Migration ≠ Adoption
Moving ZEC from one pool to another does not automatically mean:
More users entered Zcash.
New investors bought ZEC.
Privacy usage increased permanently.
Network demand structurally increased.
The migration demonstrates execution, not necessarily organic adoption.
This distinction is extremely important when analyzing the current rally.
3. Shielded Activity Has Exploded — But the Data Needs Context
Another major development is the increase in shielded-related activity.
Before Ironwood activation, shielding and deshielding transactions averaged approximately:
63 transactions per day
After activation, the average increased to approximately:
1,087 transactions per day
And by August 25, the seven-day average had reached approximately:
1,481 transactions per day
That is a dramatic increase.
At first glance, this appears extremely bullish.
However, the problem is that the current transaction data includes migration-related activity.
Therefore, we cannot simply conclude:
“Shielded transactions increased, therefore Zcash adoption exploded.”
That conclusion would be premature.
The more important test comes after the migration activity declines.
The real adoption signal
If shielded activity remains elevated even after Orchard migration slows, that would provide much stronger evidence that users are actually using Zcash’s privacy functionality.
In other words:
Migration activity → temporary spike
versus
Recurring shielded usage → sustainable adoption
The second is what the market ultimately needs to see.
4. Shielded Supply Provides Another Important Signal
Total shielded value across Sprout, Sapling, Orchard and Ironwood was approximately:
4.80 million ZEC
That represents roughly:
28.4% of reported ZEC supply
This demonstrates that a meaningful portion of ZEC remains within shielded environments.
However, again, the number should not be interpreted as a direct measure of active users.
A large shielded balance does not necessarily mean those coins are actively transacting.
Therefore, investors should distinguish between:
Shielded supply
and
Shielded economic activity.
The second metric is much more useful for determining whether network usage is genuinely expanding.
5. Trading Volume Supports the Breakout
One of the strongest market-based confirmations is the increase in trading activity.
CoinGecko-tracked total volume averaged approximately:
$1.07 billion per day
over the latest seven-day period.
Compare that with the pre-Ironwood 30-day median of approximately:
$289 million per day
That means reported volume was roughly:
3.7× higher
than the previous baseline.
This is significant.
A price breakout accompanied by substantially higher trading activity is generally more convincing than a price move occurring on thin liquidity.
It suggests that the market is paying considerably more attention to ZEC.
However, volume should still be treated carefully.
Tracker-reported volume is not the same thing as audited market-wide exchange turnover.
Therefore:
Higher volume = stronger participation
but not necessarily:
Higher volume = permanent demand.
The important question is whether elevated volume persists once the immediate Ironwood narrative becomes less dominant.
6. Open Interest: The Most Misleading Number
Derivatives data provides one of the most interesting parts of the analysis.
Dollar-denominated open interest increased from approximately:
$236M → $426M
between Ironwood activation and August 25.
That represents an increase of roughly:
80.6%
At first glance, that looks like a massive increase in leveraged positioning.
But there is another way to measure it.
When open interest is measured in ZEC contracts, the increase was only approximately:
3.6%
This changes the interpretation considerably.
Why?
Because ZEC itself increased substantially in price.
When the price of ZEC rises, the USD value of existing contracts automatically increases, even if the actual number of outstanding ZEC contracts barely changes.
Simple example
Imagine traders hold:
1 million ZEC of open positions
At $200:
1M × $200 = $200M
If ZEC rises to $400 while traders still hold exactly 1 million ZEC:
1M × $400 = $400M
Dollar OI has doubled.
But traders did not double their actual ZEC exposure.
This is essentially what the current data is highlighting.
The takeaway
The 80.6% increase in dollar OI looks dramatic.
But the much smaller 3.6% increase in ZEC-denominated OI suggests that the majority of the increase came from price appreciation rather than an equivalent expansion in outstanding contracts.
This is an important distinction when evaluating whether fresh leverage is driving the breakout.
7. Funding Rate: Bullish, But Not Yet Extreme
Funding remained positive.
The seven-day average was approximately:
0.83 basis points per regular interval
Positive funding means long positions were generally paying shorts.
This indicates that bullish positioning existed in the derivatives market.
But the funding level was not extreme enough by itself to demonstrate severe leverage overcrowding.
This is important because extremely positive funding during a parabolic rally can create significant liquidation risk.
For example:
Price rises → traders become increasingly bullish → leverage increases → funding becomes extreme → small pullback triggers long liquidations → forced selling accelerates.
The current data does not provide strong evidence that ZEC has reached that extreme stage.
However, funding should continue to be monitored.
8. The ZEC ETF Adds a New Demand Channel
Another major development arrived on August 25, when the Zcash ETF began trading on NYSE Arca following the conversion of an existing investment trust.
This gives traditional brokerage investors another way to obtain exposure to ZEC.
That is potentially important because ETFs can broaden access beyond users who directly trade cryptocurrency.
But there is a critical point:
ETF listing does not automatically equal new capital.
Because the product was created through the conversion of an existing investment trust, the first day of trading should not automatically be interpreted as a massive wave of fresh institutional demand.
The market needs more data.
What matters now is:
Continued ETF inflows
Assets under management growth
Trading volume
Institutional participation
Whether demand persists after the initial launch attention
If those metrics continue improving, the ETF narrative becomes considerably more meaningful.
9. Five Signals That Could Confirm the Breakout
The current ZEC setup can be evaluated through five major confirmation signals.
① Relative Strength
The most important technical confirmation is whether ZEC continues outperforming BTC and ETH.
Watch:
ZEC/BTC
and
ZEC/ETH
If these ratios continue trending higher, ZEC is demonstrating genuine relative strength.
If they collapse while BTC remains stable, the ZEC-specific narrative may be weakening.
② Sustainable Trading Volume
The current volume expansion is encouraging.
But the ideal scenario is not one enormous volume spike.
The stronger signal would be:
consistently elevated volume over multiple weeks.
That would suggest continuing market participation rather than short-term event speculation.
③ Coin-Denominated Open Interest
For ZEC derivatives, coin-denominated OI may provide a cleaner picture than USD OI.
If:
Price ↑ + ZEC OI ↑
then new positions may be entering the market.
But if:
Price ↑ + USD OI ↑ + ZEC OI remains relatively flat
then much of the OI increase may simply be a result of the higher ZEC price.
④ Funding Pressure
Positive funding is not automatically bearish.
Moderately positive funding can simply indicate healthy bullish positioning.
The risk increases if:
Funding ↑ sharply + ZEC OI ↑ rapidly + price becomes parabolic
That combination would suggest increasing leverage and potential liquidation vulnerability.
⑤ Post-Migration Privacy Usage
This may ultimately become the most important fundamental signal.
Once the majority of Orchard migration is complete, the market should watch whether shielded activity remains elevated.
The ideal confirmation would be:
Migration slows → shielded activity remains high → recurring shielded transfers increase
That would provide stronger evidence that Ironwood has generated lasting network utility rather than merely facilitating a one-time operational transition.
10. Bullish Scenario vs. Risk Scenario
🟢 Bullish Confirmation
The breakout becomes significantly more convincing if:
ZEC continues outperforming BTC and ETH.
Trading volume remains well above the pre-Ironwood baseline.
ETF demand continues expanding.
Shielded activity remains elevated after migration slows.
ZEC-denominated OI begins increasing alongside price.
Funding remains positive but controlled.
ZEC holds the breakout structure after the initial pullback.
This combination would suggest that the rally is transitioning from an event-driven move into a fundamental repricing.
🔴 Risk Scenario
The breakout becomes vulnerable if:
ZEC loses its relative strength against BTC.
Volume rapidly collapses.
Shielded activity falls back toward pre-Ironwood levels.
ETF demand fails to develop.
Leverage increases rapidly while funding becomes extreme.
Price continues falling below important breakout levels.
In that situation, the August rally could increasingly resemble a momentum and event-driven trade rather than a sustainable long-term repricing.
Final Analysis
ZEC's post-Ironwood rally is clearly more significant than a simple market-beta move.
A 64.9% gain versus 22.8% for BTC and 27.1% for ETH demonstrates substantial relative strength.
At the same time, the network has successfully completed approximately 86% of the relevant Orchard migration, while reported trading activity has expanded dramatically.
But several parts of the bullish thesis remain unconfirmed.
The biggest uncertainty is adoption.
Current shielded activity is elevated, but migration itself contributes to that activity. Similarly, the increase in dollar-denominated open interest looks impressive until it is adjusted for ZEC's much higher price.
Therefore, the market is now moving into a confirmation phase.
The first phase was:
Ironwood → migration → attention → price breakout
The next phase needs to be:
Post-migration → recurring privacy usage → sustained volume → continued relative strength → durable demand
That distinction will determine whether ZEC's breakout becomes a lasting structural repricing or gradually fades as the event-driven momentum disappears.
Bottom Line
ZEC has already proved that it can outperform the broader crypto market.
Now it needs to prove that the network's real usage and recurring demand can catch up with the price.
That is the key test for the next stage of the ZEC cycle.
#ZEC #CryptoAnalysis #Zcash #ArifAlpha
