
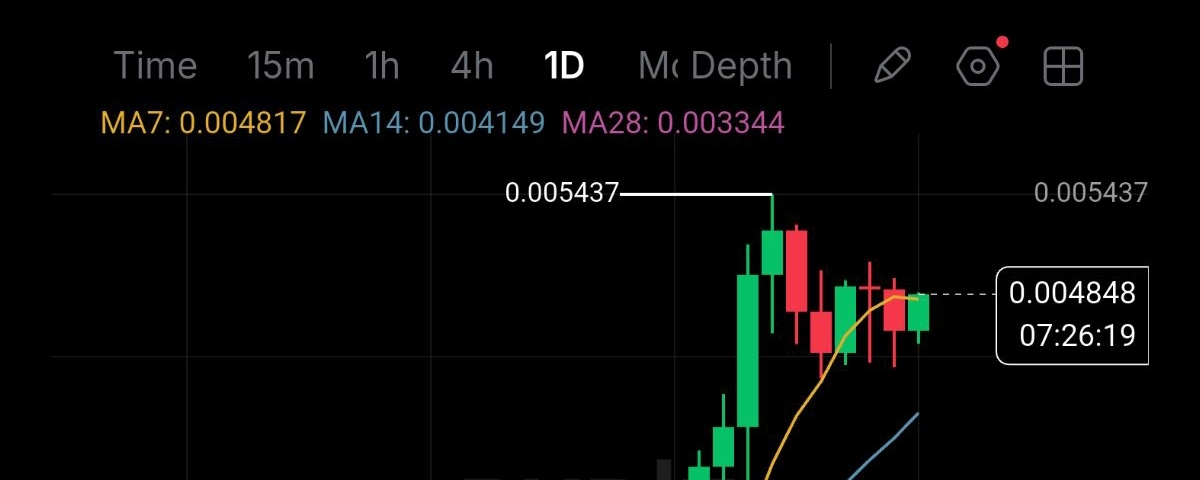


I’m looking at $PUMP on the 1D timeframe, and the chart is showing a strong bullish trend after a prolonged accumulation phase. Price is currently around 0.004848, close to the 24H high of 0.004859. The move from the 0.001759 area has been strong, but after reaching 0.005437, price has started consolidating near the highs. I would avoid chasing the current price and prefer a confirmed breakout or a controlled pullback.
Market Structure: The visible structure is clearly bullish, with higher highs and higher lows developing throughout the chart. Price broke out from the earlier consolidation and accelerated toward 0.005437. The current candles are consolidating below that high rather than showing a confirmed reversal. My view is that the higher-timeframe structure remains bullish, while the short-term phase is consolidation near resistance.
Key levels are 0.005437 as the major resistance and recent swing high, followed by 0.004859 as the immediate resistance. On the downside, I’m watching 0.00480–0.00460 as the first short-term support area, followed by 0.004149 around the MA14, 0.003525 as a visible chart level, and 0.003344 around the MA28. The major visible swing low is around 0.001759.
Liquidity is likely concentrated above 0.005437, where a clean breakout could attract additional buying. On the downside, the recent consolidation lows around 0.00460–0.00480 are important, while deeper liquidity may sit around the MA14 and MA28 zones.
The overall trend is strongly bullish. Price is above all three visible moving averages: MA7 at 0.004817, MA14 at 0.004149 and MA28 at 0.003344. The MA alignment is bullish and supports the continuation structure. However, price is extended significantly above the MA14 and MA28, so a pullback would not automatically mean the trend has reversed.
The recent candles near 0.005437 show rejection and profit-taking, followed by several smaller candles. I’m treating this as consolidation near the highs rather than a confirmed bearish reversal. A strong daily close above 0.005437 would be the important confirmation for further bullish continuation.
Volume strongly increased during the major breakout and rally, which supports the bullish move. Recent volume has declined compared with the breakout spike, suggesting momentum has cooled while price consolidates. I would prefer to see volume expand again during a breakout above 0.005437 before considering the move high-confidence.
The visible indicators are MA7, MA14, MA28 and MAVOL. Price remains above all three moving averages, which is bullish. RSI, MACD, EMA and VWAP are not visible, so I’m not assuming their readings.
For the breakout and retest, the key level for me is 0.005437. A clean 1D close above this level with strong volume would confirm a new bullish breakout. Ideally, I would then want to see the previous resistance hold as support on a retest.
In the bullish scenario, I want to see a confirmed daily breakout above 0.005437 with volume, or a controlled pullback that holds the 0.00480–0.00460 area. The visible chart does not provide reliable targets above 0.005437, so I would not invent exact TP levels beyond that breakout. The first objective would simply be continuation above the previous high, followed by price discovery.
In the bearish scenario, rejection from 0.005437 followed by a loss of the recent consolidation support around 0.00460–0.00480 would increase the probability of a deeper pullback. I would then watch 0.004149, followed by 0.003525 and 0.003344. A sustained break below 0.003344 would significantly weaken the current bullish structure.
For entry, at 0.004848 I’m not chasing the move because price is close to resistance. My preferred long setup would be a pullback toward 0.00460–0.00480 followed by a bullish reaction, or a confirmed daily breakout above 0.005437 followed by a successful retest. For a short, I would wait for a clear rejection near 0.005437 and confirmation that the 0.00460–0.00480 support zone has failed.
For risk management, a hypothetical long around 0.00470 could use an invalidation below the recent consolidation structure, depending on the exact entry and risk tolerance. I would not use an arbitrary tight stop because the recent candles have been volatile. The logical invalidation should be based on the support structure rather than a fixed percentage.
The bullish thesis becomes significantly weaker if price loses the recent consolidation support and especially if it breaks below 0.004149. A sustained break below 0.003344 would be a much stronger structural warning. On the other hand, a strong daily close above 0.005437 with volume would confirm renewed bullish momentum.
Final Verdict: I remain bullish on the 1D structure, but I’m choosing WAIT rather than chasing price near the highs. My preferred plan is either a controlled pullback into 0.00460–0.00480 followed by a bullish reaction, or a confirmed daily breakout above 0.005437 with volume and a successful retest. The trend is strong, the moving averages are bullish and the breakout had strong volume, but the current price is extended and sitting close to major resistance.
Confidence: Medium-High on the bullish structure, Medium on the immediate entry.
This analysis is based only on the visible chart and is for educational purposes, not financial advice.