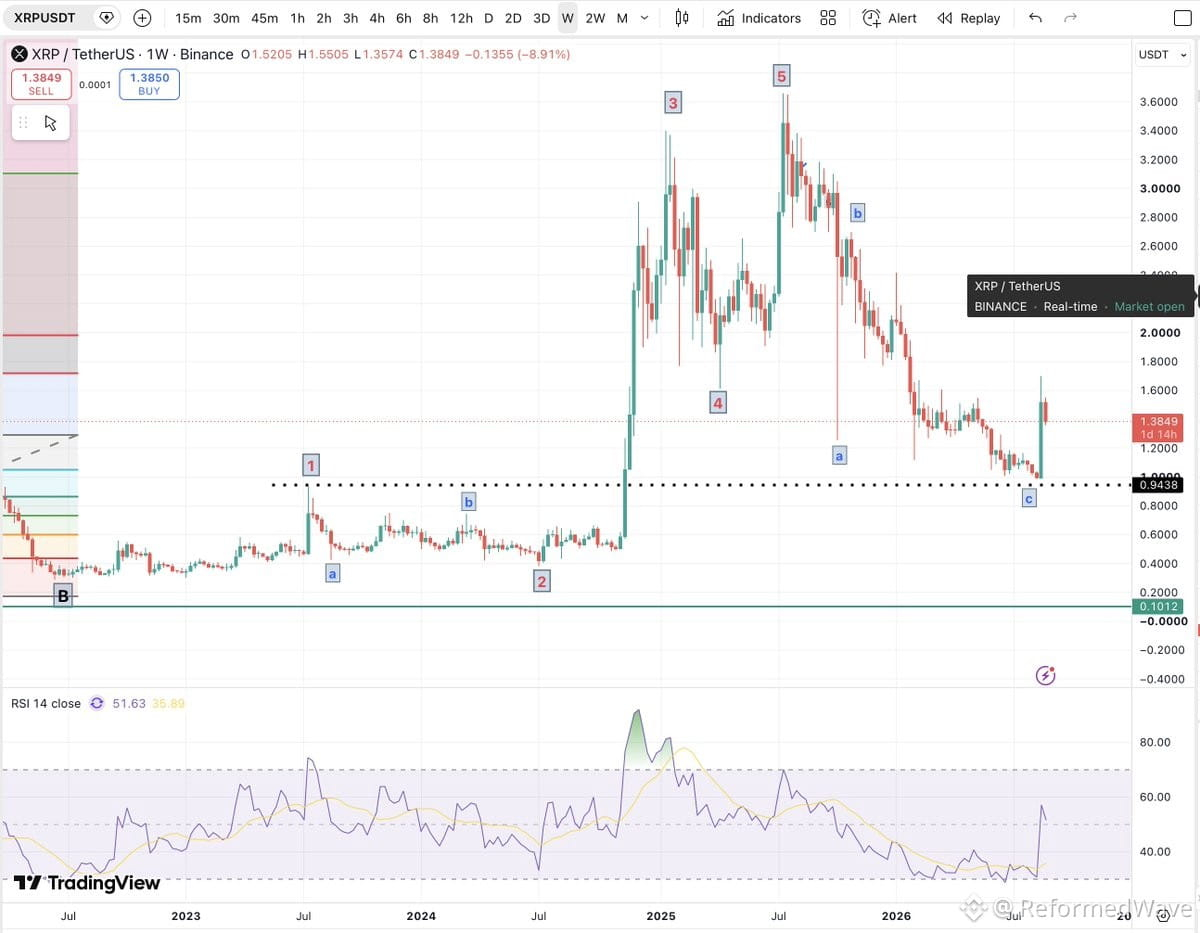
$XRP chart looks more constructive now, but this is a potential major bottom — not yet a confirmed new bull trend.
Bullish case is credible:
The drop from ~$3.65 reads as a completed A–B–C correction. Wave C landed right in the major $0.94–$1.00 support zone, near the old breakout area. The forceful weekly reversal plus RSI bouncing off oversold tells me we saw real capitulation and genuine demand stepped in.
Holding above ~$1.20–$1.30, then breaking $1.70, would materially strengthen the bottoming case. A reclaim above $2.00 would give much stronger evidence the larger uptrend has resumed.
But there's a clear bearish alternative. This surge could just be an oversold relief rally inside a five-wave decline within wave C. The rejection around $1.55 and weekly close near $1.39 show sellers are still active. If $XRP fails beneath $1.55–$1.70 and turns down impulsively, we could easily retest $1.00–$0.94.
The critical line is $0.94. A decisive weekly break below it damages the bullish structure and exposes ~$0.75, then potentially the old consolidation zone around $0.55–$0.60.
I've seen this movie before — stay disciplined, respect the structure, and watch that $0.94 level like a hawk.
Bullish case is credible:
The drop from ~$3.65 reads as a completed A–B–C correction. Wave C landed right in the major $0.94–$1.00 support zone, near the old breakout area. The forceful weekly reversal plus RSI bouncing off oversold tells me we saw real capitulation and genuine demand stepped in.
Holding above ~$1.20–$1.30, then breaking $1.70, would materially strengthen the bottoming case. A reclaim above $2.00 would give much stronger evidence the larger uptrend has resumed.
But there's a clear bearish alternative. This surge could just be an oversold relief rally inside a five-wave decline within wave C. The rejection around $1.55 and weekly close near $1.39 show sellers are still active. If $XRP fails beneath $1.55–$1.70 and turns down impulsively, we could easily retest $1.00–$0.94.
The critical line is $0.94. A decisive weekly break below it damages the bullish structure and exposes ~$0.75, then potentially the old consolidation zone around $0.55–$0.60.
I've seen this movie before — stay disciplined, respect the structure, and watch that $0.94 level like a hawk.