BREAKING: Fidelity’s Timmer Says Bitcoin Is Testing $80,000 — A Break Would Confirm a Double Bottom
Bitcoin is back at a level that decides whether the 2026 bounce is a real base or just another failed rally.
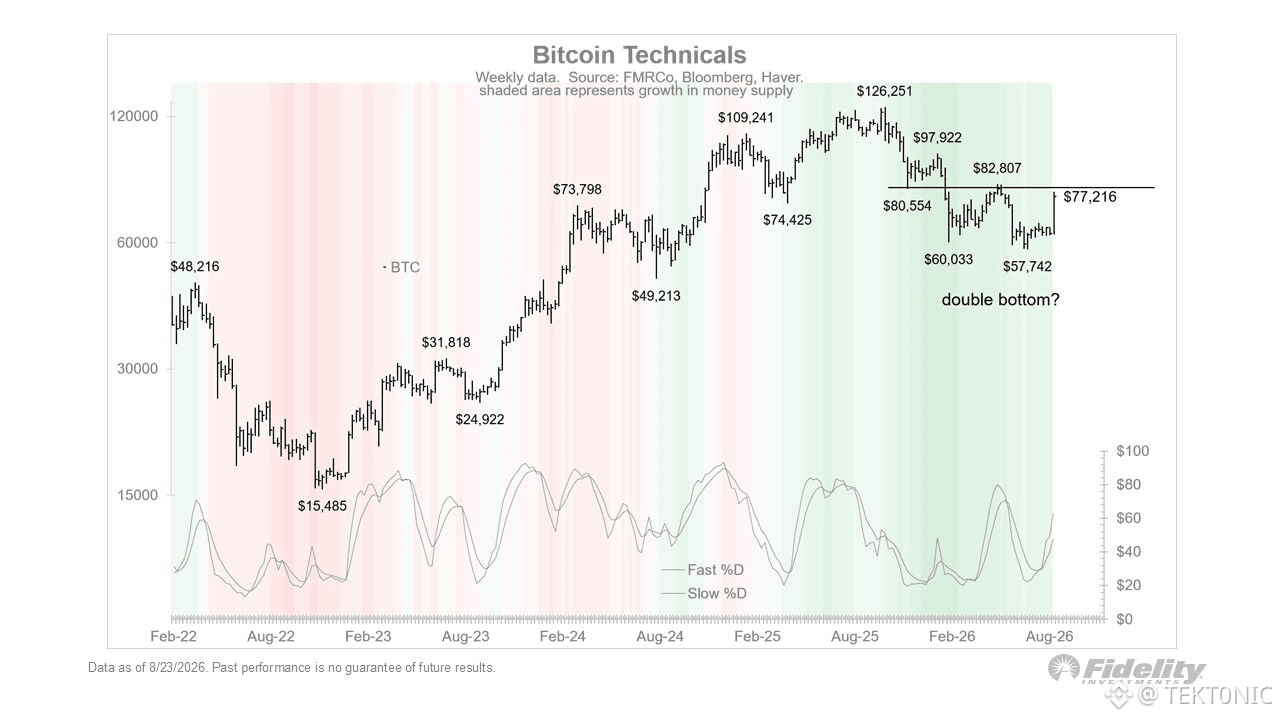
According to Fidelity’s Jurrien Timmer, $80,000 is the resistance to beat. A clean move above it would confirm the double-bottom pattern marked on Fidelity’s weekly chart.
Key Details:
> The chart shows twin lows near $60,033 and $57,742, with price now pressing $77,216–$80,000.
> Overhead supply sits at $80,554, $82,807, and $97,922 after the $126,251 peak.
> The weekly stochastic has turned up from oversold, the same kind of reset that preceded earlier cycle legs.
The pattern only counts if $80,000 gives way. Hold below it and Bitcoin is still range-bound under the post-top shelf. Break it, and Timmer’s double-bottom read becomes the working map.
Fidelity: Bitcoin Tests $80K — Breakout Would Confirm the Double Bottom
Do you take $80,000 as the confirmation trigger, or do you need a weekly close through $82,800 first?
Bitcoin is back at a level that decides whether the 2026 bounce is a real base or just another failed rally.
According to Fidelity’s Jurrien Timmer, $80,000 is the resistance to beat. A clean move above it would confirm the double-bottom pattern marked on Fidelity’s weekly chart.
Key Details:
> The chart shows twin lows near $60,033 and $57,742, with price now pressing $77,216–$80,000.
> Overhead supply sits at $80,554, $82,807, and $97,922 after the $126,251 peak.
> The weekly stochastic has turned up from oversold, the same kind of reset that preceded earlier cycle legs.
The pattern only counts if $80,000 gives way. Hold below it and Bitcoin is still range-bound under the post-top shelf. Break it, and Timmer’s double-bottom read becomes the working map.
Fidelity: Bitcoin Tests $80K — Breakout Would Confirm the Double Bottom
Do you take $80,000 as the confirmation trigger, or do you need a weekly close through $82,800 first?