$BNB /USDT Technical Analysis: Pullback Near $700 Level
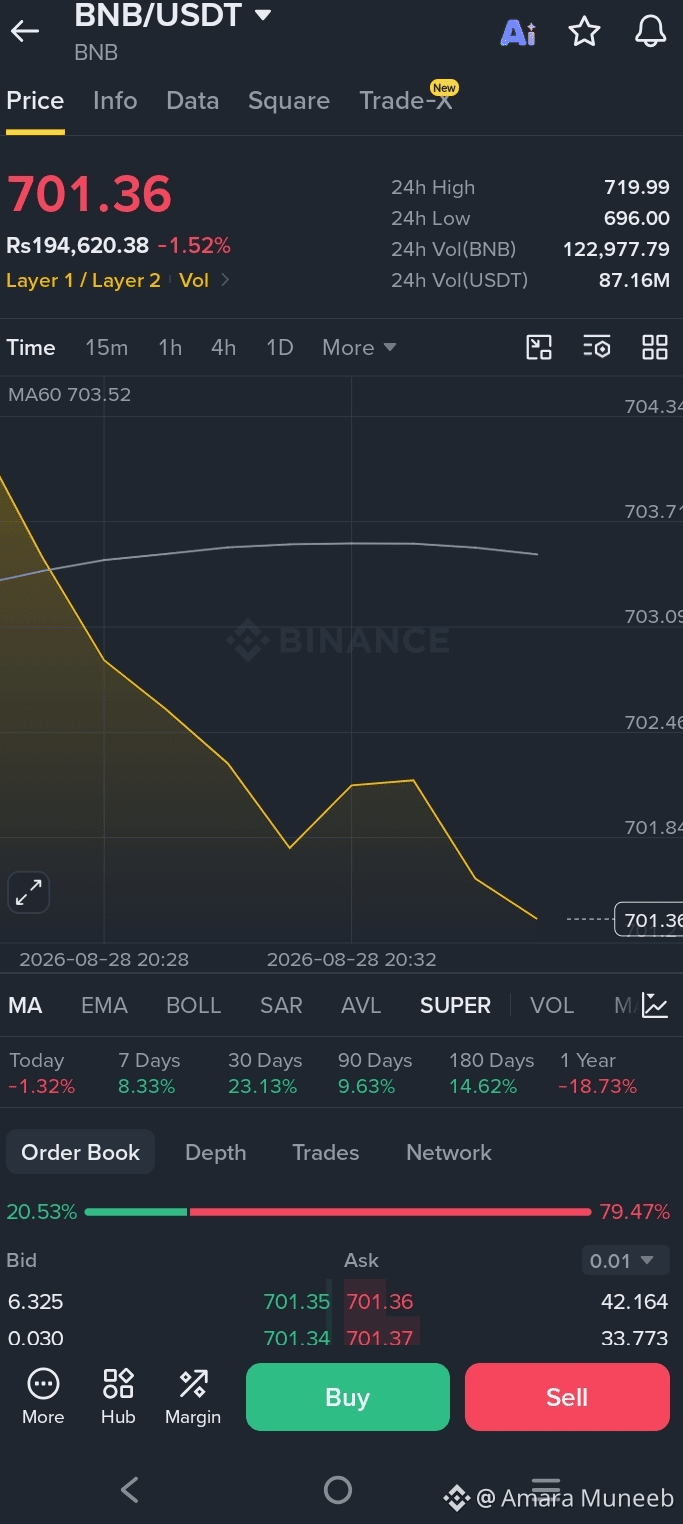
BNB/USDT is currently trading around $701.36, reflecting a minor short-term pullback of -1.52%. On the short-term chart, price action shows downward pressure after failing to sustain above the $704 mark, currently moving below the MA60 resistance line ($703.52).
Despite the short-term dip, the broader trend remains remarkably strong:
30-Day Gain: +23.13%
180-Day Gain: +14.62%
24h High / Low: $719.99 / $696.00
24h Volume: 87.16M USDT
The $696–$700 range serves as critical short-term support. A strong bounce off this zone could retest the $715–$720 resistance area, while a break below $696 may open up further consolidation.
🔥 Enjoying this analysis? Don't forget to LIKE, SHARE, and FOLLOW for more daily market updates and technical insights! 🚀
#BNB #Crypto #Binance #CryptoAnalysis #TechnicalAnalysis #BNBUSDT #Trading #CryptoNews
BNB/USDT is currently trading around $701.36, reflecting a minor short-term pullback of -1.52%. On the short-term chart, price action shows downward pressure after failing to sustain above the $704 mark, currently moving below the MA60 resistance line ($703.52).
Despite the short-term dip, the broader trend remains remarkably strong:
30-Day Gain: +23.13%
180-Day Gain: +14.62%
24h High / Low: $719.99 / $696.00
24h Volume: 87.16M USDT
The $696–$700 range serves as critical short-term support. A strong bounce off this zone could retest the $715–$720 resistance area, while a break below $696 may open up further consolidation.
🔥 Enjoying this analysis? Don't forget to LIKE, SHARE, and FOLLOW for more daily market updates and technical insights! 🚀
#BNB #Crypto #Binance #CryptoAnalysis #TechnicalAnalysis #BNBUSDT #Trading #CryptoNews