
Shontz
173 Публикации

Shontz
Twitter: @sxontz
Открытая сделка
Трейдер с регулярными сделками
3.5 г
27 подписок(и/а)
1.3K+ подписчиков(а)
1.1K+ понравилось
Посты
Портфель
Все
Цитирования

The BitVM Squeeze: Dissecting the 560% Volume-to-Market-Cap Detachment
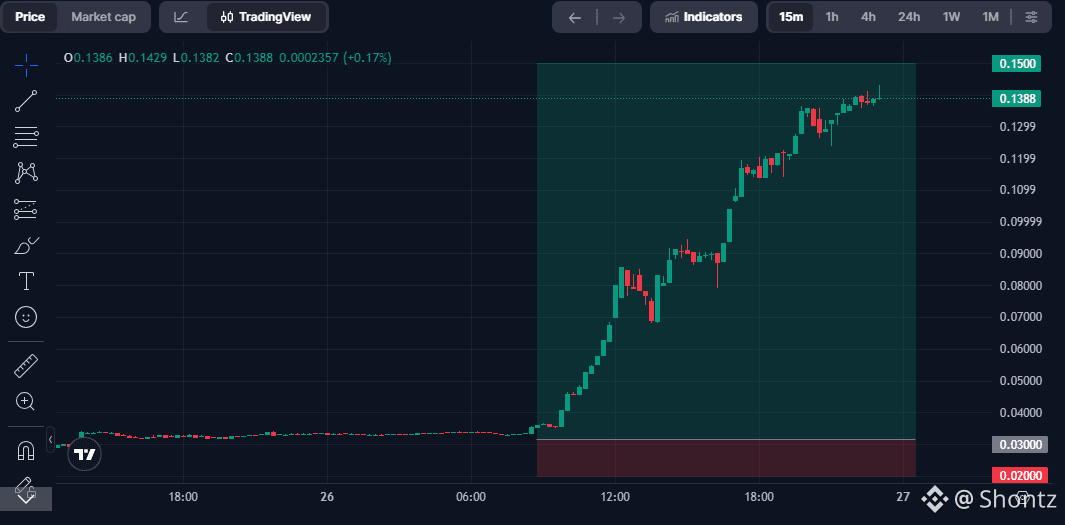
$BTR has broken out into price discovery on the 15-minute timeframe, surging +317% from its $0.033 baseline to print local highs at $0.1429 before consolidating around $0.1390. While retail momentum chases the vertical impulse, the market structure is defined by an extreme volume anomaly: 24-hour trading turnover has exploded by 4,678% to reach $261.04M against a circulating market capitalization of just $46.34M. When daily volume outpaces the circulating float by 563%, price discovery is driven by rapid liquidity exhaustion and high-velocity short covers rather than standard spot accumulation.
The structural catalyst behind this move originates from its position as the first BitVM-powered Bitcoin Layer-2 rollup. Supported by $25M in institutional backing from firms like Polychain Capital and Franklin Templeton, Bitlayer brings EVM execution and trust-minimized bridge infrastructure directly to Bitcoin DeFi. After weeks of tight compression near $0.030, resting ask-side depth on secondary order books was completely dried up. Once market buy orders swept the baseline resistance, crowded short positions were caught off guard, triggering cascading buy-stops that created a sharp upward liquidity vacuum.
The 15-minute chart shows clean displacement with minimal pullback, but trading at a 563% volume-to-market-cap ratio on a 333.28M circulating supply creates elevated two-way volatility. As price tests the $0.1400–$0.1500 psychological ceiling, early accumulators are beginning to distribute into aggressive breakout bids. To sustain this trend without a deep mean reversion, buyers must defend the $0.1150–$0.1200 retest shelf as new structural support while trading volume stabilizes.
Do you expect $BTR to consolidate above $0.1200 for another push toward $0.1600, or will it see a deeper liquidity flush toward previous range lows?
$BTR has broken out into price discovery on the 15-minute timeframe, surging +317% from its $0.033 baseline to print local highs at $0.1429 before consolidating around $0.1390. While retail momentum chases the vertical impulse, the market structure is defined by an extreme volume anomaly: 24-hour trading turnover has exploded by 4,678% to reach $261.04M against a circulating market capitalization of just $46.34M. When daily volume outpaces the circulating float by 563%, price discovery is driven by rapid liquidity exhaustion and high-velocity short covers rather than standard spot accumulation.
The structural catalyst behind this move originates from its position as the first BitVM-powered Bitcoin Layer-2 rollup. Supported by $25M in institutional backing from firms like Polychain Capital and Franklin Templeton, Bitlayer brings EVM execution and trust-minimized bridge infrastructure directly to Bitcoin DeFi. After weeks of tight compression near $0.030, resting ask-side depth on secondary order books was completely dried up. Once market buy orders swept the baseline resistance, crowded short positions were caught off guard, triggering cascading buy-stops that created a sharp upward liquidity vacuum.
The 15-minute chart shows clean displacement with minimal pullback, but trading at a 563% volume-to-market-cap ratio on a 333.28M circulating supply creates elevated two-way volatility. As price tests the $0.1400–$0.1500 psychological ceiling, early accumulators are beginning to distribute into aggressive breakout bids. To sustain this trend without a deep mean reversion, buyers must defend the $0.1150–$0.1200 retest shelf as new structural support while trading volume stabilizes.
Do you expect $BTR to consolidate above $0.1200 for another push toward $0.1600, or will it see a deeper liquidity flush toward previous range lows?
The Capital Rotation Engine: How Macro Flow Cascades Across Top Assets
In digital asset market structure, capital expansion follows a systematic sequence rather than lifting all assets simultaneously. As macro liquidity expands and institutional capital rotates into spot order books, price discovery moves predictably down the risk curve from macro reserve assets to high-throughput execution ecosystems.
The cycle begins with $BTC establishing market direction. When sovereign bond buybacks soften fiat strength and spot ETF inflows accelerate, institutional allocators deploy heavily into primary liquidity books. This initial phase drives market dominance upward as secondary float is absorbed. Once price reaches high-timeframe psychological milestones and enters a consolidation shelf, institutional desks begin trimming exposure to rotate into higher-beta ecosystems.
That secondary liquidity wave immediately flows into the dominant smart contract platforms. Smart contract capital prioritizes the deep DeFi and staking liquidity of $ETH , providing a foundation for decentralized financial rails. Concurrently, high-velocity trading capital shifts aggressively into high-throughput networks like $SOL to capture decentralized exchange volume surges and ecosystem momentum. When these Layer-1 giants confirm structural breakouts with rising spot volume rather than pure perpetual leverage, it confirms that the market has transitioned into a full-scale altcoin expansion.
Navigating this multi-asset environment requires tracking spot volume absorption alongside derivatives positioning. Chasing Layer-1 breakouts before macro dominance stalls often leads to chop, whereas timing entries during confirmed rotation phases lets you trade directly with institutional liquidity.
In digital asset market structure, capital expansion follows a systematic sequence rather than lifting all assets simultaneously. As macro liquidity expands and institutional capital rotates into spot order books, price discovery moves predictably down the risk curve from macro reserve assets to high-throughput execution ecosystems.
The cycle begins with $BTC establishing market direction. When sovereign bond buybacks soften fiat strength and spot ETF inflows accelerate, institutional allocators deploy heavily into primary liquidity books. This initial phase drives market dominance upward as secondary float is absorbed. Once price reaches high-timeframe psychological milestones and enters a consolidation shelf, institutional desks begin trimming exposure to rotate into higher-beta ecosystems.
That secondary liquidity wave immediately flows into the dominant smart contract platforms. Smart contract capital prioritizes the deep DeFi and staking liquidity of $ETH , providing a foundation for decentralized financial rails. Concurrently, high-velocity trading capital shifts aggressively into high-throughput networks like $SOL to capture decentralized exchange volume surges and ecosystem momentum. When these Layer-1 giants confirm structural breakouts with rising spot volume rather than pure perpetual leverage, it confirms that the market has transitioned into a full-scale altcoin expansion.
Navigating this multi-asset environment requires tracking spot volume absorption alongside derivatives positioning. Chasing Layer-1 breakouts before macro dominance stalls often leads to chop, whereas timing entries during confirmed rotation phases lets you trade directly with institutional liquidity.

Descending Trendline Compression and Base Defense: $TUT 4-Hour Breakdown
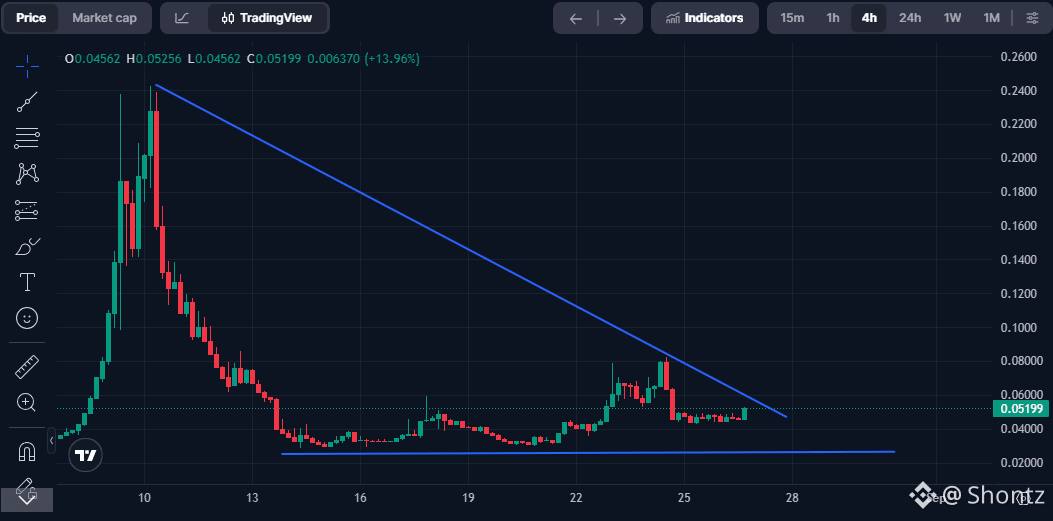
Following a high-velocity expansion toward the $0.2500 peak,$TUT entered a deep multi-week distribution and mean-reversion phase that retraced the entirety of the initial run. Price action has now transitioned from aggressive selling into a defined volatility compression structure, trading near $0.05199 with localized buyers stepping in on the 4-hour timeframe.
The broader market structure is constrained by a clear diagonal descending resistance trendline originating from the $0.2500 macro high, which has repeatedly rejected relief attempts. Below, the market has built a stable horizontal demand floor across the $0.0300–$0.0350 accumulation band. Over recent sessions, price action has formed an ascending sequence of higher lows above this shelf, steadily pinching candle bodies directly against the overhead diagonal barrier.
This multi-week falling wedge structure is rapidly approaching its apex. The persistent defenses above the $0.0400–$0.0450 support zone indicate that secondary sell pressure is drying up as passive limit buyers absorb remaining floating supply. A confirmed 4-hour candle close above the descending trendline ($0.0550–$0.0600) would confirm a structural breakout for$TUT , clearing the path for an expansion toward prior swing highs at $0.0800 and $0.1100. Conversely, failing to clear the diagonal resistance leaves the asset vulnerable to a retest of baseline support near $0.0350.
Do you expect an immediate trendline breakout, or will price retest the lower support shelf before expanding?
#TechnicalAnalysis #CryptoTrading #ChartAnalysis #BinanceSquare
Following a high-velocity expansion toward the $0.2500 peak,$TUT entered a deep multi-week distribution and mean-reversion phase that retraced the entirety of the initial run. Price action has now transitioned from aggressive selling into a defined volatility compression structure, trading near $0.05199 with localized buyers stepping in on the 4-hour timeframe.
The broader market structure is constrained by a clear diagonal descending resistance trendline originating from the $0.2500 macro high, which has repeatedly rejected relief attempts. Below, the market has built a stable horizontal demand floor across the $0.0300–$0.0350 accumulation band. Over recent sessions, price action has formed an ascending sequence of higher lows above this shelf, steadily pinching candle bodies directly against the overhead diagonal barrier.
This multi-week falling wedge structure is rapidly approaching its apex. The persistent defenses above the $0.0400–$0.0450 support zone indicate that secondary sell pressure is drying up as passive limit buyers absorb remaining floating supply. A confirmed 4-hour candle close above the descending trendline ($0.0550–$0.0600) would confirm a structural breakout for$TUT , clearing the path for an expansion toward prior swing highs at $0.0800 and $0.1100. Conversely, failing to clear the diagonal resistance leaves the asset vulnerable to a retest of baseline support near $0.0350.
Do you expect an immediate trendline breakout, or will price retest the lower support shelf before expanding?
#TechnicalAnalysis #CryptoTrading #ChartAnalysis #BinanceSquare
Volume Explosion and the +280% Surge: Deconstructing the $BTR Expansion
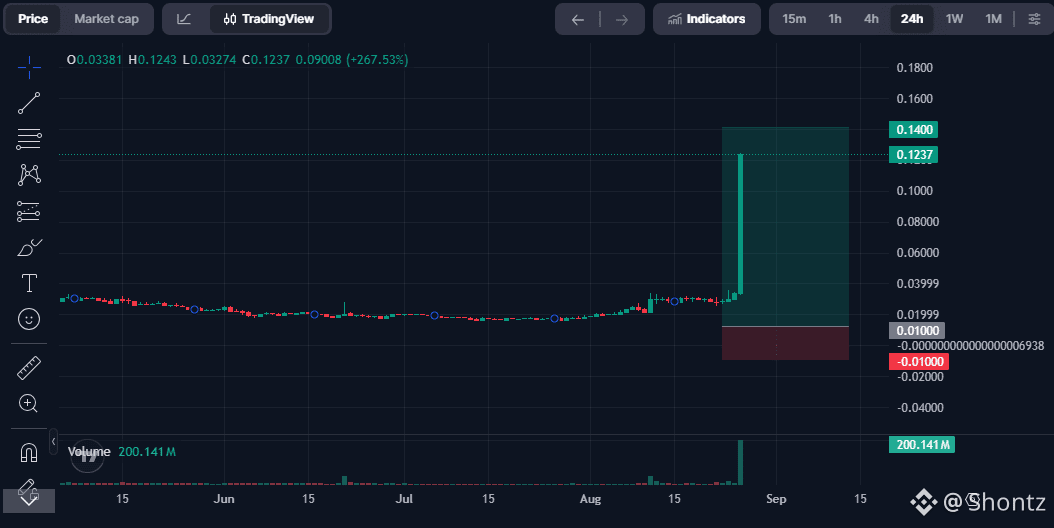
A +280% daily candle paired with a 3,198% volume surge highlights aggressive order book displacement. Bitlayer recorded a violent breakout from its baseline near $0.032 to print highs above $0.125, driving 24-hour turnover past $201M against a circulating market capitalization of just $41.83M. When daily volume exceeds circulating capitalization by roughly 490%, price action stops following passive accumulation and transitions into high-velocity liquidity sweeps and derivatives positioning.
The primary driver behind this move is the sudden exhaustion of thin overhead supply. After weeks of tight compression near $0.033, resting ask liquidity became completely sparse. Once aggressive spot market buys cleared local resistance, the move triggered cascading stop-losses across crowded short positions. Because forced stop orders execute as market buys, this created a liquidity vacuum that propelled price vertically toward $0.140 without giving sellers time to restack depth.
However, trading at a 491% volume-to-market-cap ratio introduces structural fragility into secondary books. With 333.28M tokens circulating out of a 1B maximum supply, high turnover signals speculative leverage churn alongside spot absorption. As price approaches the $0.125–$0.140 band, early bottom buyers and short-term traders begin distributing inventory into incoming retail bids, leaving extended rejection wicks.
For this expansion to sustain rather than suffer a steep mean reversion, buyers must defend the $0.080–$0.090 demand shelf while volume normalizes. Chasing vertical momentum after extreme turnover spikes carries severe slippage risk, making consolidation holding key.
Do you see this expansion establishing a solid floor above $0.10, or will it retrace deeper toward previous range levels?
A +280% daily candle paired with a 3,198% volume surge highlights aggressive order book displacement. Bitlayer recorded a violent breakout from its baseline near $0.032 to print highs above $0.125, driving 24-hour turnover past $201M against a circulating market capitalization of just $41.83M. When daily volume exceeds circulating capitalization by roughly 490%, price action stops following passive accumulation and transitions into high-velocity liquidity sweeps and derivatives positioning.
The primary driver behind this move is the sudden exhaustion of thin overhead supply. After weeks of tight compression near $0.033, resting ask liquidity became completely sparse. Once aggressive spot market buys cleared local resistance, the move triggered cascading stop-losses across crowded short positions. Because forced stop orders execute as market buys, this created a liquidity vacuum that propelled price vertically toward $0.140 without giving sellers time to restack depth.
However, trading at a 491% volume-to-market-cap ratio introduces structural fragility into secondary books. With 333.28M tokens circulating out of a 1B maximum supply, high turnover signals speculative leverage churn alongside spot absorption. As price approaches the $0.125–$0.140 band, early bottom buyers and short-term traders begin distributing inventory into incoming retail bids, leaving extended rejection wicks.
For this expansion to sustain rather than suffer a steep mean reversion, buyers must defend the $0.080–$0.090 demand shelf while volume normalizes. Chasing vertical momentum after extreme turnover spikes carries severe slippage risk, making consolidation holding key.
Do you see this expansion establishing a solid floor above $0.10, or will it retrace deeper toward previous range levels?
#USIranReportedlyReachCeasefireConsensus
Reports indicate that Washington and Tehran may have reached a consensus on critical ceasefire terms, with regional mediation efforts making key progress. Core terms reportedly center around ensuring free maritime navigation through the Strait of Hormuz and lowering regional escalation.
While official signatures from both sides remain pending, markets are already reacting to the shift. Crude oil risk premiums are easing as geopolitical friction cools, while broader equity and digital asset markets see reduced macro pressure from potential supply chain disruptions. Traders and institutional capital are closely watching whether this development provides sustainable tailwinds for risk assets.
$BTC | $ETH $SOL
Reports indicate that Washington and Tehran may have reached a consensus on critical ceasefire terms, with regional mediation efforts making key progress. Core terms reportedly center around ensuring free maritime navigation through the Strait of Hormuz and lowering regional escalation.
While official signatures from both sides remain pending, markets are already reacting to the shift. Crude oil risk premiums are easing as geopolitical friction cools, while broader equity and digital asset markets see reduced macro pressure from potential supply chain disruptions. Traders and institutional capital are closely watching whether this development provides sustainable tailwinds for risk assets.
$BTC | $ETH $SOL
Breaking the Century Mark: Order Flow and Retest Mechanics Behind the $SOL Expansion
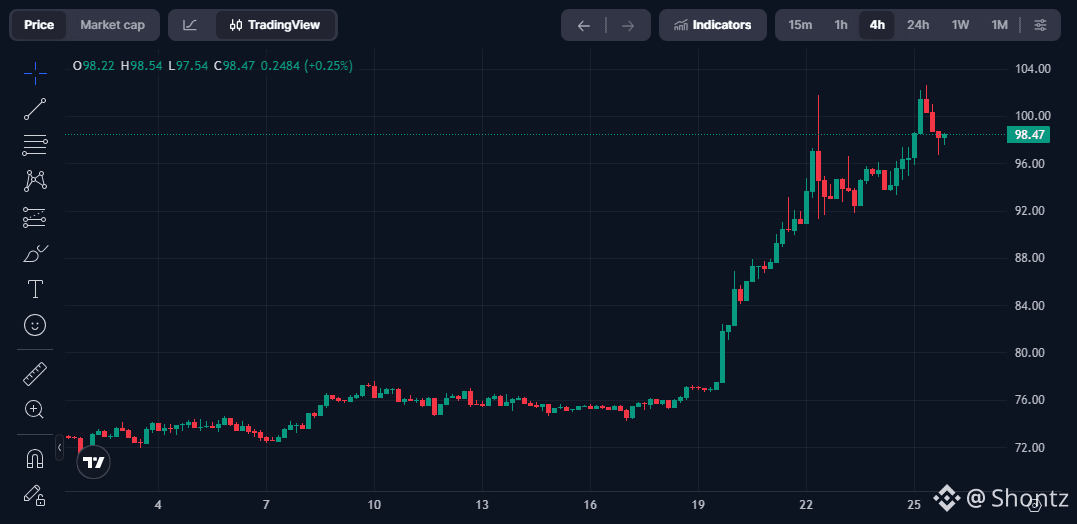
Solana printed an aggressive multi-week expansion, climbing out of its consolidation base between $72.00 and $76.00 to sweep past the major psychological milestone above $103.00 before settling around $98.47. While retail attention zeroes in on the round number, the 4-hour chart structure highlights clear order flow dynamics between breakout demand and overhead profit-taking.
The surge above $100 was driven by a powerful confluence of macro beta and ecosystem tailwinds. As capital rotated heavily across large-caps, trading venues recorded elevated daily volume alongside steady spot inflows, confirming that genuine accumulation was absorbing float rather than relying strictly on synthetic margin. On-chain metrics including surging decentralized exchange activity and network upgrades optimizing transaction capacity further reinforced the fundamental bid for $SOL .
The 4-hour chart shows that the vertical impulse into the $102.00 to $103.50 supply band triggered an aggressive liquidity sweep into resting overhead ask orders. The subsequent rejection and upper wick indicate that early accumulators and short-term leverage distributed inventory into late breakout buyers. The current pullback into the $96.00–$98.50 zone is now testing the previous consolidation high as a new demand shelf.
For continuation toward the next major resistance cluster near $115.00, buyers must defend the $94.00–$96.00 base and decisively flip $100.00 from a resistance ceiling into structural support. Losing the $94.00 shelf would invalidate the immediate momentum, likely sending price back into range-bound accumulation between $88.00 and $92.00.
Do you see $SOL establishing a firm floor above $96.00 for the next leg up, or will it retrace deeper into the $90.00 zone?
Solana printed an aggressive multi-week expansion, climbing out of its consolidation base between $72.00 and $76.00 to sweep past the major psychological milestone above $103.00 before settling around $98.47. While retail attention zeroes in on the round number, the 4-hour chart structure highlights clear order flow dynamics between breakout demand and overhead profit-taking.
The surge above $100 was driven by a powerful confluence of macro beta and ecosystem tailwinds. As capital rotated heavily across large-caps, trading venues recorded elevated daily volume alongside steady spot inflows, confirming that genuine accumulation was absorbing float rather than relying strictly on synthetic margin. On-chain metrics including surging decentralized exchange activity and network upgrades optimizing transaction capacity further reinforced the fundamental bid for $SOL .
The 4-hour chart shows that the vertical impulse into the $102.00 to $103.50 supply band triggered an aggressive liquidity sweep into resting overhead ask orders. The subsequent rejection and upper wick indicate that early accumulators and short-term leverage distributed inventory into late breakout buyers. The current pullback into the $96.00–$98.50 zone is now testing the previous consolidation high as a new demand shelf.
For continuation toward the next major resistance cluster near $115.00, buyers must defend the $94.00–$96.00 base and decisively flip $100.00 from a resistance ceiling into structural support. Losing the $94.00 shelf would invalidate the immediate momentum, likely sending price back into range-bound accumulation between $88.00 and $92.00.
Do you see $SOL establishing a firm floor above $96.00 for the next leg up, or will it retrace deeper into the $90.00 zone?
Hong Kong exported 56.193 tons of gold to mainland China in July.
That’s a serious amount of gold moving into the mainland.
Chinese demand for gold is clearly still strong.
The bigger question is: how much more gold will China keep absorbing?
#HKJulyGoldNetExportsToMainland56.193Tons
That’s a serious amount of gold moving into the mainland.
Chinese demand for gold is clearly still strong.
The bigger question is: how much more gold will China keep absorbing?
#HKJulyGoldNetExportsToMainland56.193Tons
Why Dollar-Cost Averaging (DCA) Beats the Stress of Perfect Timing
Trying to pick the exact bottom of a volatile crypto market drains both capital and patience. When traders try to execute a single all-in entry, they deal with constant emotional friction: entering too early leads to panic selling during deeper pullbacks, while waiting on the sidelines causes intense FOMO once price suddenly rips upward. Dollar-Cost Averaging (DCA) replaces emotional guessing with a strict mathematical process, allowing you to build long-term exposure without caring about intraday noise.
The mechanics of DCA prove their value during multi-month consolidations on blue-chip assets. Consider $BTC: a trader attempting a single lump-sum purchase during a heavy range often gets stopped out by sudden liquidation wicks. By splitting capital into fixed recurring buys, price volatility works in your favor. When price drops, the same dollar allocation automatically buys more units, systematically lowering your average cost basis and turning pullbacks into accumulation phases.
This structured accumulation model becomes even more critical on Layer-1 tokens that face scheduled token unlocks and float expansion. An asset like $SUI often chops beneath major psychological levels as spot books absorb monthly supply releases. Trying to time the exact reversal candle usually ends in buying local leverage tops. With a disciplined DCA strategy, long-term investors steadily accumulate supply during high-volume discount zones instead of gambling on short-term breakout candles.
Do you automate your DCA on a fixed calendar schedule, or do you manually buy only on heavy red days?
#BİNANCESQUAR #cryptotrading #RiskManagement
Trying to pick the exact bottom of a volatile crypto market drains both capital and patience. When traders try to execute a single all-in entry, they deal with constant emotional friction: entering too early leads to panic selling during deeper pullbacks, while waiting on the sidelines causes intense FOMO once price suddenly rips upward. Dollar-Cost Averaging (DCA) replaces emotional guessing with a strict mathematical process, allowing you to build long-term exposure without caring about intraday noise.
The mechanics of DCA prove their value during multi-month consolidations on blue-chip assets. Consider $BTC: a trader attempting a single lump-sum purchase during a heavy range often gets stopped out by sudden liquidation wicks. By splitting capital into fixed recurring buys, price volatility works in your favor. When price drops, the same dollar allocation automatically buys more units, systematically lowering your average cost basis and turning pullbacks into accumulation phases.
This structured accumulation model becomes even more critical on Layer-1 tokens that face scheduled token unlocks and float expansion. An asset like $SUI often chops beneath major psychological levels as spot books absorb monthly supply releases. Trying to time the exact reversal candle usually ends in buying local leverage tops. With a disciplined DCA strategy, long-term investors steadily accumulate supply during high-volume discount zones instead of gambling on short-term breakout candles.
Do you automate your DCA on a fixed calendar schedule, or do you manually buy only on heavy red days?
#BİNANCESQUAR #cryptotrading #RiskManagement

$STX Liquidity Sweep & Retest: Spot Expansion vs. Overhead Supply
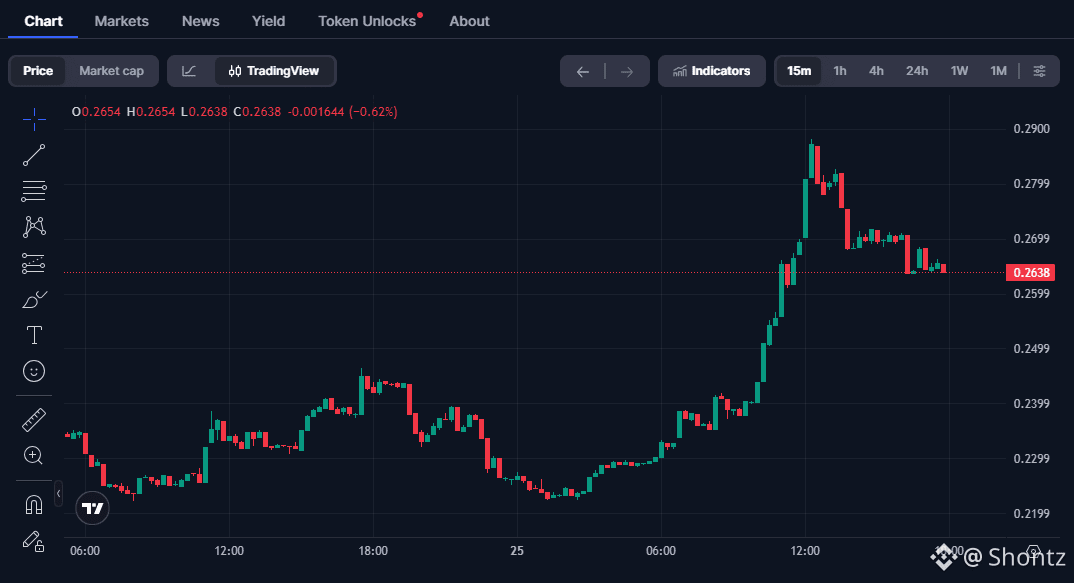
$STX printed an aggressive intraday expansion, surging from a baseline low of $0.2200 to tap local highs at $0.2850 before retracing to consolidate around $0.2638. While the +8.25% daily move reflects strong momentum driven by Bitcoin Layer-2 beta and the rollout of the PoX-5 protocol upgrade, the 15-minute price action reveals clear order flow dynamics between breakout traders and resting supply.
The rapid vertical run into the $0.2800–$0.2850 zone functioned as an aggressive liquidity sweep into overhead resistance. After clearing buy-stop liquidity above the prior consolidation range, price encountered heavy passive limit sell orders, stalling upward displacement and leaving an extended upper wick. The subsequent pullback reflects momentum traders and short-term leverage taking profit into the move.
The current retracement into the $0.2600–$0.2640 range is testing a critical structural pivot. This zone represents the original breakout origin and the upper boundary of the previous consolidation shelf. Holding this level as a higher-low demand floor is necessary for buyers to build an organic accumulation base rather than allowing price to slip into a full mean reversion toward $0.2400.
For continuation, bulls must defend the $0.2600 support shelf with spot volume confirmation to target a sustained reclaim of $0.2850. Losing $0.2600 invalidates the immediate intraday breakout and signals further range-bound chop.
Do you expect $STX to establish a firm base above $0.2600, or will it retrace deeper into the $0.2400 demand shelf?
$STX printed an aggressive intraday expansion, surging from a baseline low of $0.2200 to tap local highs at $0.2850 before retracing to consolidate around $0.2638. While the +8.25% daily move reflects strong momentum driven by Bitcoin Layer-2 beta and the rollout of the PoX-5 protocol upgrade, the 15-minute price action reveals clear order flow dynamics between breakout traders and resting supply.
The rapid vertical run into the $0.2800–$0.2850 zone functioned as an aggressive liquidity sweep into overhead resistance. After clearing buy-stop liquidity above the prior consolidation range, price encountered heavy passive limit sell orders, stalling upward displacement and leaving an extended upper wick. The subsequent pullback reflects momentum traders and short-term leverage taking profit into the move.
The current retracement into the $0.2600–$0.2640 range is testing a critical structural pivot. This zone represents the original breakout origin and the upper boundary of the previous consolidation shelf. Holding this level as a higher-low demand floor is necessary for buyers to build an organic accumulation base rather than allowing price to slip into a full mean reversion toward $0.2400.
For continuation, bulls must defend the $0.2600 support shelf with spot volume confirmation to target a sustained reclaim of $0.2850. Losing $0.2600 invalidates the immediate intraday breakout and signals further range-bound chop.
Do you expect $STX to establish a firm base above $0.2600, or will it retrace deeper into the $0.2400 demand shelf?
The Macro Catalyst Behind the Surge: Why $BTC Reclaimed $80,000
Bitcoin’s violent rally from sub-$65,000 levels to tap fresh three-month highs above $81,000 is not a random speculative pop. Instead, it is the direct result of a macro liquidity shift, the revival of the currency debasement trade, and sustained institutional spot absorption across major assets.
The primary catalyst originated in the sovereign debt market, where the U.S. Treasury expanded scheduled bond buybacks in long-dated maturities to 4 billion per operation. When fiscal authorities step in to ease sovereign yields, the U.S. Dollar Index ($DXY) softens, reigniting the classic global debasement trade. Macro capital immediately rotated away from fiat risk and deployed into scarce, supply-inelastic stores of value, pushing spot gold past multi-month resistance and driving aggressive market-buy orders directly into BTC.
This macroeconomic tailwind was heavily reinforced by genuine spot market demand. Institutional spot Bitcoin ETFs recorded aggressive net weekly inflows approaching $2 billion, absorbing secondary market float rather than relying on synthetic margin. As BTC broke through the $72,000–$75,000 supply ceiling, the move triggered over $2.7 billion in forced short liquidations across perpetual contracts. This derivatives squeeze created a liquidity vacuum that propelled BTC directly into the $80,000 psychological threshold while unlocking broad risk-on sentiment across large-caps like $ETH and$SOL.
While immediate overhead resistance sits near the $82,000 region, the $76,000–$76,500 zone has now formed as baseline demand. Sustaining this structural breakout depends on whether spot ETF inflows remain positive and whether capital begins rotating deeper into high-beta ecosystems like ETH , SUI, and $DOGE
Are you expecting BTC to consolidate around $80k, or will the momentum trigger an immediate rotation into ETH and $SOL?
Bitcoin’s violent rally from sub-$65,000 levels to tap fresh three-month highs above $81,000 is not a random speculative pop. Instead, it is the direct result of a macro liquidity shift, the revival of the currency debasement trade, and sustained institutional spot absorption across major assets.
The primary catalyst originated in the sovereign debt market, where the U.S. Treasury expanded scheduled bond buybacks in long-dated maturities to 4 billion per operation. When fiscal authorities step in to ease sovereign yields, the U.S. Dollar Index ($DXY) softens, reigniting the classic global debasement trade. Macro capital immediately rotated away from fiat risk and deployed into scarce, supply-inelastic stores of value, pushing spot gold past multi-month resistance and driving aggressive market-buy orders directly into BTC.
This macroeconomic tailwind was heavily reinforced by genuine spot market demand. Institutional spot Bitcoin ETFs recorded aggressive net weekly inflows approaching $2 billion, absorbing secondary market float rather than relying on synthetic margin. As BTC broke through the $72,000–$75,000 supply ceiling, the move triggered over $2.7 billion in forced short liquidations across perpetual contracts. This derivatives squeeze created a liquidity vacuum that propelled BTC directly into the $80,000 psychological threshold while unlocking broad risk-on sentiment across large-caps like $ETH and$SOL.
While immediate overhead resistance sits near the $82,000 region, the $76,000–$76,500 zone has now formed as baseline demand. Sustaining this structural breakout depends on whether spot ETF inflows remain positive and whether capital begins rotating deeper into high-beta ecosystems like ETH , SUI, and $DOGE
Are you expecting BTC to consolidate around $80k, or will the momentum trigger an immediate rotation into ETH and $SOL?

The $1.00 Resistance Wall: Deconstructing the $SUI Compression
When a fundamentally high-throughput Layer-1 with rapid ecosystem growth struggles to sustain a breakout above a key psychological round number like $1.00, retail participants often default to questioning the technology. In institutional order flow, however, price action below major thresholds is dictated by three structural forces: scheduled float expansion, derivative open interest positioning, and liquidity absorption regimes.
The prolonged consolidation of $SUI beneath the $1.00 ceiling is driven by an underlying structural reality. The token is navigating a recurring supply-unlock schedule, which continuously expands the circulating float into secondary spot order books. When millions of dollars in team, investor, and community incentives unlock monthly, resting limit sell orders thicken the ask side. Unless organic spot buying volume expands at an equal or greater pace, price naturally compresses as it approaches major distribution bands.
At the same time, the $1.00 level represents an intensely crowded derivatives battlefield. Because round numbers act as psychological benchmarks, retail traders repeatedly build high-leverage long positions during breakout attempts. This creates a surge in Perpetual Open Interest (OI) without corresponding spot Cumulative Volume Delta (CVD) absorption. Large passive limit sellers use these retail breakout bids as exit liquidity, rejecting price velocity and engineering localized liquidation sweeps back down toward baseline demand.
Beneath the price suppression lies an active rebalancing phase. While the $0.95–$1.05 range acts as a multi-month overhead supply shelf, the underlying network continues to log substantial decentralized exchange volume and Total Value Locked (TVL) growth. For $SUI to decisively flip $1.00 from a rigid resistance into a structural floor, the market must absorb circulating supply shocks through aggressive spot accumulation rather than leverage-driven momentum spikes.
When a fundamentally high-throughput Layer-1 with rapid ecosystem growth struggles to sustain a breakout above a key psychological round number like $1.00, retail participants often default to questioning the technology. In institutional order flow, however, price action below major thresholds is dictated by three structural forces: scheduled float expansion, derivative open interest positioning, and liquidity absorption regimes.
The prolonged consolidation of $SUI beneath the $1.00 ceiling is driven by an underlying structural reality. The token is navigating a recurring supply-unlock schedule, which continuously expands the circulating float into secondary spot order books. When millions of dollars in team, investor, and community incentives unlock monthly, resting limit sell orders thicken the ask side. Unless organic spot buying volume expands at an equal or greater pace, price naturally compresses as it approaches major distribution bands.
At the same time, the $1.00 level represents an intensely crowded derivatives battlefield. Because round numbers act as psychological benchmarks, retail traders repeatedly build high-leverage long positions during breakout attempts. This creates a surge in Perpetual Open Interest (OI) without corresponding spot Cumulative Volume Delta (CVD) absorption. Large passive limit sellers use these retail breakout bids as exit liquidity, rejecting price velocity and engineering localized liquidation sweeps back down toward baseline demand.
Beneath the price suppression lies an active rebalancing phase. While the $0.95–$1.05 range acts as a multi-month overhead supply shelf, the underlying network continues to log substantial decentralized exchange volume and Total Value Locked (TVL) growth. For $SUI to decisively flip $1.00 from a rigid resistance into a structural floor, the market must absorb circulating supply shocks through aggressive spot accumulation rather than leverage-driven momentum spikes.

Why Crypto Is Pumping: The 4 Structural Catalysts
The sudden market surge across digital assets is driven by four core structural drivers:
Macro Liquidity: U.S. Treasury bond buybacks doubled from $2B to $4B, softening long-term yields and the Dollar Index ($DXY), pushing macro capital into hard assets like $BTC and gold.
Cascading Short Squeeze: Breaking major overhead resistance triggered over $2.7B in short liquidations, sweeping thin ask books and accelerating upside momentum.
Institutional Spot Inflows: Spot Bitcoin and Ethereum ETFs registered multi-billion-dollar net inflows, providing genuine baseline absorption rather than pure leverage churn.
Regulatory Clarity: Progress around the Clarity Act eased risk-off sentiment, unlocking institutional bids across large-cap altcoins ($ETH , $SOL, $XRP ).
When macro liquidity, spot absorption, and forced liquidations align, price expands fast.
The sudden market surge across digital assets is driven by four core structural drivers:
Macro Liquidity: U.S. Treasury bond buybacks doubled from $2B to $4B, softening long-term yields and the Dollar Index ($DXY), pushing macro capital into hard assets like $BTC and gold.
Cascading Short Squeeze: Breaking major overhead resistance triggered over $2.7B in short liquidations, sweeping thin ask books and accelerating upside momentum.
Institutional Spot Inflows: Spot Bitcoin and Ethereum ETFs registered multi-billion-dollar net inflows, providing genuine baseline absorption rather than pure leverage churn.
Regulatory Clarity: Progress around the Clarity Act eased risk-off sentiment, unlocking institutional bids across large-cap altcoins ($ETH , $SOL, $XRP ).
When macro liquidity, spot absorption, and forced liquidations align, price expands fast.

The Anatomy of the $TUT Volatility Spike: Supply, Leverage, and Liquidation
A +1,000% rally followed by a fast crash is simple market mechanics, not random noise. The full cycle of $TUT shows exactly what happens when thin liquidity meets high leverage.
How the Move Happened:
Supply Shock Ignition: A 16.67% token burn cut total supply from 1B to ~833M. On BNB Chain DEXs with thin order books, this sudden drop in available tokens caused price to gap up instantly on low volume.
The Perpetual Leverage Trap: Once high-leverage perpetual contracts launched, daily trading volume crossed $3.3B—over 20x the actual market cap. Early short sellers were forced to buy back at a loss, sending the price through the $0.24–$0.29 range.
The Liquidation Cascade: Early spot buyers sold heavily into late retail buy orders at the peak. When spot bids disappeared, price fell fast, wiping out over $40M in leveraged long positions in less than an hour.
The Key Takeaway:
Early spot buyers took the profit, while late leveraged traders took the hit. When futures volume is 20x higher than real market depth, price moves toward liquidation levels, not fundamentals.
A +1,000% rally followed by a fast crash is simple market mechanics, not random noise. The full cycle of $TUT shows exactly what happens when thin liquidity meets high leverage.
How the Move Happened:
Supply Shock Ignition: A 16.67% token burn cut total supply from 1B to ~833M. On BNB Chain DEXs with thin order books, this sudden drop in available tokens caused price to gap up instantly on low volume.
The Perpetual Leverage Trap: Once high-leverage perpetual contracts launched, daily trading volume crossed $3.3B—over 20x the actual market cap. Early short sellers were forced to buy back at a loss, sending the price through the $0.24–$0.29 range.
The Liquidation Cascade: Early spot buyers sold heavily into late retail buy orders at the peak. When spot bids disappeared, price fell fast, wiping out over $40M in leveraged long positions in less than an hour.
The Key Takeaway:
Early spot buyers took the profit, while late leveraged traders took the hit. When futures volume is 20x higher than real market depth, price moves toward liquidation levels, not fundamentals.

Bitcoin Stalking the $80,000 Milestone: Genuine Expansion vs. Liquidity Exhaustion
Bitcoin is aggressively knocking on the door of the $80,000 mark after surging from $64,000 to tap local highs near $79,800. While retail timelines are already pricing in a parabolic continuation, examining the structural conditions near psychological thresholds provides a clearer picture of market health.
Key Structural Drivers Behind the Push:
Cascading Squeeze vs. Spot ETF Backing:
The explosive run toward $80k was heavily propelled by forced short liquidations as $BTC cleared key resistance between $72k–$75k. Crucially, this was accompanied by nearly $2B in weekly spot ETF inflows, signaling institutional capital absorption rather than an isolated leverage spike.
The $80k Psychological Wall:
The $79,500–$80,000 band represents a massive cluster of resting limit sell orders and un-triggered call option open interest. As price probes this ceiling, buyers must absorb heavy distribution from earlier dip-buyers taking profit.
Macro Tailwinds:
The broader hard-asset expansion—catalyzed by softer Treasury yields and dollar weakness, continues to provide macro liquidity support for digital assets.
The Structural Reality:
Reaching a major psychological round number like $80,000 often triggers a high-volatility liquidity sweep before genuine price discovery begins. If aggressive breakout buyers get absorbed at the threshold, a healthy consolidation toward the $75,500–$76,500 support shelf would allow the market to build structure.
A clean reclaim of $80k with sustained spot volume opens the door to further expansion, but chasing momentum directly into multi-month supply walls carries high asymmetric risk.
#BTCReaches$80000
Bitcoin is aggressively knocking on the door of the $80,000 mark after surging from $64,000 to tap local highs near $79,800. While retail timelines are already pricing in a parabolic continuation, examining the structural conditions near psychological thresholds provides a clearer picture of market health.
Key Structural Drivers Behind the Push:
Cascading Squeeze vs. Spot ETF Backing:
The explosive run toward $80k was heavily propelled by forced short liquidations as $BTC cleared key resistance between $72k–$75k. Crucially, this was accompanied by nearly $2B in weekly spot ETF inflows, signaling institutional capital absorption rather than an isolated leverage spike.
The $80k Psychological Wall:
The $79,500–$80,000 band represents a massive cluster of resting limit sell orders and un-triggered call option open interest. As price probes this ceiling, buyers must absorb heavy distribution from earlier dip-buyers taking profit.
Macro Tailwinds:
The broader hard-asset expansion—catalyzed by softer Treasury yields and dollar weakness, continues to provide macro liquidity support for digital assets.
The Structural Reality:
Reaching a major psychological round number like $80,000 often triggers a high-volatility liquidity sweep before genuine price discovery begins. If aggressive breakout buyers get absorbed at the threshold, a healthy consolidation toward the $75,500–$76,500 support shelf would allow the market to build structure.
A clean reclaim of $80k with sustained spot volume opens the door to further expansion, but chasing momentum directly into multi-month supply walls carries high asymmetric risk.
#BTCReaches$80000

$DOGE in the Macro Bull Cycle: Speculative Beta vs. Structural Liquidity
Whenever the broader market expands, retail attention quickly shifts to DOGE as the primary benchmark for meme sector momentum. While many view it purely as a speculative asset, analyzing its market behavior across macro cycles reveals how liquidity actually rotates through the market.
The Bull Run Mechanics:
The High-Beta Liquidity Sponge: In early bull run stages, capital concentrates in $BTC as institutional and spot ETF demand leads the charge. Once Bitcoin enters range-bound consolidation near major highs, capital systematically trickles down the risk curve. $DOGE acts as the first high-liquidity destination for retail capital seeking outsized returns.
On-Chain Turnover vs. Order Book Depth: Unlike low-cap meme tokens that suffer massive slippage, Dogecoin commands deep centralized liquidity. When volume expands, large participants use this liquidity pool to position aggressively without immediately destabilizing market depth.
Derivatives Open Interest Traps: Because DOGE rallies are heavily watched, retail traders often enter late with high leverage on perpetual contracts. During rapid expansions, sharp 10%–15% pullbacks are frequently engineered to clear aggressive long open interest before any structural trend continuation occurs.
The Structural Reality:
Parabolic runs in meme assets rarely move in straight lines. A sustainable continuation requires strong baseline consolidation and steady spot volume accumulation rather than leverage spikes.
Instead of chasing green breakout candles at local resistance, look for periods of volume compression and structural demand defense.
#DOGE #CryptoAnalysis #Altcoins #BullRun #TradingTips
Whenever the broader market expands, retail attention quickly shifts to DOGE as the primary benchmark for meme sector momentum. While many view it purely as a speculative asset, analyzing its market behavior across macro cycles reveals how liquidity actually rotates through the market.
The Bull Run Mechanics:
The High-Beta Liquidity Sponge: In early bull run stages, capital concentrates in $BTC as institutional and spot ETF demand leads the charge. Once Bitcoin enters range-bound consolidation near major highs, capital systematically trickles down the risk curve. $DOGE acts as the first high-liquidity destination for retail capital seeking outsized returns.
On-Chain Turnover vs. Order Book Depth: Unlike low-cap meme tokens that suffer massive slippage, Dogecoin commands deep centralized liquidity. When volume expands, large participants use this liquidity pool to position aggressively without immediately destabilizing market depth.
Derivatives Open Interest Traps: Because DOGE rallies are heavily watched, retail traders often enter late with high leverage on perpetual contracts. During rapid expansions, sharp 10%–15% pullbacks are frequently engineered to clear aggressive long open interest before any structural trend continuation occurs.
The Structural Reality:
Parabolic runs in meme assets rarely move in straight lines. A sustainable continuation requires strong baseline consolidation and steady spot volume accumulation rather than leverage spikes.
Instead of chasing green breakout candles at local resistance, look for periods of volume compression and structural demand defense.
#DOGE #CryptoAnalysis #Altcoins #BullRun #TradingTips

Why Price Returns to Liquidity Imbalances (Fair Value Gaps)
When price moves aggressively in one direction, retail traders often see strength and chase the green candle. In institutional order flow, however, rapid displacement creates an anomaly known as a Fair Value Gap (FVG) or liquidity imbalance.
Understanding why price returns to rebalance these zones is the difference between chasing volatility and executing with precision.
The Mechanics of Inefficient Pricing:
One-Sided Order Flow: During an aggressive expansion (e.g., a massive 3-candle displacement in $BTC or$ETH ), market buy orders completely overwhelm limit sell orders. Price skips past multiple price tiers without facilitating two-way trade.
The Liquidity Vacuum: A standard auction requires buy orders to meet sell orders at every increment. When displacement happens too fast, resting limit orders are left unfilled, creating an inefficiency between Candle 1's high and Candle 3's low.
The Rebalancing Auction: Markets exist to facilitate trade, not directional momentum. Once the initial momentum exhausts, algorithms route price back into the imbalance to fill resting limit orders and restore structural liquidity before continuing the broader trend.
How to Read the Rebalance:
Healthy Mitigation: Price pulls back into the 50% equilibrium of the imbalance, prints absorption, and immediately resumes the trend.
Structural Invalidation: If price slices completely through the gap and closes below the displacement origin, the move was a forced squeeze rather than true organic expansion.
The Takeaway:
Displacement shows institutional intent; the rebalance shows institutional conviction.
Stop buying the top of impulsive expansion candles. Wait for the market to rebalance its own inefficiency and confirm demand before executing.
When price moves aggressively in one direction, retail traders often see strength and chase the green candle. In institutional order flow, however, rapid displacement creates an anomaly known as a Fair Value Gap (FVG) or liquidity imbalance.
Understanding why price returns to rebalance these zones is the difference between chasing volatility and executing with precision.
The Mechanics of Inefficient Pricing:
One-Sided Order Flow: During an aggressive expansion (e.g., a massive 3-candle displacement in $BTC or$ETH ), market buy orders completely overwhelm limit sell orders. Price skips past multiple price tiers without facilitating two-way trade.
The Liquidity Vacuum: A standard auction requires buy orders to meet sell orders at every increment. When displacement happens too fast, resting limit orders are left unfilled, creating an inefficiency between Candle 1's high and Candle 3's low.
The Rebalancing Auction: Markets exist to facilitate trade, not directional momentum. Once the initial momentum exhausts, algorithms route price back into the imbalance to fill resting limit orders and restore structural liquidity before continuing the broader trend.
How to Read the Rebalance:
Healthy Mitigation: Price pulls back into the 50% equilibrium of the imbalance, prints absorption, and immediately resumes the trend.
Structural Invalidation: If price slices completely through the gap and closes below the displacement origin, the move was a forced squeeze rather than true organic expansion.
The Takeaway:
Displacement shows institutional intent; the rebalance shows institutional conviction.
Stop buying the top of impulsive expansion candles. Wait for the market to rebalance its own inefficiency and confirm demand before executing.

The Cumulative Volume Delta (CVD) Trap: Spot vs. Perp Absorption
Most traders look at green candles and assume strong buying pressure. In modern crypto derivatives markets, looking at price alone without Cumulative Volume Delta (CVD) often leads to entering at the exact top of an expansion.
CVD tracks the net difference between market buy and market sell orders. When evaluated across both spot and perpetual futures, it exposes what the smart money is doing behind the candlestick closes.
Key Structural Scenarios:
Spot CVD Rising + Perp CVD Flat ($BTC ):
Aggressive market buying is coming directly from spot order books. Real capital is taking delivery of the asset rather than borrowing leverage. This represents genuine structural accumulation. Pullbacks in this environment are shallow and quickly bought up.
Perp CVD Rising + Spot CVD Flat ($ETH ):
The price advance is fueled purely by leveraged perpetual contracts. Traders are spamming market long orders on margin while spot participants remain passive. When spot buyers refuse to support higher prices, any sudden sell order triggers cascading long liquidations.
CVD Divergence (Absorption Top):
Price makes a higher high, but Perp CVD prints aggressive buy volume while price fails to expand. This indicates large passive limit sell orders are absorbing market buyers. Once buyer momentum exhausts, price reverses sharply.
The Core Takeaway:
Aggressive market orders move price in the short term, but passive limit orders define where the trend stops.
Instead of chasing green breakouts, check whether spot volume is leading the charge or if leverage is simply running into passive limit walls.
Most traders look at green candles and assume strong buying pressure. In modern crypto derivatives markets, looking at price alone without Cumulative Volume Delta (CVD) often leads to entering at the exact top of an expansion.
CVD tracks the net difference between market buy and market sell orders. When evaluated across both spot and perpetual futures, it exposes what the smart money is doing behind the candlestick closes.
Key Structural Scenarios:
Spot CVD Rising + Perp CVD Flat ($BTC ):
Aggressive market buying is coming directly from spot order books. Real capital is taking delivery of the asset rather than borrowing leverage. This represents genuine structural accumulation. Pullbacks in this environment are shallow and quickly bought up.
Perp CVD Rising + Spot CVD Flat ($ETH ):
The price advance is fueled purely by leveraged perpetual contracts. Traders are spamming market long orders on margin while spot participants remain passive. When spot buyers refuse to support higher prices, any sudden sell order triggers cascading long liquidations.
CVD Divergence (Absorption Top):
Price makes a higher high, but Perp CVD prints aggressive buy volume while price fails to expand. This indicates large passive limit sell orders are absorbing market buyers. Once buyer momentum exhausts, price reverses sharply.
The Core Takeaway:
Aggressive market orders move price in the short term, but passive limit orders define where the trend stops.
Instead of chasing green breakouts, check whether spot volume is leading the charge or if leverage is simply running into passive limit walls.

$TRUMP Pullback: High Turnover vs. Heavy FDV Overhang
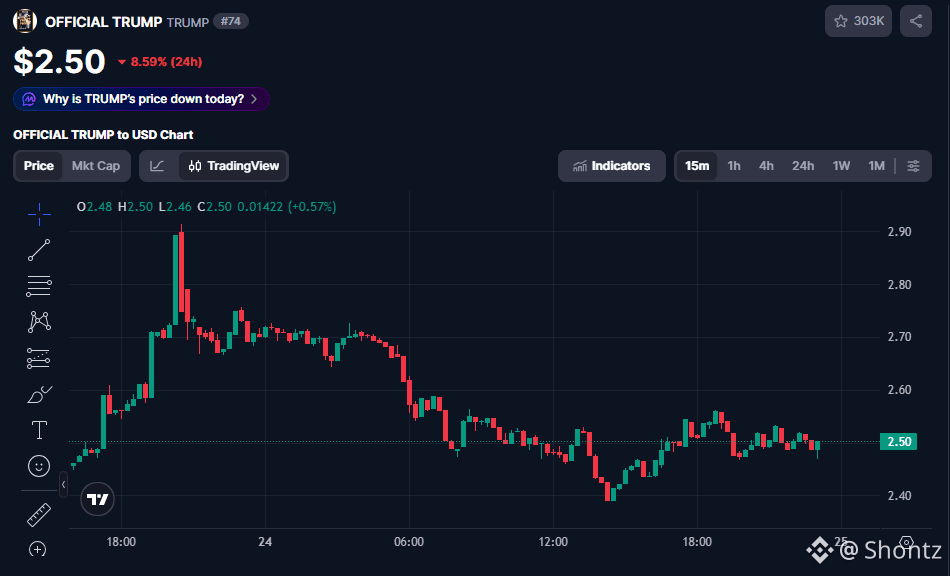
$TRUMP is experiencing heightened downside volatility, trading around $2.50 after failing to sustain a brief push toward the $2.90 region. With 24-hour volume surging over 48% to $732M against a $627M market cap, the asset is seeing aggressive turnover and liquidity extraction.
Key Structural Drivers:
Turnover & Vol/MCap Velocity:
A 24-hour volume of $732M exceeding the circulating market cap (118% Vol/MCap ratio) indicates extreme speculative churn. While spikes in volume show strong trading interest, failure to expand price higher points to aggressive distribution into retail buy liquidity.
Supply Float & FDV Compression:
With only ~250M tokens circulating out of a 1B max supply (~25% circulating float), the $2.5B Fully Diluted Valuation (FDV) creates sustained structural overhang. Low-float tokens often experience heavy selling pressure when early holders and liquidity providers de-risk.
Support Defense vs. Lower Lows:
After sweeping local highs near $2.90, price broke lower to test the $2.39–$2.40 demand zone. While short-term buyers defended this level to push price back toward $2.50, the short-term market structure remains in a cautious, range-bound regime.
The Structural Reality:
When an asset with high FDV experiences sharp volume without directional follow-through, momentum traders often get trapped at the top of the range. Reclaiming the $2.75–$2.80 resistance zone with strong spot absorption is necessary to invalidate the current downtrend structure.
Watch how price behaves around the $2.40 baseline demand rather than chasing intraday bounces.
#Trump #CryptoAnalysis #Altcoins
$TRUMP is experiencing heightened downside volatility, trading around $2.50 after failing to sustain a brief push toward the $2.90 region. With 24-hour volume surging over 48% to $732M against a $627M market cap, the asset is seeing aggressive turnover and liquidity extraction.
Key Structural Drivers:
Turnover & Vol/MCap Velocity:
A 24-hour volume of $732M exceeding the circulating market cap (118% Vol/MCap ratio) indicates extreme speculative churn. While spikes in volume show strong trading interest, failure to expand price higher points to aggressive distribution into retail buy liquidity.
Supply Float & FDV Compression:
With only ~250M tokens circulating out of a 1B max supply (~25% circulating float), the $2.5B Fully Diluted Valuation (FDV) creates sustained structural overhang. Low-float tokens often experience heavy selling pressure when early holders and liquidity providers de-risk.
Support Defense vs. Lower Lows:
After sweeping local highs near $2.90, price broke lower to test the $2.39–$2.40 demand zone. While short-term buyers defended this level to push price back toward $2.50, the short-term market structure remains in a cautious, range-bound regime.
The Structural Reality:
When an asset with high FDV experiences sharp volume without directional follow-through, momentum traders often get trapped at the top of the range. Reclaiming the $2.75–$2.80 resistance zone with strong spot absorption is necessary to invalidate the current downtrend structure.
Watch how price behaves around the $2.40 baseline demand rather than chasing intraday bounces.
#Trump #CryptoAnalysis #Altcoins
$VELVET Liquidity Flash Breakdown: Anatomy of a Cascading Sell-Off
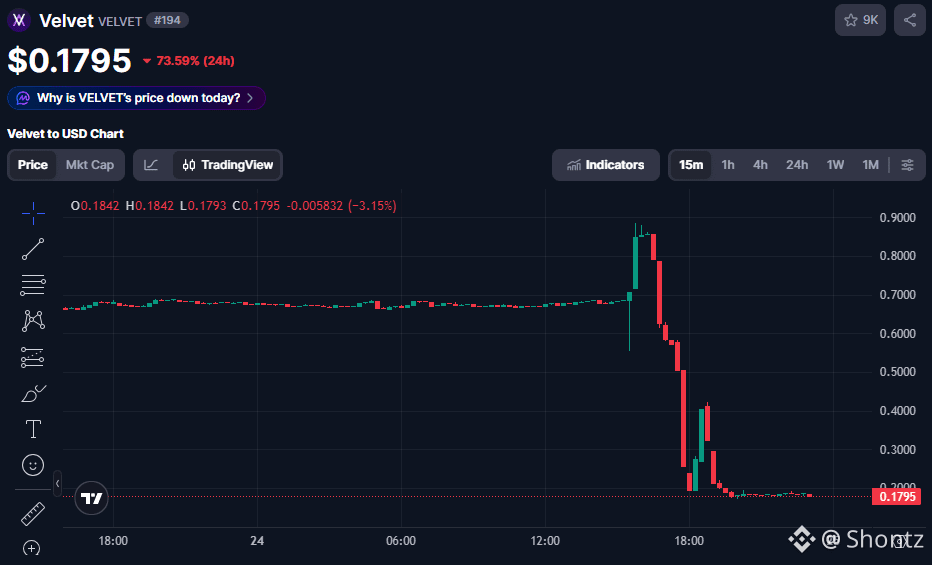
$VELVET printed an abrupt 73% single-day drawdown, collapsing from local highs near $0.88 to trade around the $0.17–$0.18 region. For an asset that saw its 24-hour volume surge over 1,300% to $94M against an $83M market cap, the move highlights the extreme fragility of thin liquidity pools.
Key Structural Drivers:
Liquidity Imbalance & Order Book Slippage:
With liquidity-to-market-cap depth hovering below 5%, the order books were structurally incapable of absorbing sudden large-scale distribution. When large spot or market sell orders hit thin bids, price sliced through multiple support levels with zero demand absorption.
Volume-to-Market-Cap Velocity Spike:
Daily trading volume ($94.9M) exceeding the entire circulating market cap ($83.4M) signals forced panic liquidation rather than orderly price discovery. When long liquidations trigger market-sell cascades in thin derivatives or DEX books, price falls until it reaches historical absolute baseline demand.
Supply & Float Pressure:
With roughly 463M tokens in circulation out of a 1B max supply (~46% circulating float), high FDV overhangs leave mid-cap tokens vulnerable to aggressive repricing whenever market makers pull bid liquidity.
The Structural Reality:
When an asset experiences a violent -70%+ liquidation candle, immediate V-shaped recoveries are rare. The market typically enters a prolonged consolidation phase between $0.17 and $0.25 to rebuild order book depth and clear remaining trapped supply.
Catching falling knives during active liquidation events carries extreme risk. Wait for volume to normalize and structural base formation to confirm before assessing reversal setups.
$VELVET printed an abrupt 73% single-day drawdown, collapsing from local highs near $0.88 to trade around the $0.17–$0.18 region. For an asset that saw its 24-hour volume surge over 1,300% to $94M against an $83M market cap, the move highlights the extreme fragility of thin liquidity pools.
Key Structural Drivers:
Liquidity Imbalance & Order Book Slippage:
With liquidity-to-market-cap depth hovering below 5%, the order books were structurally incapable of absorbing sudden large-scale distribution. When large spot or market sell orders hit thin bids, price sliced through multiple support levels with zero demand absorption.
Volume-to-Market-Cap Velocity Spike:
Daily trading volume ($94.9M) exceeding the entire circulating market cap ($83.4M) signals forced panic liquidation rather than orderly price discovery. When long liquidations trigger market-sell cascades in thin derivatives or DEX books, price falls until it reaches historical absolute baseline demand.
Supply & Float Pressure:
With roughly 463M tokens in circulation out of a 1B max supply (~46% circulating float), high FDV overhangs leave mid-cap tokens vulnerable to aggressive repricing whenever market makers pull bid liquidity.
The Structural Reality:
When an asset experiences a violent -70%+ liquidation candle, immediate V-shaped recoveries are rare. The market typically enters a prolonged consolidation phase between $0.17 and $0.25 to rebuild order book depth and clear remaining trapped supply.
Catching falling knives during active liquidation events carries extreme risk. Wait for volume to normalize and structural base formation to confirm before assessing reversal setups.
Войдите, чтобы посмотреть больше материала