
elblind
3 Публикации

elblind
In life, you never stop learning…
Открытая сделка

Владелец BTC
Трейдер с регулярными сделками
5 г
3 подписок(и/а)
26 подписчиков(а)
434 понравилось
Посты
Портфель
### Bitcoin Price Analysis: BTC Tests $78K After Major Bullish Breakout
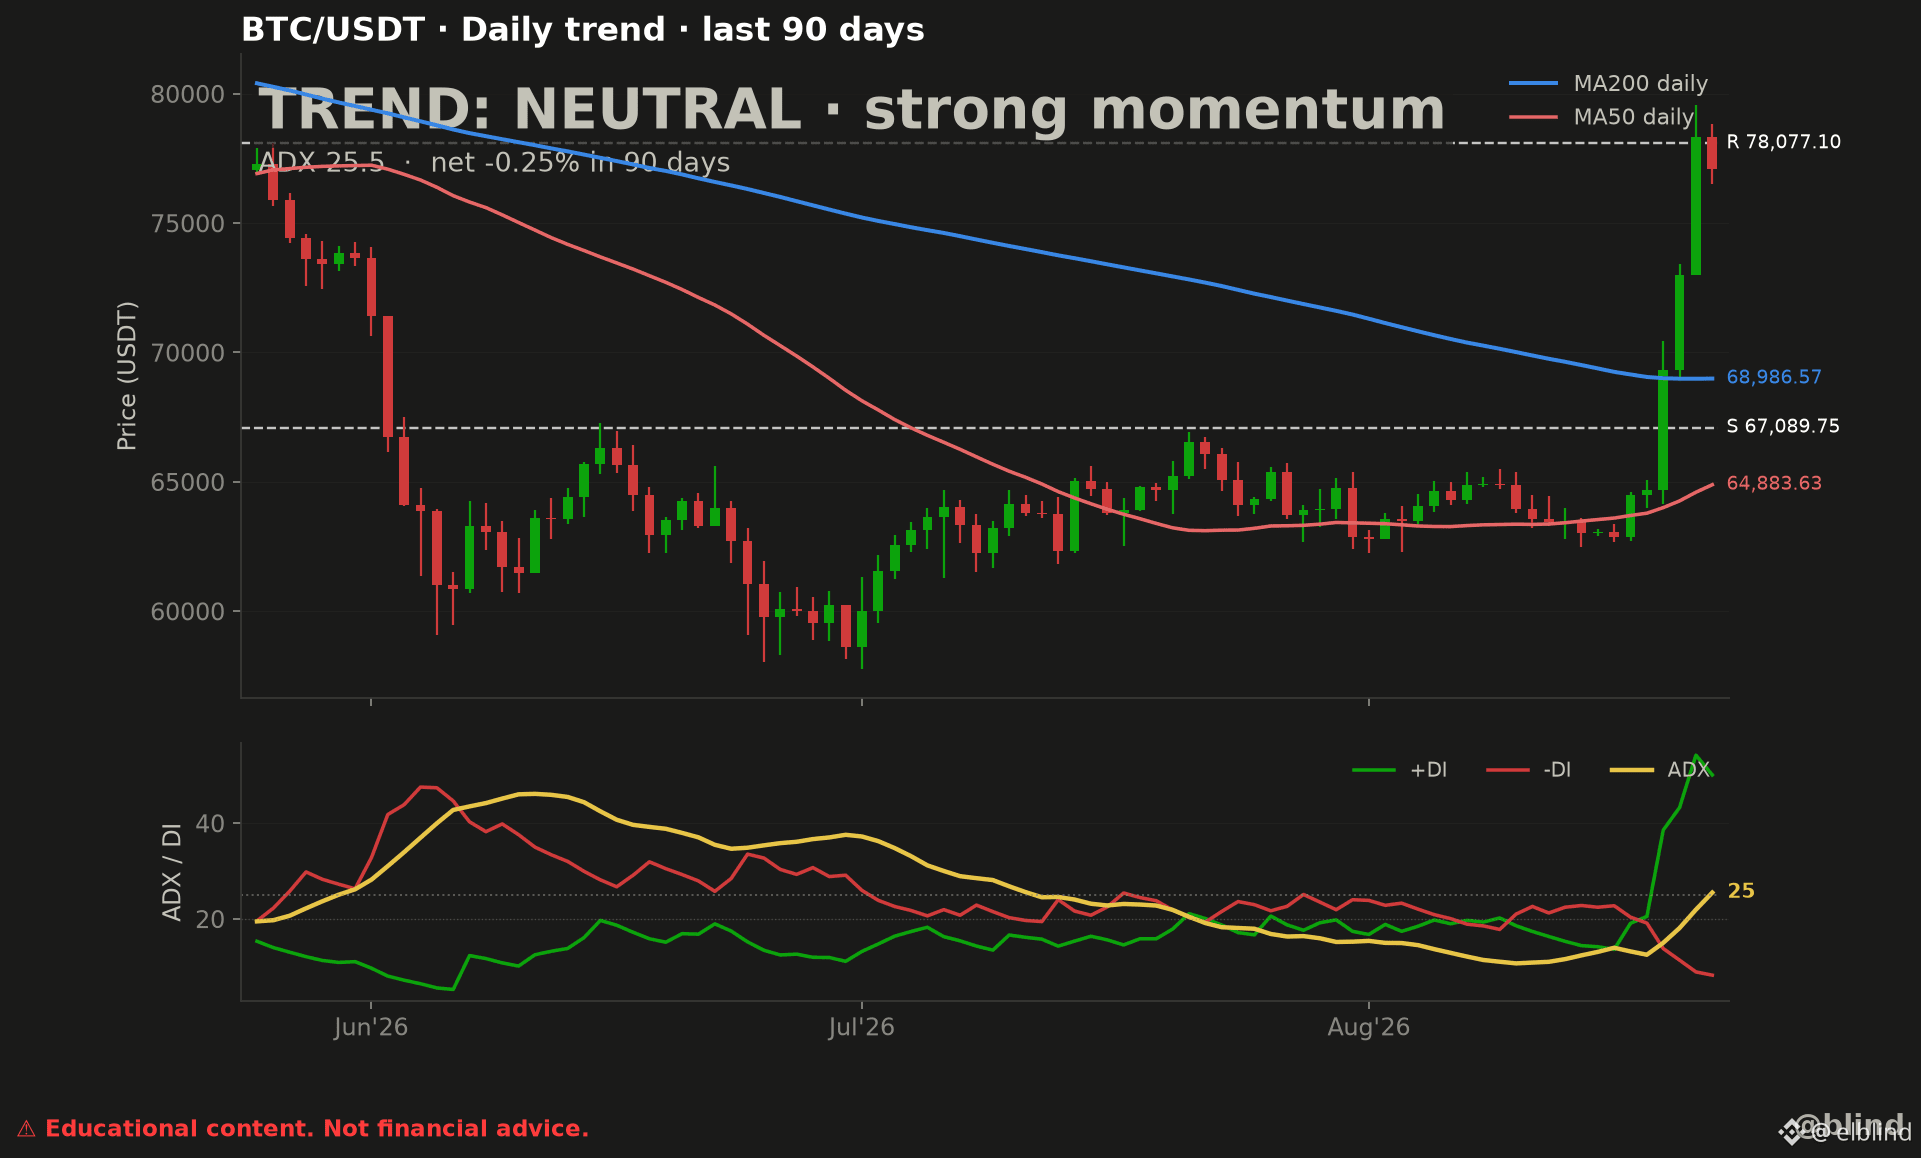
$BTC has staged an explosive recovery, breaking above its **50-day MA at $64,884** and the critical **200-day MA at $68,987**. Bitcoin is now testing major resistance near **$78,077**, while the psychological **$80,000 level** remains the next bullish objective.
The 90-day performance is still almost flat at **-0.25%**, so the broader trend remains technically neutral. However, momentum has shifted decisively in favor of buyers:
🟢 **+DI has surged above -DI**, confirming strong bullish pressure.
🟡 **ADX has risen to 25.5**, indicating that a meaningful directional trend is developing.
🔴 Price is significantly extended above both moving averages, increasing the risk of short-term consolidation or a pullback.
**Key BTC/USDT levels:**
- Immediate resistance: **$78,077**
- Breakout target: **$80,000**
- Major dynamic support: **$68,987**
- Structural support: **$67,090**
- Deeper support: **$64,884**
A confirmed daily close above **$78,077** could strengthen the bullish continuation scenario. Rejection from this zone may trigger profit-taking and a retest of $69K–$67K. Holding above the 200-day MA would keep the medium-term recovery structure intact.
**Outlook:** Bullish momentum is strong, but BTC is approaching resistance after a vertical move. Confirmation and disciplined risk management are essential.
Will Bitcoin break $80K or retest support first? Comment your prediction, like this post, and follow me for more Bitcoin technical analysis and crypto market updates.
⚠️ **Past performance does not guarantee future results. Educational content only. Not financial advice.**
#Bitcoin #BTC #BTCUSDT #BitcoinPrice #BitcoinAnalysis #Crypto #CryptoMarket #CryptoTrading #TechnicalAnalysis #ADX #MovingAverages #BinanceSquare
$BTC has staged an explosive recovery, breaking above its **50-day MA at $64,884** and the critical **200-day MA at $68,987**. Bitcoin is now testing major resistance near **$78,077**, while the psychological **$80,000 level** remains the next bullish objective.
The 90-day performance is still almost flat at **-0.25%**, so the broader trend remains technically neutral. However, momentum has shifted decisively in favor of buyers:
🟢 **+DI has surged above -DI**, confirming strong bullish pressure.
🟡 **ADX has risen to 25.5**, indicating that a meaningful directional trend is developing.
🔴 Price is significantly extended above both moving averages, increasing the risk of short-term consolidation or a pullback.
**Key BTC/USDT levels:**
- Immediate resistance: **$78,077**
- Breakout target: **$80,000**
- Major dynamic support: **$68,987**
- Structural support: **$67,090**
- Deeper support: **$64,884**
A confirmed daily close above **$78,077** could strengthen the bullish continuation scenario. Rejection from this zone may trigger profit-taking and a retest of $69K–$67K. Holding above the 200-day MA would keep the medium-term recovery structure intact.
**Outlook:** Bullish momentum is strong, but BTC is approaching resistance after a vertical move. Confirmation and disciplined risk management are essential.
Will Bitcoin break $80K or retest support first? Comment your prediction, like this post, and follow me for more Bitcoin technical analysis and crypto market updates.
⚠️ **Past performance does not guarantee future results. Educational content only. Not financial advice.**
#Bitcoin #BTC #BTCUSDT #BitcoinPrice #BitcoinAnalysis #Crypto #CryptoMarket #CryptoTrading #TechnicalAnalysis #ADX #MovingAverages #BinanceSquare
### Bitcoin Breakout: Can BTC Hold Above the 200-Day Moving Average?
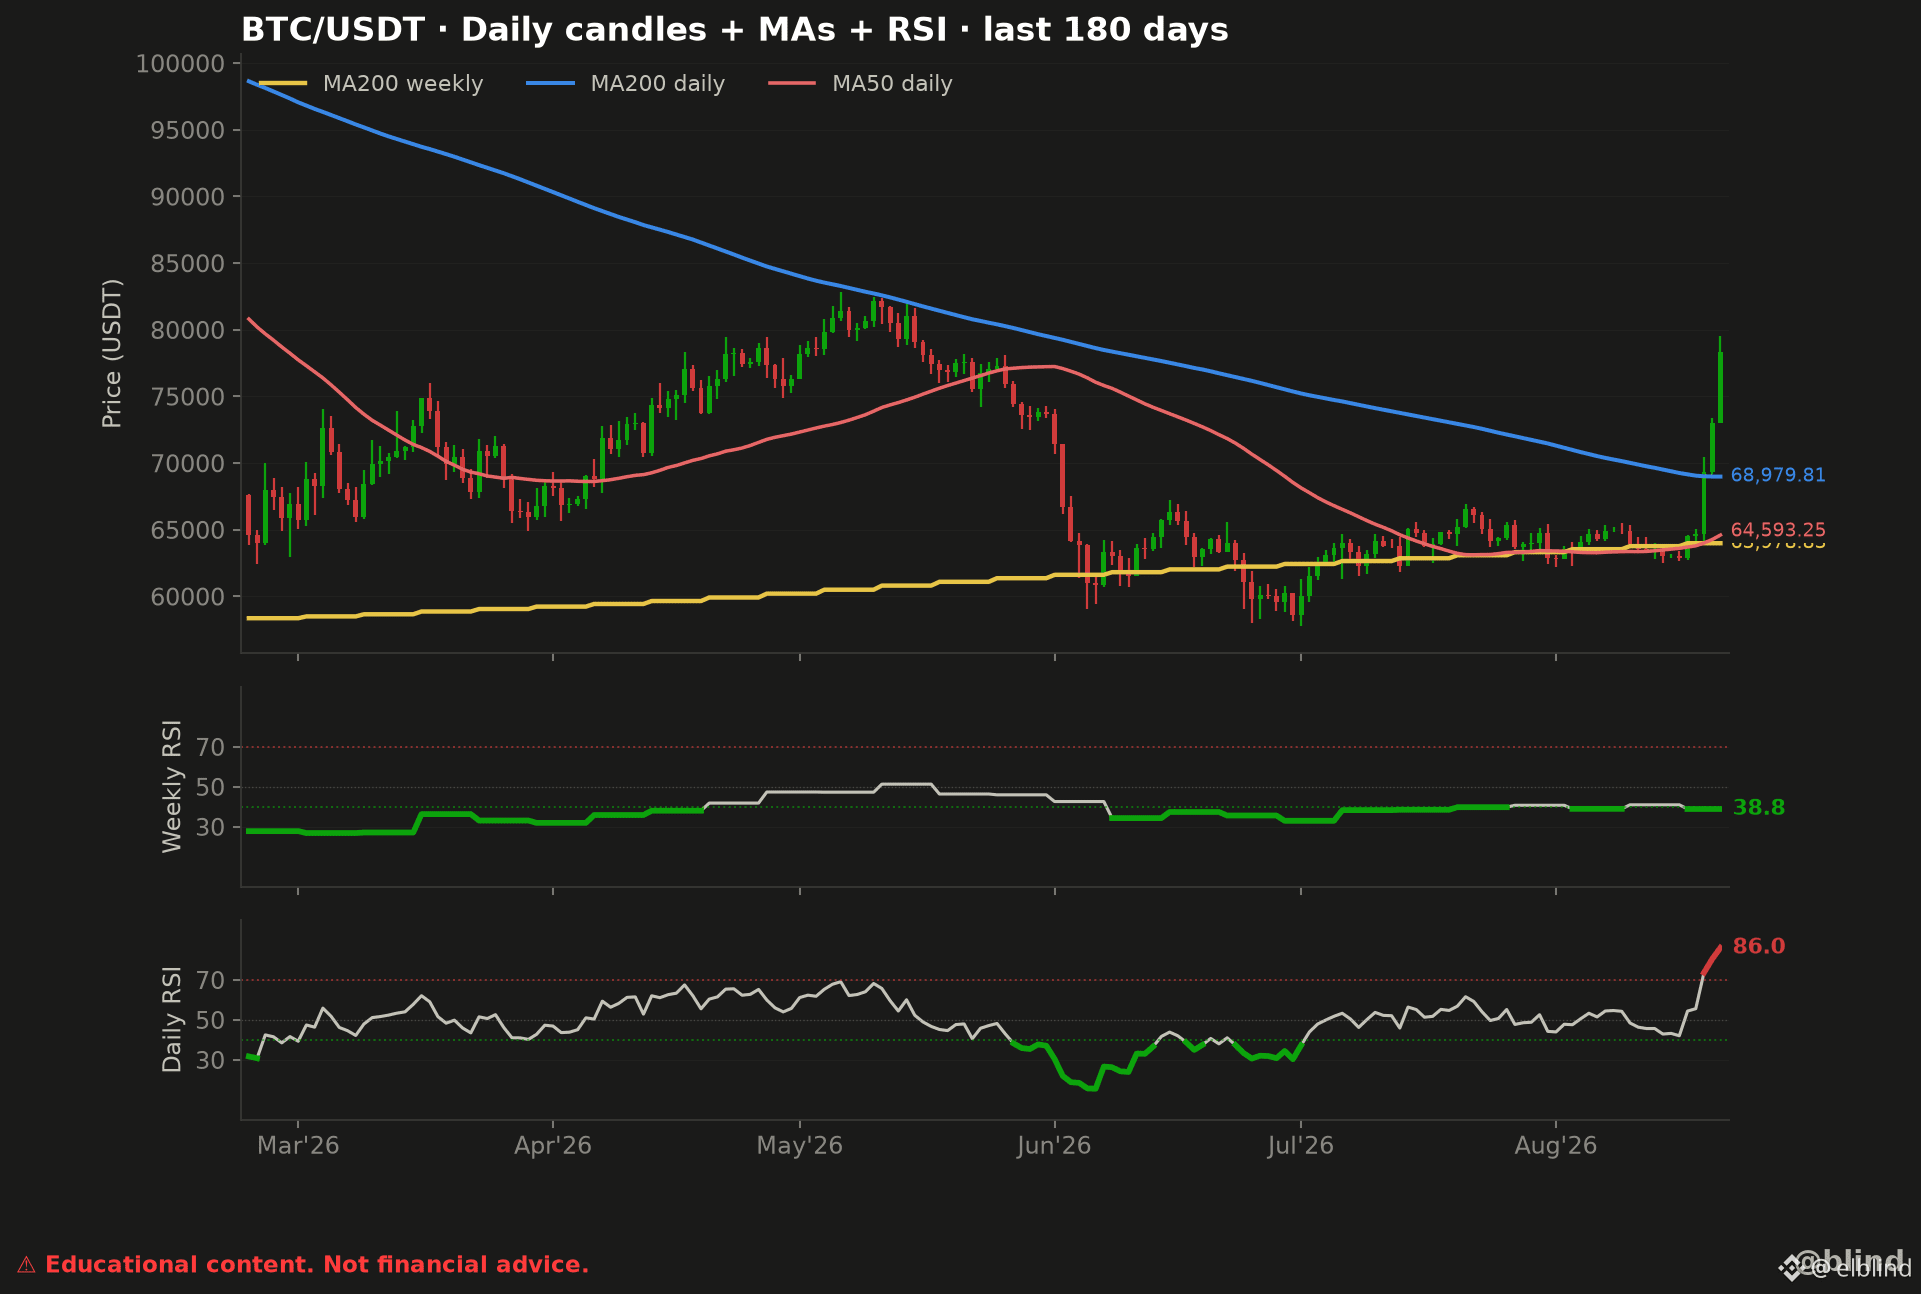
$BTC has delivered a powerful bullish breakout, surging toward the psychological **$80,000 resistance** and reclaiming its **200-day moving average at $68,980**. This is a major improvement in Bitcoin’s daily market structure.
The moving-average setup now defines three important support zones:
🟢 **Immediate support:** $73,000–$74,000
🔵 **Major support / 200-day MA:** $68,980
🟡 **Long-term confluence:** $63,970–$64,593, where the weekly 200-MA and daily 50-MA converge
Momentum is strong, but caution is warranted. The **daily RSI has reached 86**, signaling extremely overbought conditions. This does not automatically predict a reversal, but it increases the probability of short-term consolidation, heightened volatility, or a pullback before the next sustainable move.
Meanwhile, the **weekly RSI remains at 38.8**, suggesting that the broader recovery still needs confirmation. A daily close above **$80,000**, followed by a successful retest, could open the path toward the previous **$82,000–$83,000 resistance zone**. Failure to hold the breakout may send BTC back toward $74,000 or the 200-day MA.
**Key takeaway:** Bitcoin’s trend has turned decisively bullish in the short term, but chasing an overextended candle carries significant risk. Confirmation and risk management remain essential.
Will BTC consolidate above $80K or retest support first? Comment your outlook, like this analysis, and follow me for more Bitcoin technical analysis and crypto market updates.
⚠️ **Past performance does not guarantee future results. Educational content only. Not financial advice.**
#Bitcoin #BTC #BTCUSDT #BitcoinAnalysis #BitcoinPrice #Crypto #CryptoMarket #CryptoTrading #TechnicalAnalysis #RSI #MovingAverage #BinanceSquare
$BTC has delivered a powerful bullish breakout, surging toward the psychological **$80,000 resistance** and reclaiming its **200-day moving average at $68,980**. This is a major improvement in Bitcoin’s daily market structure.
The moving-average setup now defines three important support zones:
🟢 **Immediate support:** $73,000–$74,000
🔵 **Major support / 200-day MA:** $68,980
🟡 **Long-term confluence:** $63,970–$64,593, where the weekly 200-MA and daily 50-MA converge
Momentum is strong, but caution is warranted. The **daily RSI has reached 86**, signaling extremely overbought conditions. This does not automatically predict a reversal, but it increases the probability of short-term consolidation, heightened volatility, or a pullback before the next sustainable move.
Meanwhile, the **weekly RSI remains at 38.8**, suggesting that the broader recovery still needs confirmation. A daily close above **$80,000**, followed by a successful retest, could open the path toward the previous **$82,000–$83,000 resistance zone**. Failure to hold the breakout may send BTC back toward $74,000 or the 200-day MA.
**Key takeaway:** Bitcoin’s trend has turned decisively bullish in the short term, but chasing an overextended candle carries significant risk. Confirmation and risk management remain essential.
Will BTC consolidate above $80K or retest support first? Comment your outlook, like this analysis, and follow me for more Bitcoin technical analysis and crypto market updates.
⚠️ **Past performance does not guarantee future results. Educational content only. Not financial advice.**
#Bitcoin #BTC #BTCUSDT #BitcoinAnalysis #BitcoinPrice #Crypto #CryptoMarket #CryptoTrading #TechnicalAnalysis #RSI #MovingAverage #BinanceSquare
### BTC/USDT Liquidation Heatmap: Is Bitcoin Targeting $78,400 Next?
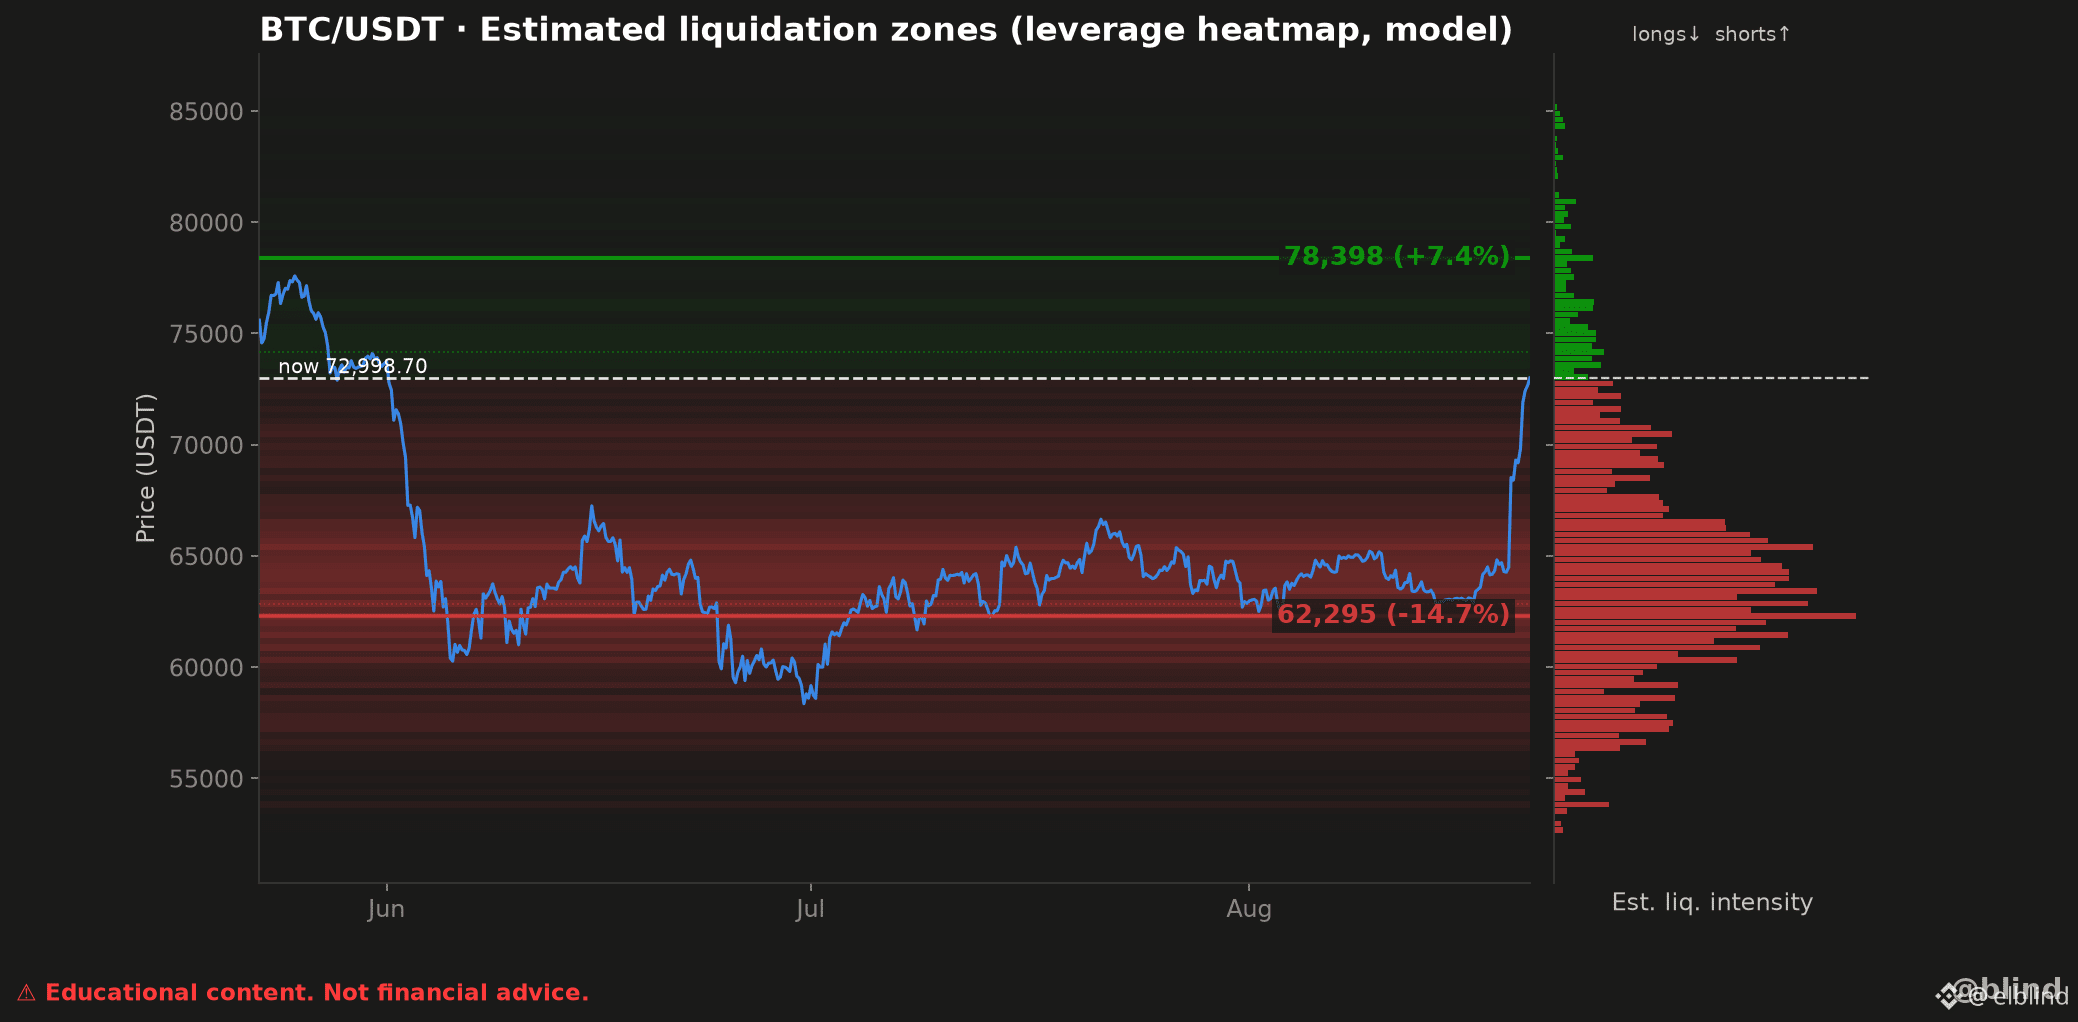
$BTC is trading near **$72,999** after a sharp recovery, placing Bitcoin between two significant estimated liquidation zones.
🟢 **Upside liquidity: $78,398 (+7.4%)**
The main short-liquidation cluster sits around **$78.4K**. A sustained breakout above the **$74K–$75K resistance area** could increase the probability of a short squeeze toward this level.
🔴 **Downside liquidity: $62,295 (-14.7%)**
The heatmap shows a much larger concentration of long-liquidation exposure below the current price, especially around **$62K–$66K**. If Bitcoin loses momentum and breaks key support, this liquidity pool could become a downside magnet.
**Key BTC levels to watch:**
- Resistance: **$74,000–$75,000**
- Bullish liquidity target: **$78,398**
- Near-term support: **$69,000–$70,000**
- Major downside liquidity zone: **$62,295–$66,000**
**Market outlook:**
Short-term momentum has improved, but the liquidation structure remains asymmetric: the downside liquidity pool is broader and more concentrated than the upside cluster. Confirmation matters—liquidity zones represent areas of potential volatility, not guaranteed price targets.
Do you think Bitcoin will trigger the **$78.4K short squeeze**, or revisit the **$62K liquidity zone** first? Share your view in the comments.
👍 Like this post if you find these BTC market insights useful, and follow me for more Bitcoin technical analysis, liquidation heatmaps, and crypto trading updates.
⚠️ **Past performance does not guarantee future results. Educational content only. Not financial advice.**
#Bitcoin #BTC #BTCUSDT #BitcoinAnalysis #CryptoAnalysis #TechnicalAnalysis #LiquidationHeatmap #BitcoinPrice #CryptoTrading #BTCTrading #BinanceSquare
$BTC is trading near **$72,999** after a sharp recovery, placing Bitcoin between two significant estimated liquidation zones.
🟢 **Upside liquidity: $78,398 (+7.4%)**
The main short-liquidation cluster sits around **$78.4K**. A sustained breakout above the **$74K–$75K resistance area** could increase the probability of a short squeeze toward this level.
🔴 **Downside liquidity: $62,295 (-14.7%)**
The heatmap shows a much larger concentration of long-liquidation exposure below the current price, especially around **$62K–$66K**. If Bitcoin loses momentum and breaks key support, this liquidity pool could become a downside magnet.
**Key BTC levels to watch:**
- Resistance: **$74,000–$75,000**
- Bullish liquidity target: **$78,398**
- Near-term support: **$69,000–$70,000**
- Major downside liquidity zone: **$62,295–$66,000**
**Market outlook:**
Short-term momentum has improved, but the liquidation structure remains asymmetric: the downside liquidity pool is broader and more concentrated than the upside cluster. Confirmation matters—liquidity zones represent areas of potential volatility, not guaranteed price targets.
Do you think Bitcoin will trigger the **$78.4K short squeeze**, or revisit the **$62K liquidity zone** first? Share your view in the comments.
👍 Like this post if you find these BTC market insights useful, and follow me for more Bitcoin technical analysis, liquidation heatmaps, and crypto trading updates.
⚠️ **Past performance does not guarantee future results. Educational content only. Not financial advice.**
#Bitcoin #BTC #BTCUSDT #BitcoinAnalysis #CryptoAnalysis #TechnicalAnalysis #LiquidationHeatmap #BitcoinPrice #CryptoTrading #BTCTrading #BinanceSquare
Войдите, чтобы посмотреть больше материала