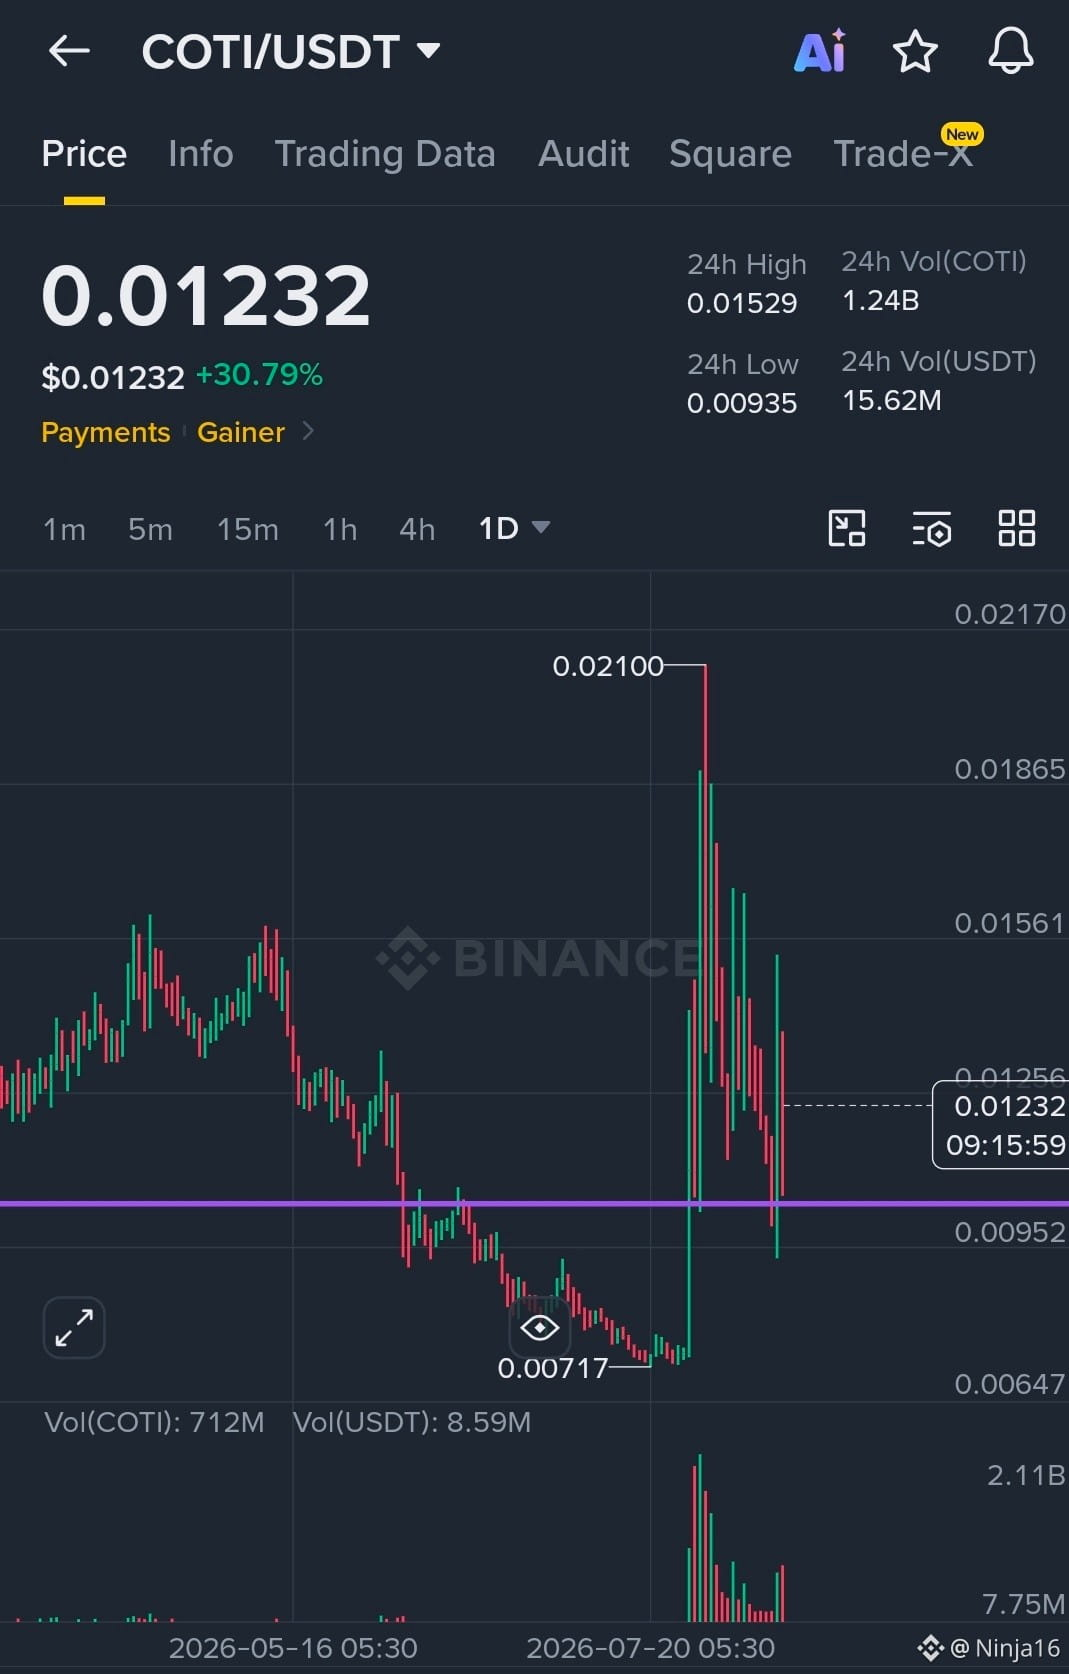
$COTI Spikes +27%! Rebounding Off $0.0071 Bottom — Reversal or Rejection? 📉
COTI ($COTI) has printed a major green candle on the Daily (1D) chart, surging +27.50% to trade at $0.01210!
After bouncing off its macro bottom at $0.00717, heavy buying volume (1.24B COTI / $15.60M USDT) has entered the market. Is this the start of a broader recovery?
📊 Key Technical Levels from the Chart:
🛡️ Major Support Floor: $0.00717 (Local bottom & demand zone)
🟣 Key Reclaim Zone: $0.01050 – $0.01100 (Purple line / Previous breakdown level now acting as immediate support)
🛑 24h High Resistance: $0.01529 (Immediate target for bulls)
🚀 Macro Resistance Level: $0.02543 (The high-water mark from the top of the range)
Bullish Setup: A daily candle close above $0.01250 confirms buyers are holding control. Look for momentum to retest the 24h high at $0.01529.
Bearish/Pullback Setup: If the price gets rejected, a healthy retest back down to the $0.01050 support zone could provide a lower-risk entry point.
#COTI/USDT #Coti
⚠️ DISCLAIMER:
This post is for informational and educational purposes only and does not constitute financial, investment, or trading advice. Digital assets and cryptocurrencies are subject to high market risk and price volatility. Always conduct your own research (DYOR) and implement strict risk management strategies before entering any trades.
COTI ($COTI) has printed a major green candle on the Daily (1D) chart, surging +27.50% to trade at $0.01210!
After bouncing off its macro bottom at $0.00717, heavy buying volume (1.24B COTI / $15.60M USDT) has entered the market. Is this the start of a broader recovery?
📊 Key Technical Levels from the Chart:
🛡️ Major Support Floor: $0.00717 (Local bottom & demand zone)
🟣 Key Reclaim Zone: $0.01050 – $0.01100 (Purple line / Previous breakdown level now acting as immediate support)
🛑 24h High Resistance: $0.01529 (Immediate target for bulls)
🚀 Macro Resistance Level: $0.02543 (The high-water mark from the top of the range)
Bullish Setup: A daily candle close above $0.01250 confirms buyers are holding control. Look for momentum to retest the 24h high at $0.01529.
Bearish/Pullback Setup: If the price gets rejected, a healthy retest back down to the $0.01050 support zone could provide a lower-risk entry point.
#COTI/USDT #Coti
⚠️ DISCLAIMER:
This post is for informational and educational purposes only and does not constitute financial, investment, or trading advice. Digital assets and cryptocurrencies are subject to high market risk and price volatility. Always conduct your own research (DYOR) and implement strict risk management strategies before entering any trades.