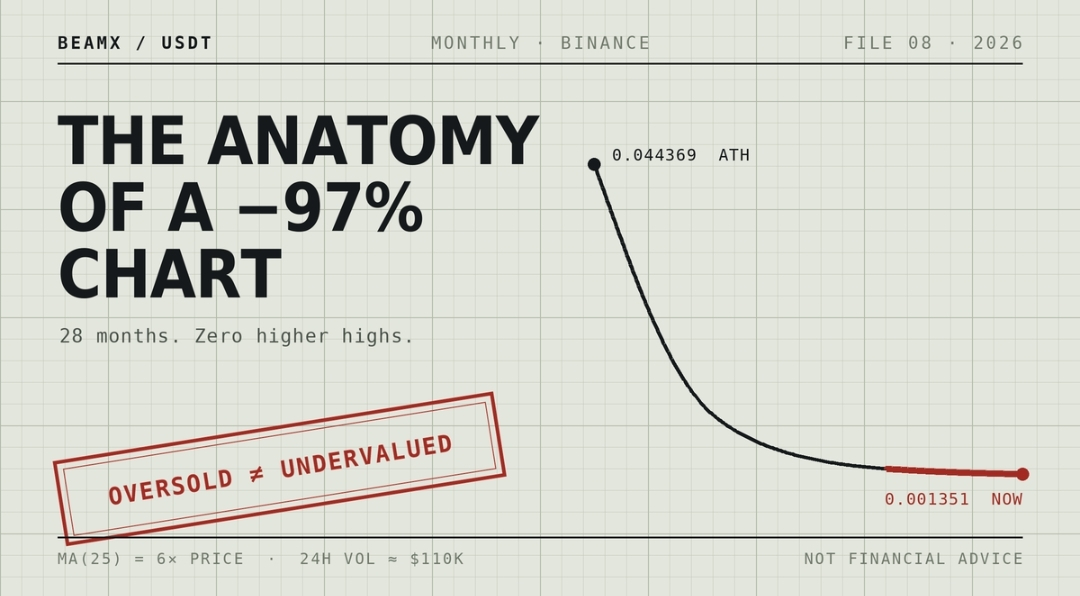
$BEAMX Open the BEAMX/USDT monthly chart on Binance and you are looking at one of the cleanest teaching diagrams in this market. Not because the coin is special — because the failure is textbook. Every trap that empties retail wallets in a bear structure is visible on a single screen.
Here are the numbers, unspun:
Metric
Value
Price
0.001351
All-time high (Mar 2024)
0.044369
Drawdown from ATH
−96.9%
Monthly MA(7)
0.001633
Monthly MA(25)
0.008007
All-time low
0.001211
Monthly RSI(6)
25.08
24h volume (USDT)
~110,000
Price sits 11% above the all-time low after 28 consecutive months of lower highs. Not one exception. That is not a correction. That is a decay curve.
1. The moving averages are not lagging. They are a verdict.
The standard defence of a broken chart is "moving averages lag, they always look bad at the bottom." Look at the actual spread here.
Price is below MA(7). Fine, that happens constantly. But price is also below MA(25) — and MA(25) sits at 0.008007, roughly six times current price. On a monthly timeframe, that spread is not lag. It is the market recording that the average holder of the last two years is catastrophically underwater.
Every rally into that zone meets two years of stacked exit liquidity. There is no path back to the mean that doesn't first climb through a wall of people who just want their money back.
2. The RSI trap
Monthly RSI(6) reads 25. Oversold. This is where most retail analysis stops and the word "bounce" appears.
Run the tape forward instead. That RSI has been pinned near the floor for over a year, flat, while price kept grinding lower. In a downtrend, oversold is not a reversal signal — it is a momentum death certificate. Assets going to zero look oversold for the entire journey. That's what going to zero means.
RSI tells you speed, not direction. A flatlined oscillator at the bottom of a range means the selling exhausted itself and nothing replaced it. No buyer arrived. That is worse than active selling, not better.
3. Liquidity is the risk nobody prices
24-hour USDT volume of roughly $110,000 on the largest exchange in the world.
Sit with that number. That is not a market, it is a queue. It means:
Any meaningful position takes real slippage to build and worse slippage to exit.
A single seller can set the price for the day.
Thin books cut both ways — the same 5% of daily volume that spikes it 40% can dump it 40%.
Sustained volume decay on a major venue eventually attracts monitoring tags and delisting reviews. That is not a prediction, it is a mechanical process every exchange runs.
Notice the volume moving averages too: MA(5) at 6.69B units against MA(10) at 9.7B. Falling volume into falling price. The distribution already happened. What's left is drift.
4. The denominator illusion
BEAMX came from a 1 MC → 100 BEAMX redenomination. The quoted price became a small number with a lot of leading zeros.
This is the single most reliable psychological trap in low-cap crypto. "0.001351" reads as cheap. It isn't a price, it's a fraction of a supply. With roughly 51 billion tokens circulating, the market is still valuing this thing in the tens of millions of dollars. Nothing about a decimal point tells you whether that valuation is justified.
If you catch yourself thinking "it only has to get back to a cent," you have been captured by the denominator, not by an analysis.
5. The supply excuse has already expired
Around 88% of max supply is already circulating (~51.3B of 58.5B).
For two years, the standard bull case on tokens like this was "wait for unlocks to clear, then it runs." The unlocks largely cleared. The overhang is mostly gone. And price went to the all-time low anyway.
That is the most damning data point on this chart. When you remove the excuse and the outcome doesn't change, the excuse was never the cause. Weak demand was.
6. The builders already rotated
This matters more than any indicator on the screen.
The token's origin story is play-to-earn gaming under Merit Circle DAO. As of 2026, the Beam Foundation's showcased work includes incubating Dreamcash — a consumer perpetuals and equities trading app built on Hyperliquid — from concept through launch.
Read that plainly. The ecosystem rotated toward where attention and revenue actually are. That may well be rational for the foundation. But if you are holding this token, you are holding the ticker of a 2023 narrative while the people building have moved to a 2026 one. Token and thesis have separated.
What would actually invalidate this
I am not interested in a bearish view that can't be wrong. Here is the specific level.
A monthly close above 0.0022 — reclaiming MA(7) — accompanied by a genuine expansion in volume, not a single-wick spike.
Until both conditions print together, every entry is the same trade: a falling knife in a market with no liquidity to catch it in.
The only honest bull case
Market-wide risk appetite returns, and dead low-cap tokens with thin books rip 50–100% because thin books rip. That is real. It happens every cycle.
But name it correctly. That is a liquidity trade with a beta bet attached, not an investment thesis. It has no relationship to the project, the technology, or the valuation. If that's the trade you want, size it as what it is: capital you can watch go to zero without it changing anything about your life.
The chart is not telling you a story about a comeback. It's telling you what happens when a narrative expires and the price spends 28 months finding out.
This is technical and structural analysis, not investment advice. I am not your financial advisor. Every number above is verifiable on the Binance chart and public supply data — check it yourself before you act on anything, including this.