🚀 Bitcoin/US Dollar Pair — Bullish Reversal in Progress
Bitcoin is showing
📊 1
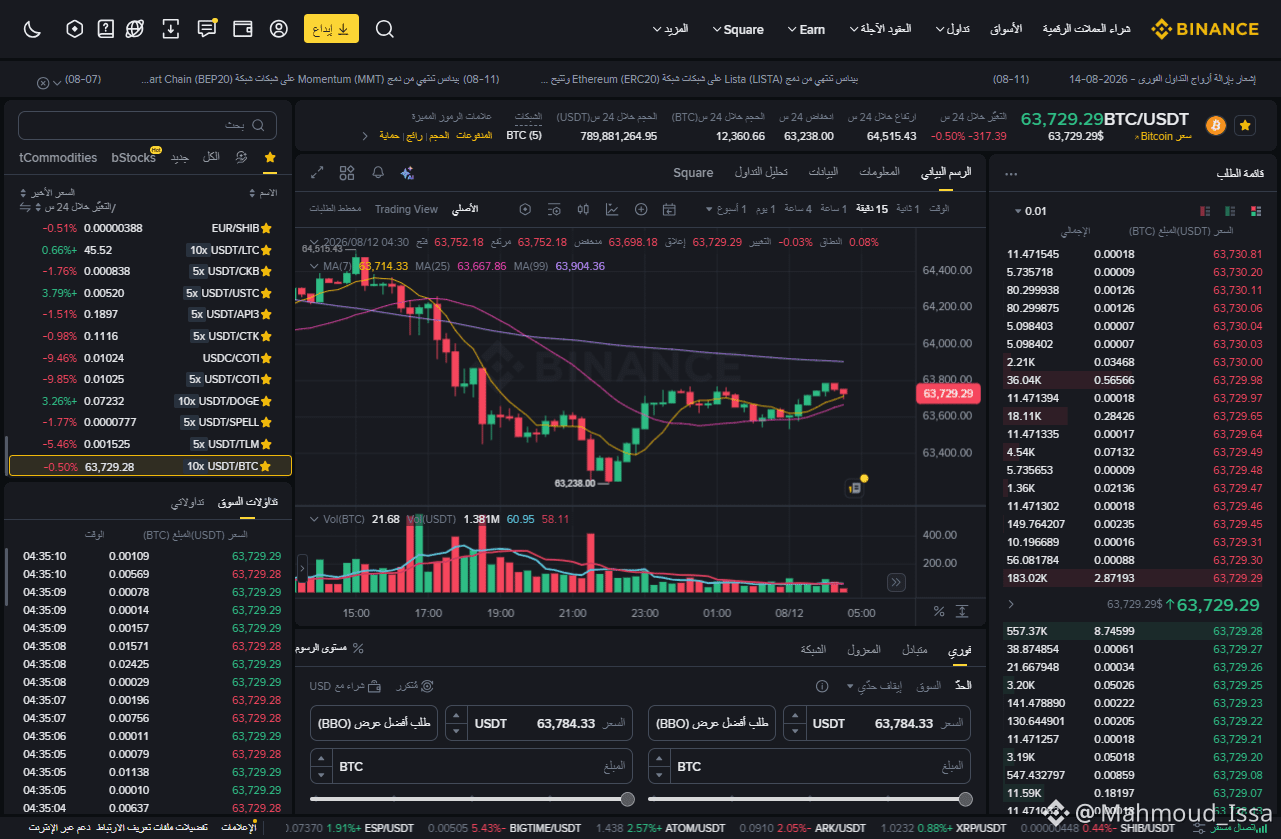
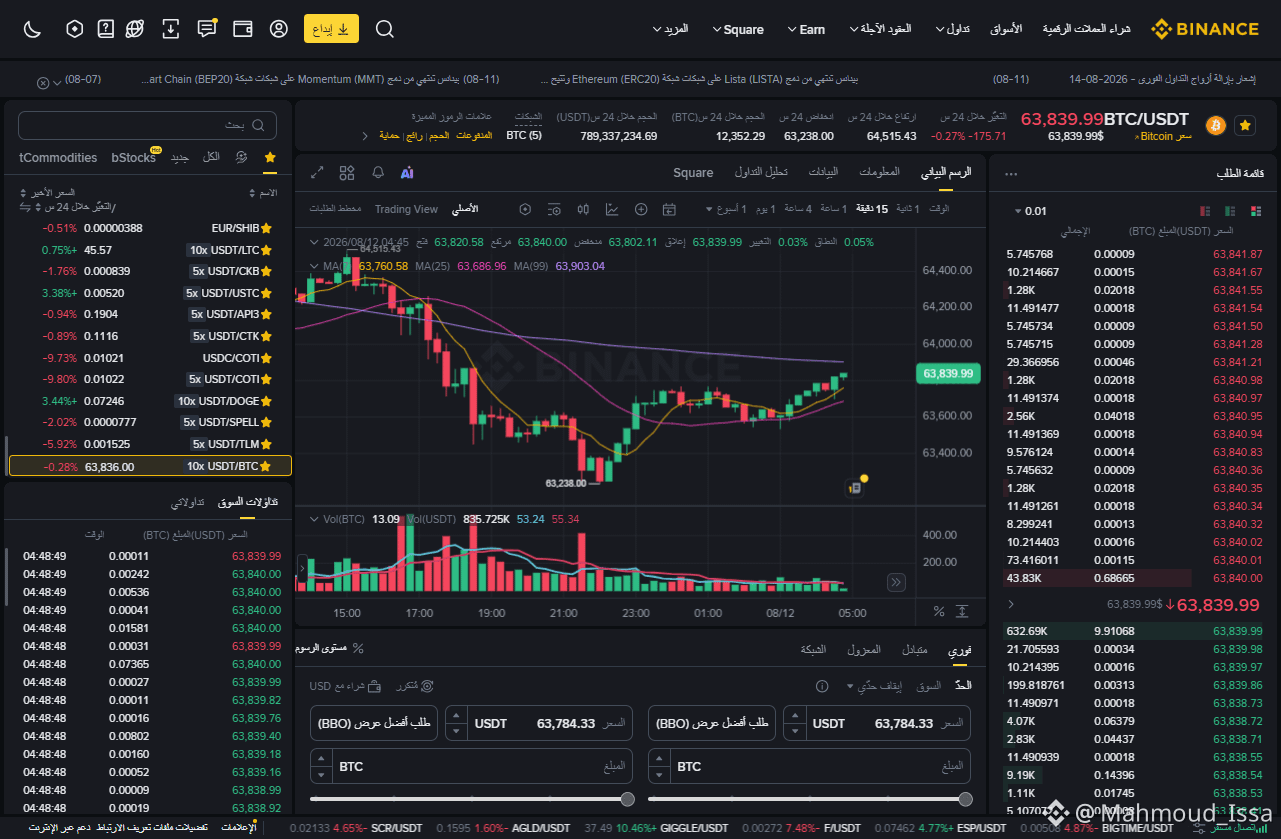
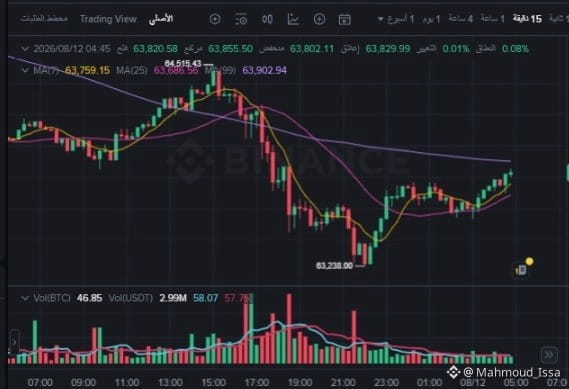
The chart shows:
🟢 Strong rejection from $63,238
🟢 A series of higher lows
🟢 Price has bounced back above the 7-period and 25-period moving averages
🟢 Short-term momentum is turning bullish
🟡 Bitcoin is now approaching the 99-period moving average around $63,900, a key resistance level to watch.
🎯 Key Levels
🟢 Support: $63,600 - $63,700
🟢 Key Support: $63,238
🔴 Resistance: $63,900
🔴 Next Resistance Level: $64,200
🔴 Highest Target: $64,400
🕯️ Japanese Candlestick Structure
The most important signal in this chart is the rejection of the low at $63,238, followed by a rebound with consecutive bullish candles.
The Bitcoin price then experienced a short consolidation period around the $63,600 level.
🔥 If Bitcoin
Potential to Continue:
$63,900 ← $64,000 ← $64,200 ← $64,400
📈 Derivatives Watch
Watch:
Open Interest + Funding Rate + Liquidations
If the price breaks through the resistance level while short positions are heavy, short selling pressure could intensify.
However, if Bitcoin is rejected around $63,900-$64,000 and loses $63,600, the bullish momentum could weaken.
🧠 My Short-Term Bias
🟢 Positive — but confirmation is needed.
The market has recovered strongly from the $63,238 level, but the $63,900-$64,000 area is the real test.
Breakthrough + Volume = 🚀
Rejection = Potential Drawdown
What to expect next?
Will Bitcoin reach $64,000 or retest its price?
⚠️ Not financial advice. Always
#Bitcoin #BTC #BTCUSDT #Binance #Cryptocurrencies #BitcoinAnalysis #BTCAAnalysis #CryptocurrencyTrading #TechnicalAnalysis #PriceMovement #JapaneseCandles #BTCUSD #Rising
👍
Bitcoin is showing
📊 1
The chart shows:
🟢 Strong rejection from $63,238
🟢 A series of higher lows
🟢 Price has bounced back above the 7-period and 25-period moving averages
🟢 Short-term momentum is turning bullish
🟡 Bitcoin is now approaching the 99-period moving average around $63,900, a key resistance level to watch.
🎯 Key Levels
🟢 Support: $63,600 - $63,700
🟢 Key Support: $63,238
🔴 Resistance: $63,900
🔴 Next Resistance Level: $64,200
🔴 Highest Target: $64,400
🕯️ Japanese Candlestick Structure
The most important signal in this chart is the rejection of the low at $63,238, followed by a rebound with consecutive bullish candles.
The Bitcoin price then experienced a short consolidation period around the $63,600 level.
🔥 If Bitcoin
Potential to Continue:
$63,900 ← $64,000 ← $64,200 ← $64,400
📈 Derivatives Watch
Watch:
Open Interest + Funding Rate + Liquidations
If the price breaks through the resistance level while short positions are heavy, short selling pressure could intensify.
However, if Bitcoin is rejected around $63,900-$64,000 and loses $63,600, the bullish momentum could weaken.
🧠 My Short-Term Bias
🟢 Positive — but confirmation is needed.
The market has recovered strongly from the $63,238 level, but the $63,900-$64,000 area is the real test.
Breakthrough + Volume = 🚀
Rejection = Potential Drawdown
What to expect next?
Will Bitcoin reach $64,000 or retest its price?
⚠️ Not financial advice. Always
#Bitcoin #BTC #BTCUSDT #Binance #Cryptocurrencies #BitcoinAnalysis #BTCAAnalysis #CryptocurrencyTrading #TechnicalAnalysis #PriceMovement #JapaneseCandles #BTCUSD #Rising
👍