A 15% surge in 24 hours, yet the 4H chart just left a gap most traders will chase too late.
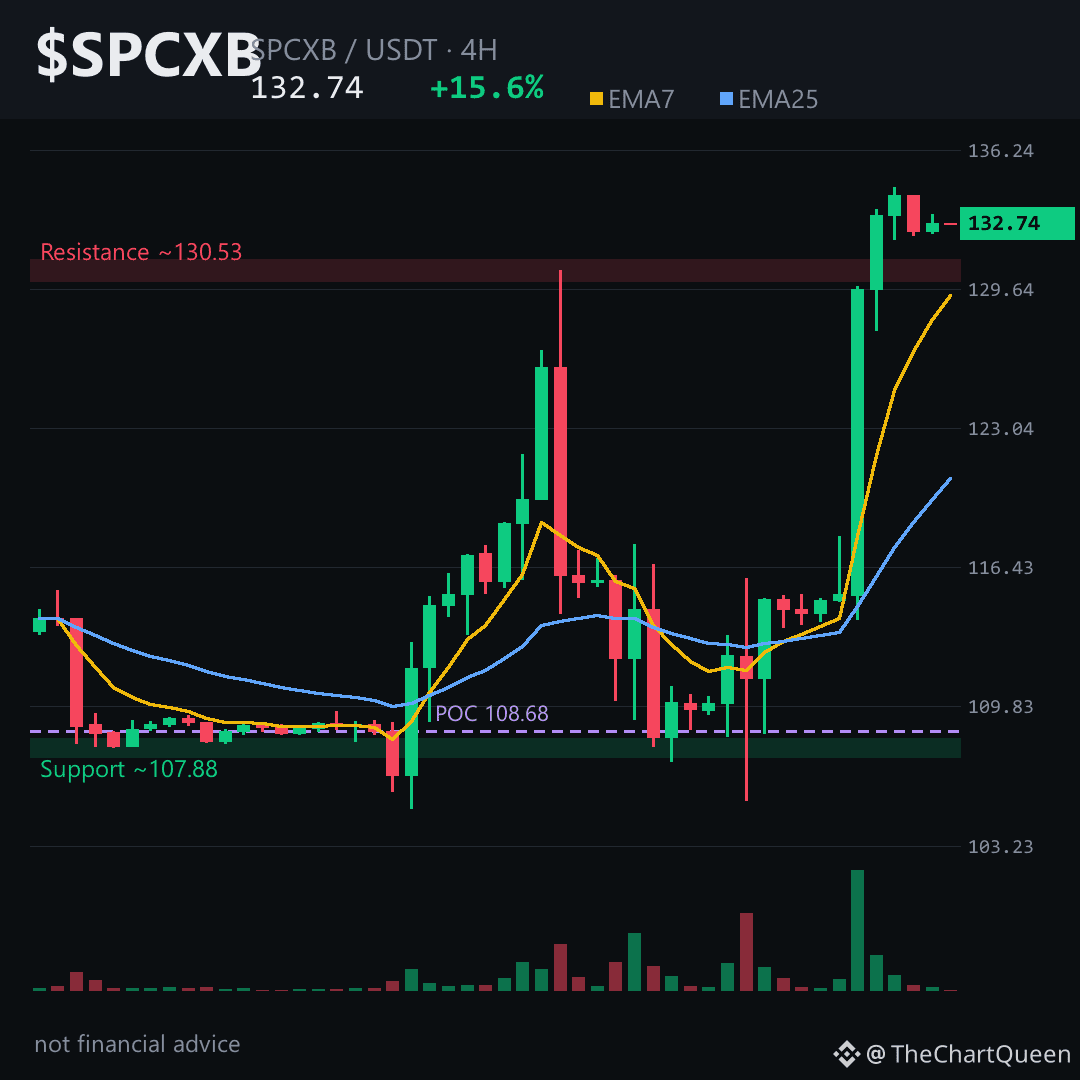
$SPCXB ripped from 114 to 132, leaving a clean bullish FVG between ~129.75 and ~132.01. Price now sits at the top of that gap, consolidating after a textbook impulse. RSI is hot at 72, but momentum can stay overbought. EMAs: 7-period at ~129.34, 25-period at ~120.49 — short-term trend firmly bullish.
The levels don't lie 👇
4H support sits at ~129.50 — bottom of the gap and near the short-term EMA. Lose that on a 4H close and the thesis cracks (invalidation ~125.40). Defend it, and the path points toward 143–144, the next structural resistance. Tap $SPCXB to pull up the chart.
My read: the gap fill near 129.50 is the logical reload zone. If price lingers without reclaiming 134, exhaustion becomes the bigger risk.
I'll post a follow-up once that gap gets tested or rejected — follow so it hits your feed.
How are you reading that unfilled gap on $SPCXB — support or trap? 👇
#SPCXB #Crypto #BinanceSquare #TopVolume
⚠️ Not financial advice. DYOR.
$SPCXB ripped from 114 to 132, leaving a clean bullish FVG between ~129.75 and ~132.01. Price now sits at the top of that gap, consolidating after a textbook impulse. RSI is hot at 72, but momentum can stay overbought. EMAs: 7-period at ~129.34, 25-period at ~120.49 — short-term trend firmly bullish.
The levels don't lie 👇
4H support sits at ~129.50 — bottom of the gap and near the short-term EMA. Lose that on a 4H close and the thesis cracks (invalidation ~125.40). Defend it, and the path points toward 143–144, the next structural resistance. Tap $SPCXB to pull up the chart.
My read: the gap fill near 129.50 is the logical reload zone. If price lingers without reclaiming 134, exhaustion becomes the bigger risk.
I'll post a follow-up once that gap gets tested or rejected — follow so it hits your feed.
How are you reading that unfilled gap on $SPCXB — support or trap? 👇
#SPCXB #Crypto #BinanceSquare #TopVolume
⚠️ Not financial advice. DYOR.