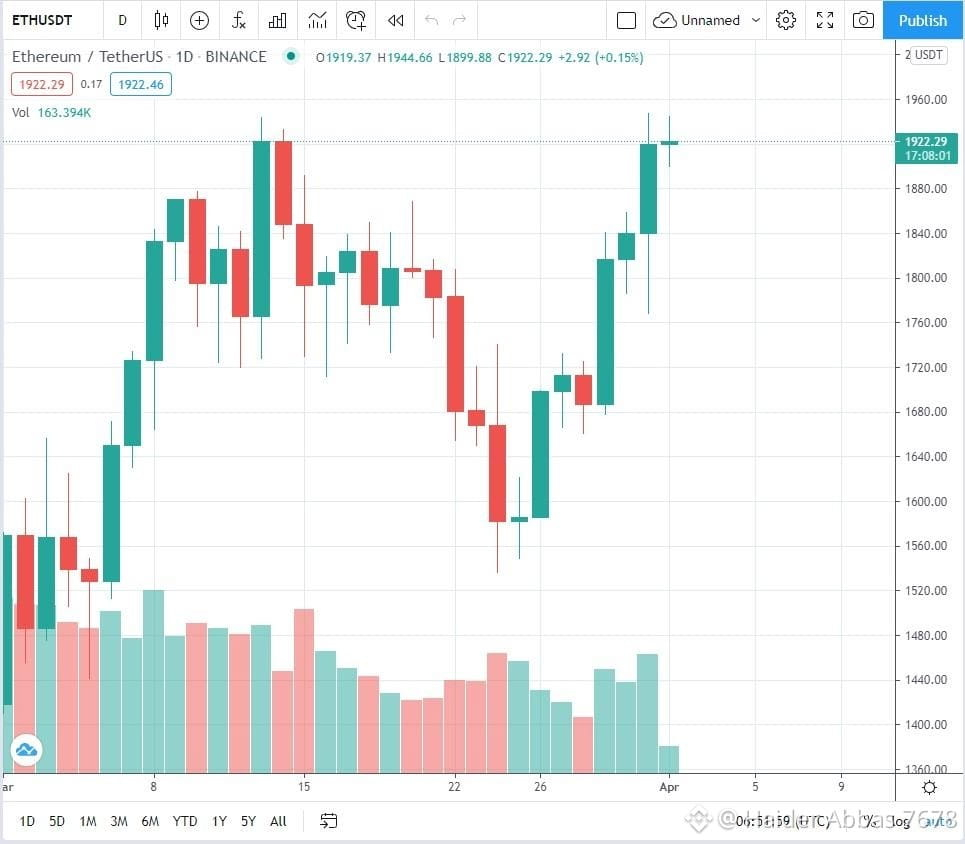
$ETH #DowFalls464Points (ETH) Complete Analysis
Overall Trend
Trend: 🟢 Bullish (Long-term)
Short-term: Neutral to Bullish
Market Sentiment: Positive, supported by increasing institutional interest, Layer-2 growth, and expanding DeFi activity.
Technical Analysis
Support Levels
Strong Support: $2,400
Major Support: $2,250
Resistance Levels
First Resistance: $2,700
Major Resistance: $2,900
A decisive breakout above $2,900 could trigger a stronger upward move, while a drop below $2,250 would weaken the current bullish structure.
Technical Indicators
RSI (Relative Strength Index): Around neutral (50–60), indicating room for further upside.
MACD: Bullish crossover, suggesting positive momentum.
Moving Averages: ETH is trading above its key moving averages, which supports the current trend.
On-Chain Analysis
Bullish Signals
Large amounts of ETH remain staked, reducing the liquid supply.
Layer-2 networks continue to increase Ethereum ecosystem activity.
Stablecoin transfers and DeFi usage remain strong.
Institutional investors continue to accumulate ETH through regulated investment products.
Bearish Signals
Higher gas fees during periods of heavy network activity.
Competition from faster smart contract platforms.
Increased selling pressure during sharp market corrections.
Fundamental Analysis
Strengths
Largest smart contract blockchain.
Leading platform for DeFi, NFTs, and tokenization.
Continuous upgrades improving scalability and efficiency.
Strong developer community.
Risks
Regulatory uncertainty in some regions.
Competition from other Layer-1 blockchains.
Dependence on overall crypto market sentiment.
Trading Plan
Strategy
Level
Entry Zone
$2,400–$2,550
Target 1
$2,700
Target 2
$2,900
Target 3
$3,100+
Stop Loss
Below $2,250
Investment Outlook
Short-Term (1–2 Weeks)
🟡 Moderately Bullish – Expect volatility with the potential for higher highs if Bitcoin remains strong.
Medium-Term (1–3 Months)
🟢 Bullish – Continued ecosystem growth and institutional demand could support higher prices.
Long-Term (6–12 Months)
Overall Trend
Trend: 🟢 Bullish (Long-term)
Short-term: Neutral to Bullish
Market Sentiment: Positive, supported by increasing institutional interest, Layer-2 growth, and expanding DeFi activity.
Technical Analysis
Support Levels
Strong Support: $2,400
Major Support: $2,250
Resistance Levels
First Resistance: $2,700
Major Resistance: $2,900
A decisive breakout above $2,900 could trigger a stronger upward move, while a drop below $2,250 would weaken the current bullish structure.
Technical Indicators
RSI (Relative Strength Index): Around neutral (50–60), indicating room for further upside.
MACD: Bullish crossover, suggesting positive momentum.
Moving Averages: ETH is trading above its key moving averages, which supports the current trend.
On-Chain Analysis
Bullish Signals
Large amounts of ETH remain staked, reducing the liquid supply.
Layer-2 networks continue to increase Ethereum ecosystem activity.
Stablecoin transfers and DeFi usage remain strong.
Institutional investors continue to accumulate ETH through regulated investment products.
Bearish Signals
Higher gas fees during periods of heavy network activity.
Competition from faster smart contract platforms.
Increased selling pressure during sharp market corrections.
Fundamental Analysis
Strengths
Largest smart contract blockchain.
Leading platform for DeFi, NFTs, and tokenization.
Continuous upgrades improving scalability and efficiency.
Strong developer community.
Risks
Regulatory uncertainty in some regions.
Competition from other Layer-1 blockchains.
Dependence on overall crypto market sentiment.
Trading Plan
Strategy
Level
Entry Zone
$2,400–$2,550
Target 1
$2,700
Target 2
$2,900
Target 3
$3,100+
Stop Loss
Below $2,250
Investment Outlook
Short-Term (1–2 Weeks)
🟡 Moderately Bullish – Expect volatility with the potential for higher highs if Bitcoin remains strong.
Medium-Term (1–3 Months)
🟢 Bullish – Continued ecosystem growth and institutional demand could support higher prices.
Long-Term (6–12 Months)