$DIA
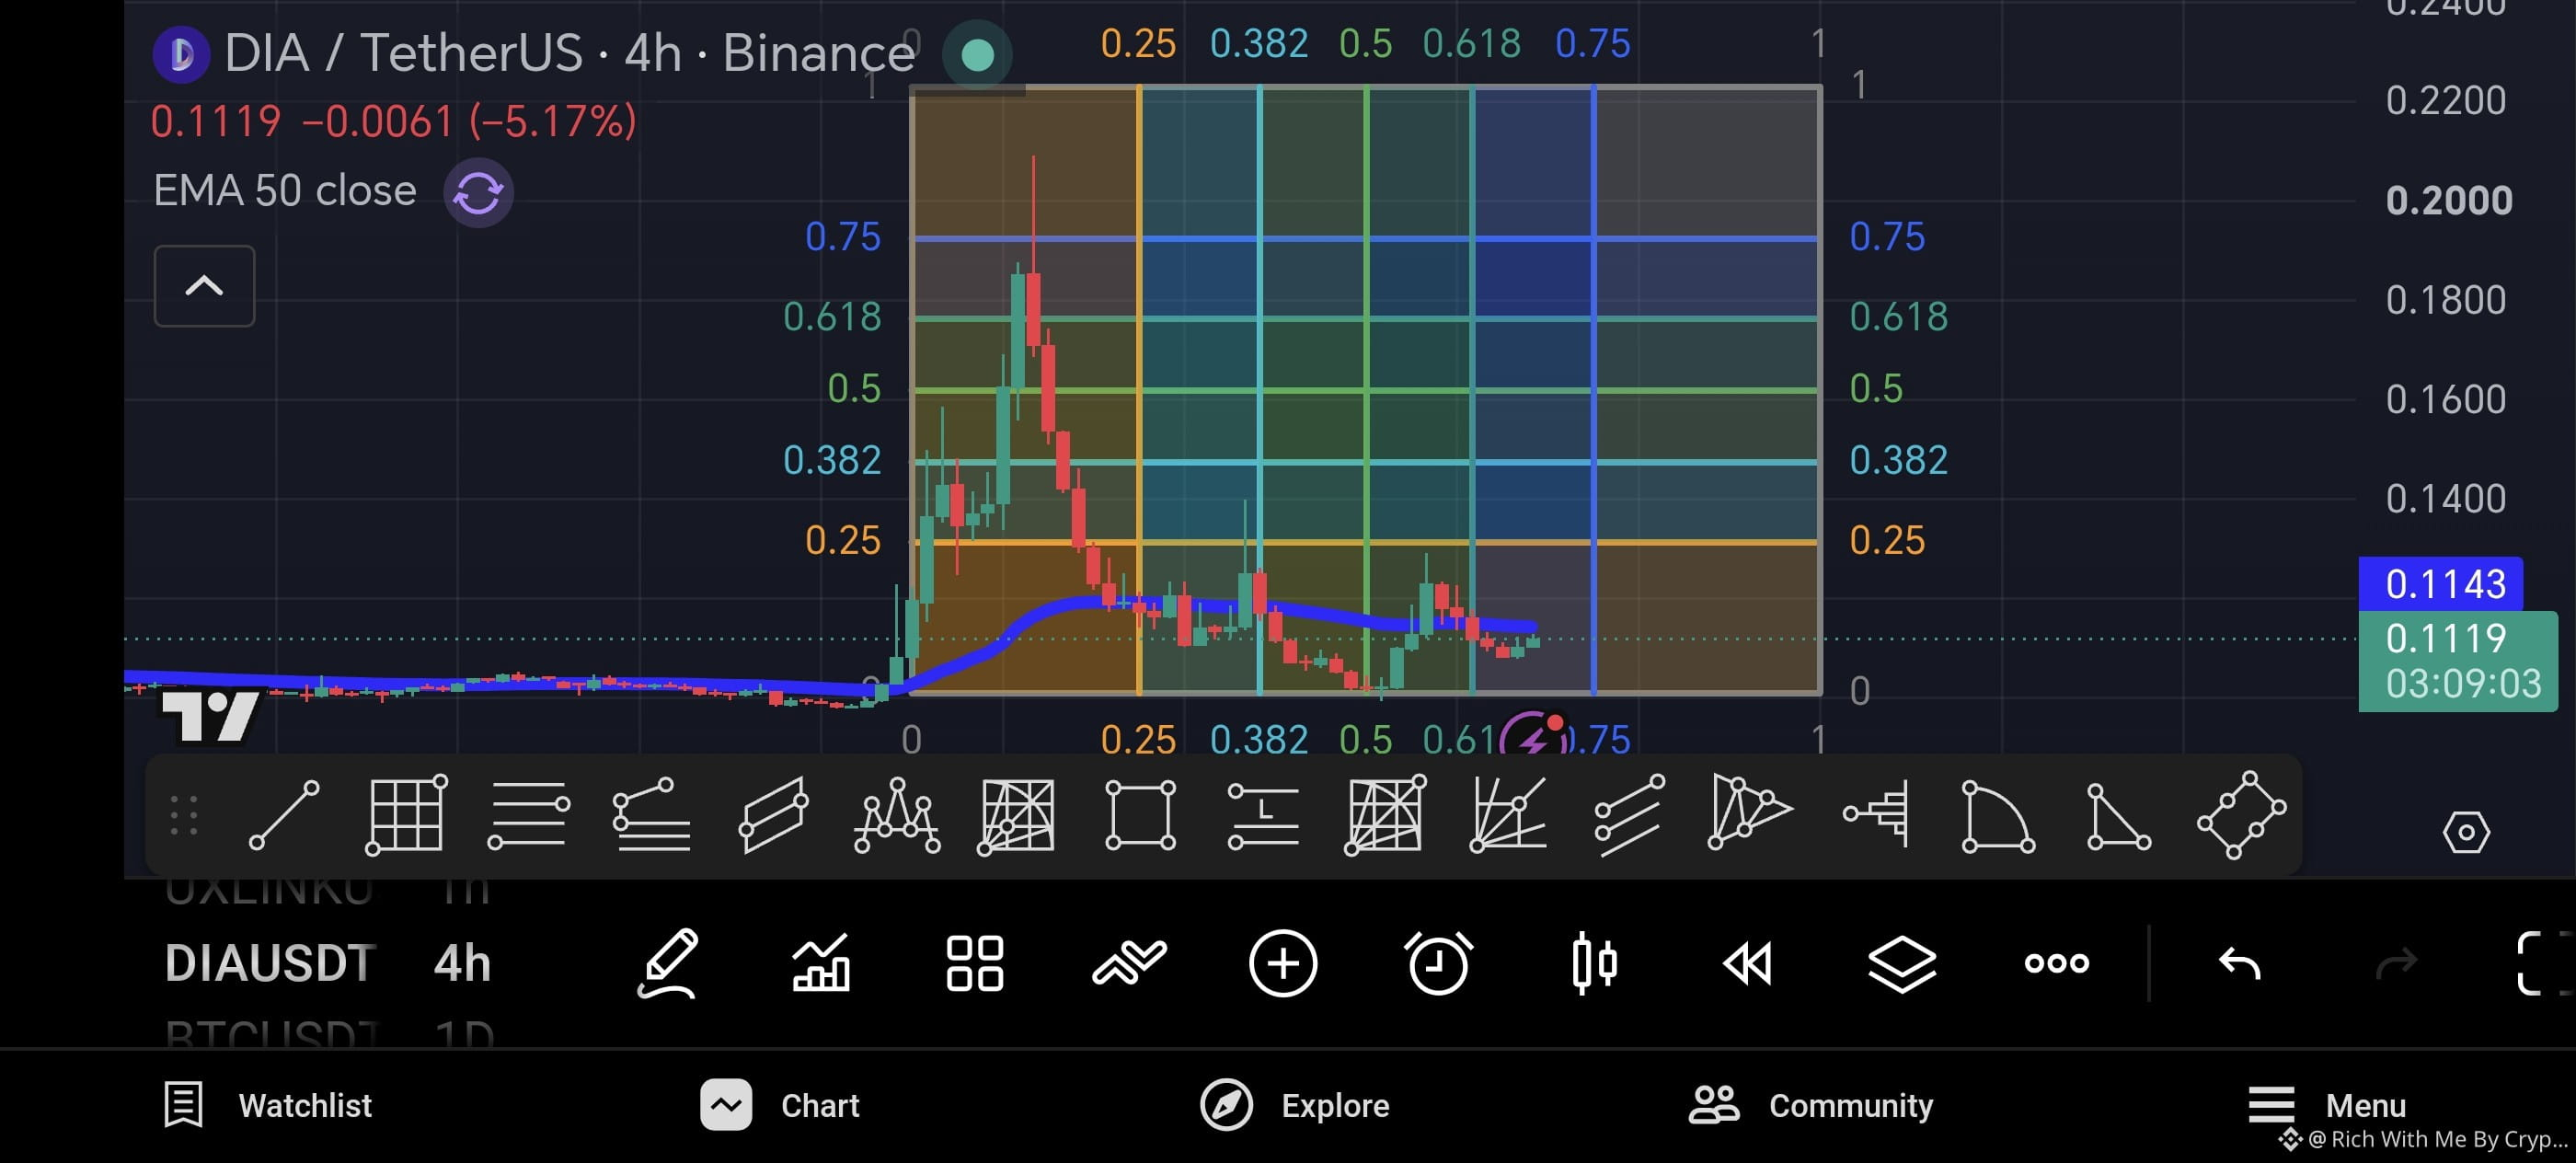
From the 4-hour DIA/USDT chart
Current structure
Price is around 0.112 USDT.
After a sharp pump (to around 0.18–0.20), the coin experienced a strong correction.
It is now moving sideways, indicating consolidation rather than a clear uptrend.
The EMA 50 (blue line) is acting as resistance, and price is hovering around it.
Key levels
Support: 0.105–0.110
Stronger support: 0.095–0.100
Resistance: 0.118–0.125
Major breakout level: 0.135–0.145
Bullish scenario
If DIA closes above 0.125 on the 4H chart with good volume, the next targets could be:
0.14
0.16
0.18
Bearish scenario
If 0.105 breaks, price may fall toward 0.095 or even 0.085.
Spot trading plan
Accumulation zone: 0.105–0.110
Stop-loss: below 0.095
Take-profit:
TP1: 0.125
TP2: 0.145
TP3: 0.16–0.18
Overall view: Neutral to slightly bullish. I would wait for either a confirmed breakout above 0.125 or buy gradually near the support zone instead of chasing the current price.
From the 4-hour DIA/USDT chart
Current structure
Price is around 0.112 USDT.
After a sharp pump (to around 0.18–0.20), the coin experienced a strong correction.
It is now moving sideways, indicating consolidation rather than a clear uptrend.
The EMA 50 (blue line) is acting as resistance, and price is hovering around it.
Key levels
Support: 0.105–0.110
Stronger support: 0.095–0.100
Resistance: 0.118–0.125
Major breakout level: 0.135–0.145
Bullish scenario
If DIA closes above 0.125 on the 4H chart with good volume, the next targets could be:
0.14
0.16
0.18
Bearish scenario
If 0.105 breaks, price may fall toward 0.095 or even 0.085.
Spot trading plan
Accumulation zone: 0.105–0.110
Stop-loss: below 0.095
Take-profit:
TP1: 0.125
TP2: 0.145
TP3: 0.16–0.18
Overall view: Neutral to slightly bullish. I would wait for either a confirmed breakout above 0.125 or buy gradually near the support zone instead of chasing the current price.