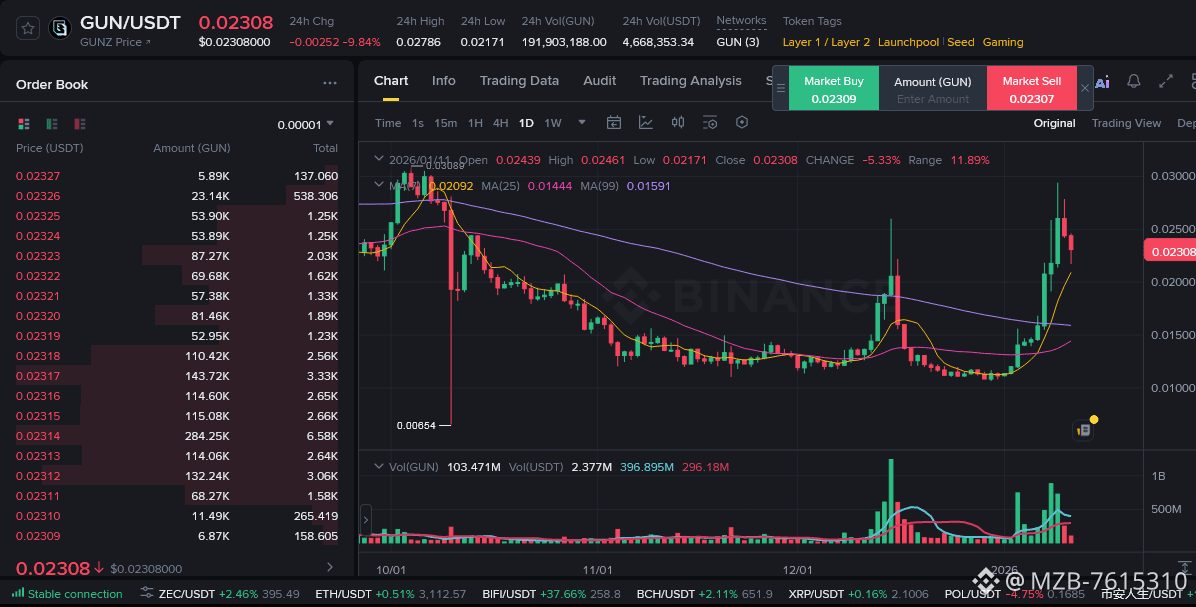
📊 GUN/USDT Technical Analysis – Daily Chart (Binance)
GUN/USDT is currently trading around 0.0230, down nearly 10% on the day, following a sharp rejection from recent highs. Price remains below the long-term descending trendline and is struggling to hold momentum after the latest impulsive move.
🕯️ Key Observations from the Chart:
• Strong rally from the bottom was driven by high volume, signaling speculative interest.
• Price has now pulled back toward the short-term moving average (yellow), acting as immediate support.
• MA(25) is turning up, while MA(99) remains above price — indicating a short-term bounce within a broader corrective structure.
• Volume is cooling after the spike, suggesting consolidation or a potential continuation move is near.
📌 Levels to Watch:
• Support: 0.0217 – 0.0200
• Resistance: 0.0246 → 0.0278
• A clean break above the descending trendline could open room for continuation; failure may lead to deeper retracement.
⚠️ Volatility remains high — risk management is key.
#GUN #GUNUSDT #Binance #CryptoTrading #Altcoins #TechnicalAnalysis #PriceAction #ChartAnalysis #Volatility #DYOR
Not financial advice. Always DYOR before trading!
GUN/USDT is currently trading around 0.0230, down nearly 10% on the day, following a sharp rejection from recent highs. Price remains below the long-term descending trendline and is struggling to hold momentum after the latest impulsive move.
🕯️ Key Observations from the Chart:
• Strong rally from the bottom was driven by high volume, signaling speculative interest.
• Price has now pulled back toward the short-term moving average (yellow), acting as immediate support.
• MA(25) is turning up, while MA(99) remains above price — indicating a short-term bounce within a broader corrective structure.
• Volume is cooling after the spike, suggesting consolidation or a potential continuation move is near.
📌 Levels to Watch:
• Support: 0.0217 – 0.0200
• Resistance: 0.0246 → 0.0278
• A clean break above the descending trendline could open room for continuation; failure may lead to deeper retracement.
⚠️ Volatility remains high — risk management is key.
#GUN #GUNUSDT #Binance #CryptoTrading #Altcoins #TechnicalAnalysis #PriceAction #ChartAnalysis #Volatility #DYOR
Not financial advice. Always DYOR before trading!