
While the Last Full Day Low is an excellent stop-loss reference, it can also reveal valuable information about the strength of the breakout itself.
Not all successful breakouts behave the same way.
Some explode higher without hesitation.
Others pull back to test former resistance before continuing.
Some experience deep shakeouts before eventually reaching their objectives.
Others fail completely.
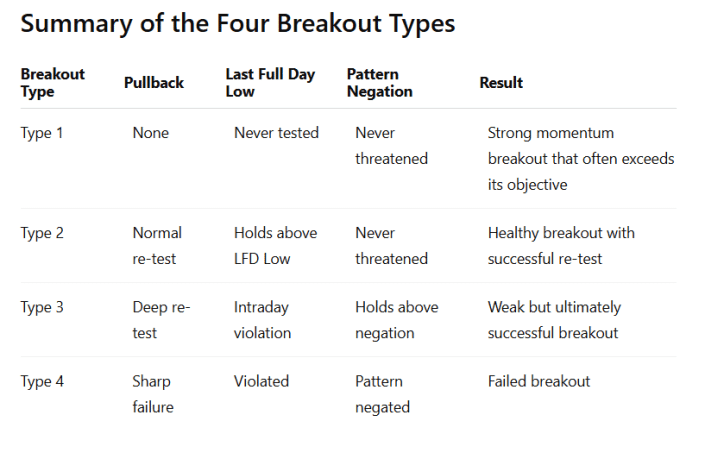
These differences can be organized into four objective breakout types.
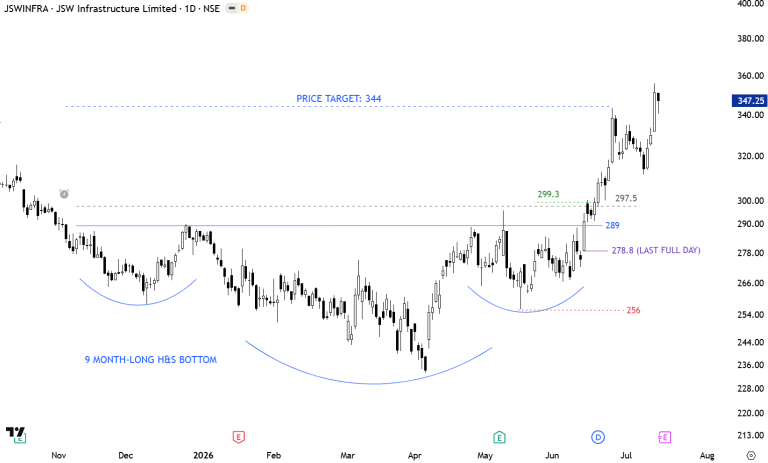
Type 1 – Momentum Breakout
A Type 1 breakout occurs when price breaks out of a chart pattern and rallies directly toward its measured price objective without any meaningful pullback.
Characteristics include
Immediate expansion away from the breakout level
No meaningful re-test of the pattern boundary
No test of the Last Full Day Low
Strong institutional demand
Frequently exceeds the measured move objective
These are the strongest breakouts because buyers remain in control from the moment of the breakout.
Type 1 breakouts often occur in leading stocks during strong bull markets.
Type 2 – Standard Re-test Breakout
A Type 2 breakout occurs when price breaks out successfully but later returns to test the former resistance level.
During this pullback:
Price may touch or slightly penetrate the breakout boundary.
The Last Full Day Low remains intact.
The violation is judged on an intraday basis, not a closing basis.
Buyers quickly regain control.
The measured objective is eventually achieved.
This represents the classic “breakout and re-test” behavior frequently observed in healthy trends.
The former resistance successfully becomes new support.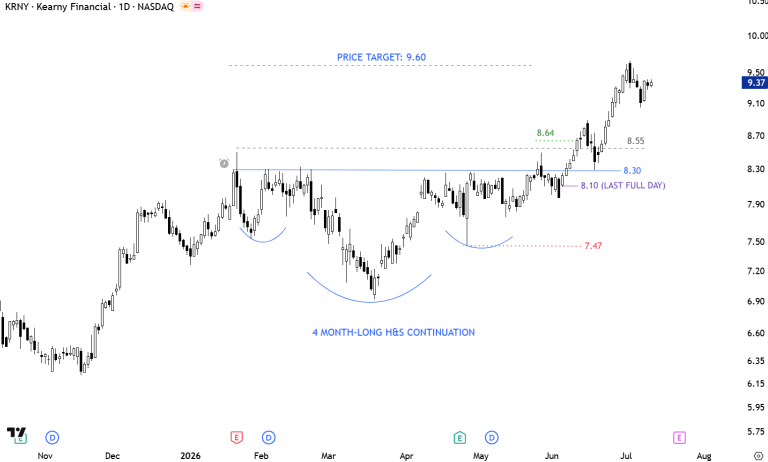
Type 3 – Deep Re-test Breakout
A Type 3 breakout represents a much weaker but still successful breakout.
After the breakout:
Price retraces sharply.
The pullback violates the Last Full Day Low on an intraday basis.
However, price remains above the chart pattern negation level.
Buyers eventually regain control.
The measured price objective is ultimately reached.
From a risk management perspective, Brandt’s original stop based on the Last Full Day Low would likely have been triggered.
From a chart pattern perspective, however, the pattern itself remains valid because its structural support has not failed.
These breakouts often shake out weaker holders before resuming their advance.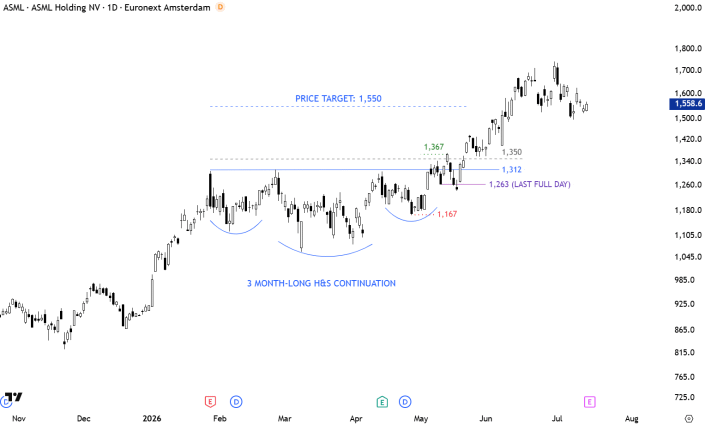
Type 4 – Failed Breakout
A Type 4 breakout occurs when the breakout cannot be sustained.
Price:
Breaks out initially.
Pulls back aggressively.
Violates the Last Full Day Low.
Continues downward until reaching the chart pattern negation level.
Invalidates the original chart pattern.
Once the pattern negation level is broken, the original trading thesis no longer exists.
This represents a failed breakout and an unsuccessful chart pattern.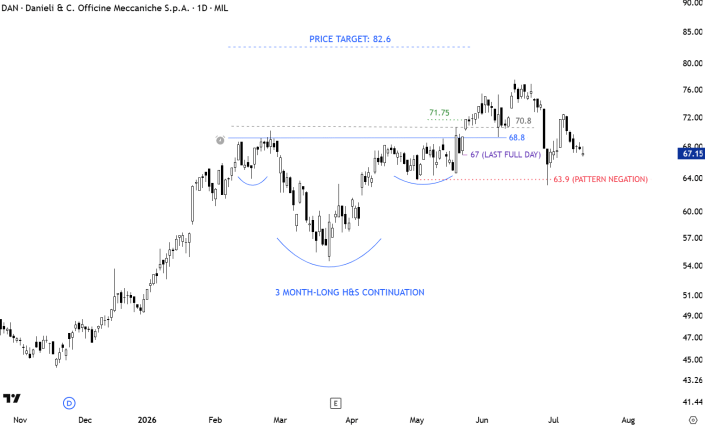
Summary for the 4 types of breakout: