🚀 SOL/USDT Technical Analysis: Navigating the Consolidation Phase
Solana ($SOL) is currently exhibiting a strategic consolidation pattern, signaling a potential buildup for its next major move. After experiencing volatility earlier in the year, the price action is now stabilizing within a defined range.
📊 Key Technical Indicators:
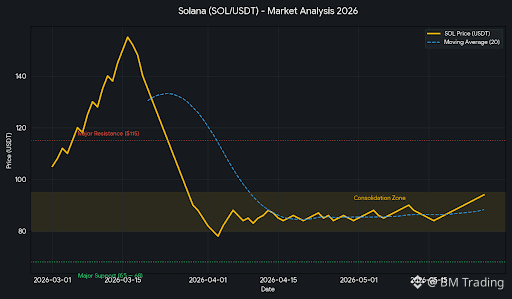
Current Trend: $SOL is currently trading within a Consolidation Zone between $80 and $95. This sideways movement suggests that the market is absorbing previous sell-offs and preparing for a breakout.
Moving Averages: The 20-day Moving Average is beginning to flatten, indicating a temporary equilibrium between buyers and sellers.
Support Level: A rock-solid Major Support exists between $65 - $68. This zone has historically acted as a strong demand area where buyers step in aggressively.
Resistance Level: The immediate hurdle for a bullish reversal is the $115 Major Resistance. A clean daily close above this level with high volume is required to confirm a trend shift.
💡 Trading Strategy:
Bullish Case: If $SOL breaks and holds above $115, we could see a rapid move toward the $140 - $160 targets.
Bearish Case: A breakdown below the $80 mark might lead to a "re-test" of the $65 support level before the next leg up.
Conclusion: This is an ideal time for "accumulation" for long-term holders, while swing traders should wait for a confirmed breakout above resistance.
Disclaimer: This analysis is for educational purposes only and does not constitute financial advice. Always perform your own research (DYOR) before trading.
Hashtags: #SOL #Solana #CryptoAnalysis #BinanceSquare #Altcoins #TradingSignals
Solana ($SOL) is currently exhibiting a strategic consolidation pattern, signaling a potential buildup for its next major move. After experiencing volatility earlier in the year, the price action is now stabilizing within a defined range.
📊 Key Technical Indicators:
Current Trend: $SOL is currently trading within a Consolidation Zone between $80 and $95. This sideways movement suggests that the market is absorbing previous sell-offs and preparing for a breakout.
Moving Averages: The 20-day Moving Average is beginning to flatten, indicating a temporary equilibrium between buyers and sellers.
Support Level: A rock-solid Major Support exists between $65 - $68. This zone has historically acted as a strong demand area where buyers step in aggressively.
Resistance Level: The immediate hurdle for a bullish reversal is the $115 Major Resistance. A clean daily close above this level with high volume is required to confirm a trend shift.
💡 Trading Strategy:
Bullish Case: If $SOL breaks and holds above $115, we could see a rapid move toward the $140 - $160 targets.
Bearish Case: A breakdown below the $80 mark might lead to a "re-test" of the $65 support level before the next leg up.
Conclusion: This is an ideal time for "accumulation" for long-term holders, while swing traders should wait for a confirmed breakout above resistance.
Disclaimer: This analysis is for educational purposes only and does not constitute financial advice. Always perform your own research (DYOR) before trading.
Hashtags: #SOL #Solana #CryptoAnalysis #BinanceSquare #Altcoins #TradingSignals