$BTC Heading for a New Peak? 🚀 BTC/USDT Exclusive Chart Analysis & Trade Guide! 📊💰
Based on the 1-hour (1h) chart, here is the short breakdown:
Market Analysis
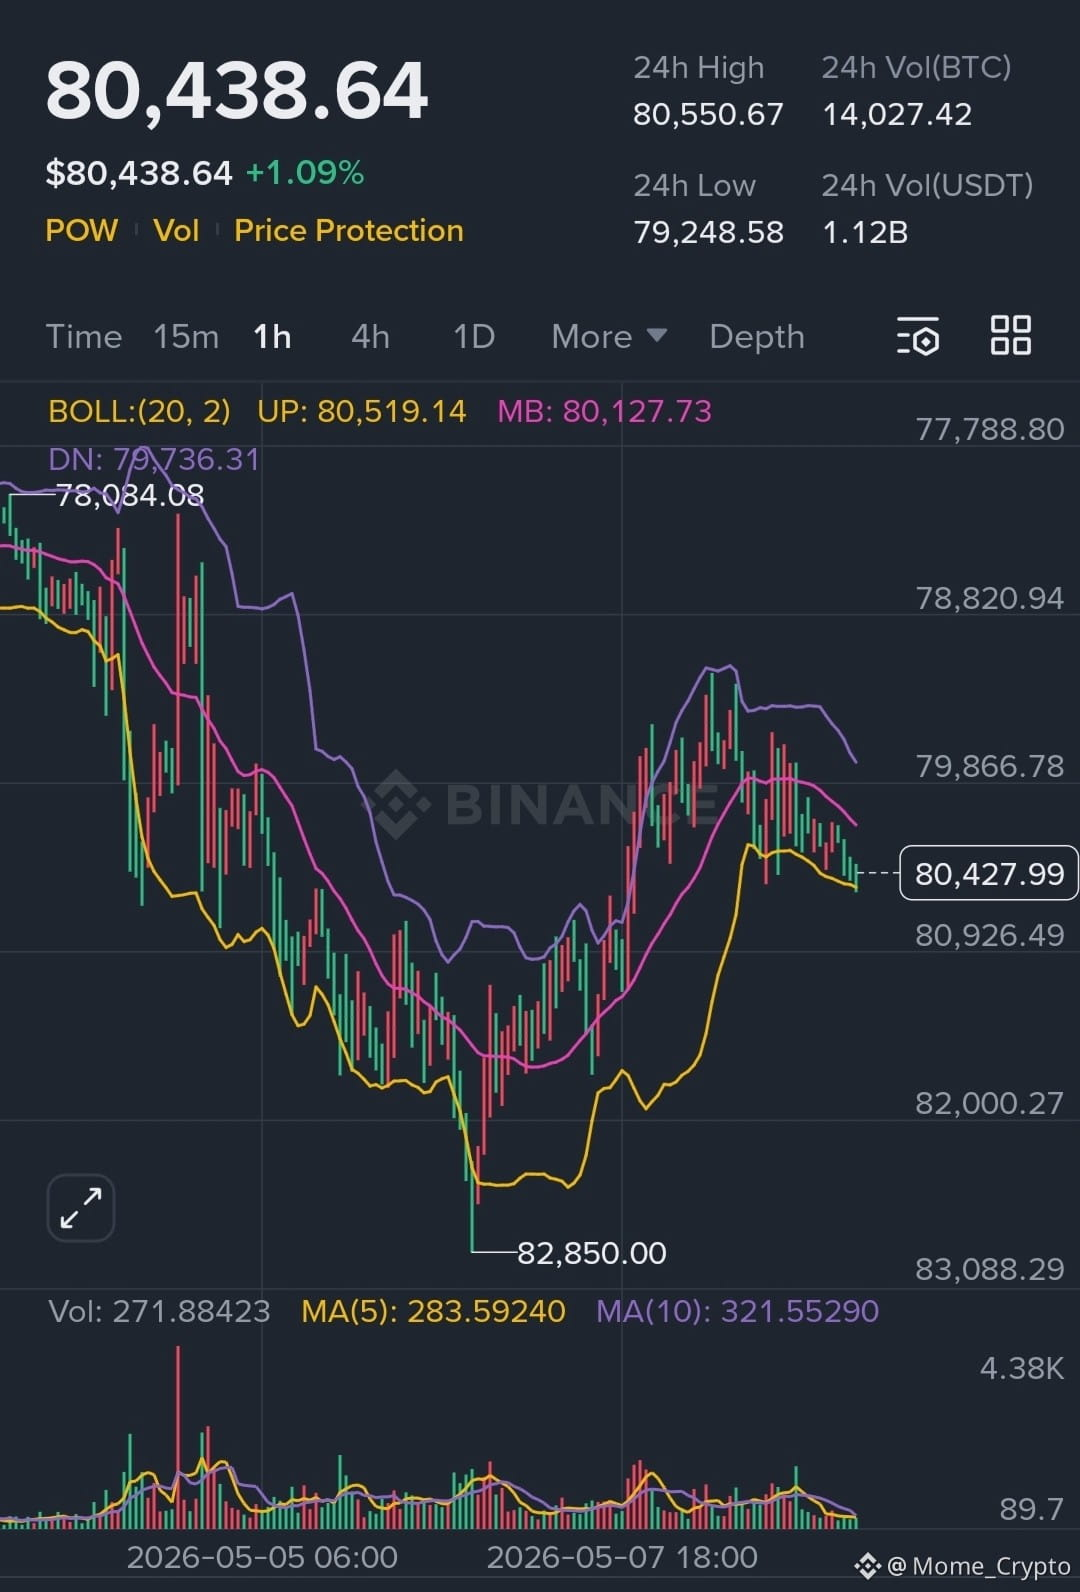
Current Trend: BTC is showing a V-shaped recovery. It is currently consolidating near $80,427 after bouncing back from a recent low.
Bollinger Bands: Price is testing the middle band. Staying above this level suggests a move toward the upper resistance near $80,519.
Volume: Trading volume is currently low, indicating a period of consolidation before the next major move.
Trading Strategy
Entry Zone: $80,120 – $80,430 (Buying on the dip near the middle band is safer).
Take Profit (TP):
TP 1: $80,550 (Recent 24h high).
TP 2: $80,900 – $81,500 (Next major resistance).
Stop Loss (SL): Place below the support level at $79,800 to minimize risk.
$BTC
Based on the 1-hour (1h) chart, here is the short breakdown:
Market Analysis
Current Trend: BTC is showing a V-shaped recovery. It is currently consolidating near $80,427 after bouncing back from a recent low.
Bollinger Bands: Price is testing the middle band. Staying above this level suggests a move toward the upper resistance near $80,519.
Volume: Trading volume is currently low, indicating a period of consolidation before the next major move.
Trading Strategy
Entry Zone: $80,120 – $80,430 (Buying on the dip near the middle band is safer).
Take Profit (TP):
TP 1: $80,550 (Recent 24h high).
TP 2: $80,900 – $81,500 (Next major resistance).
Stop Loss (SL): Place below the support level at $79,800 to minimize risk.
$BTC