$SKYAI
🚀 SKYAI/USDT Goes Parabolic: The March to $1.00 is On! 🚀
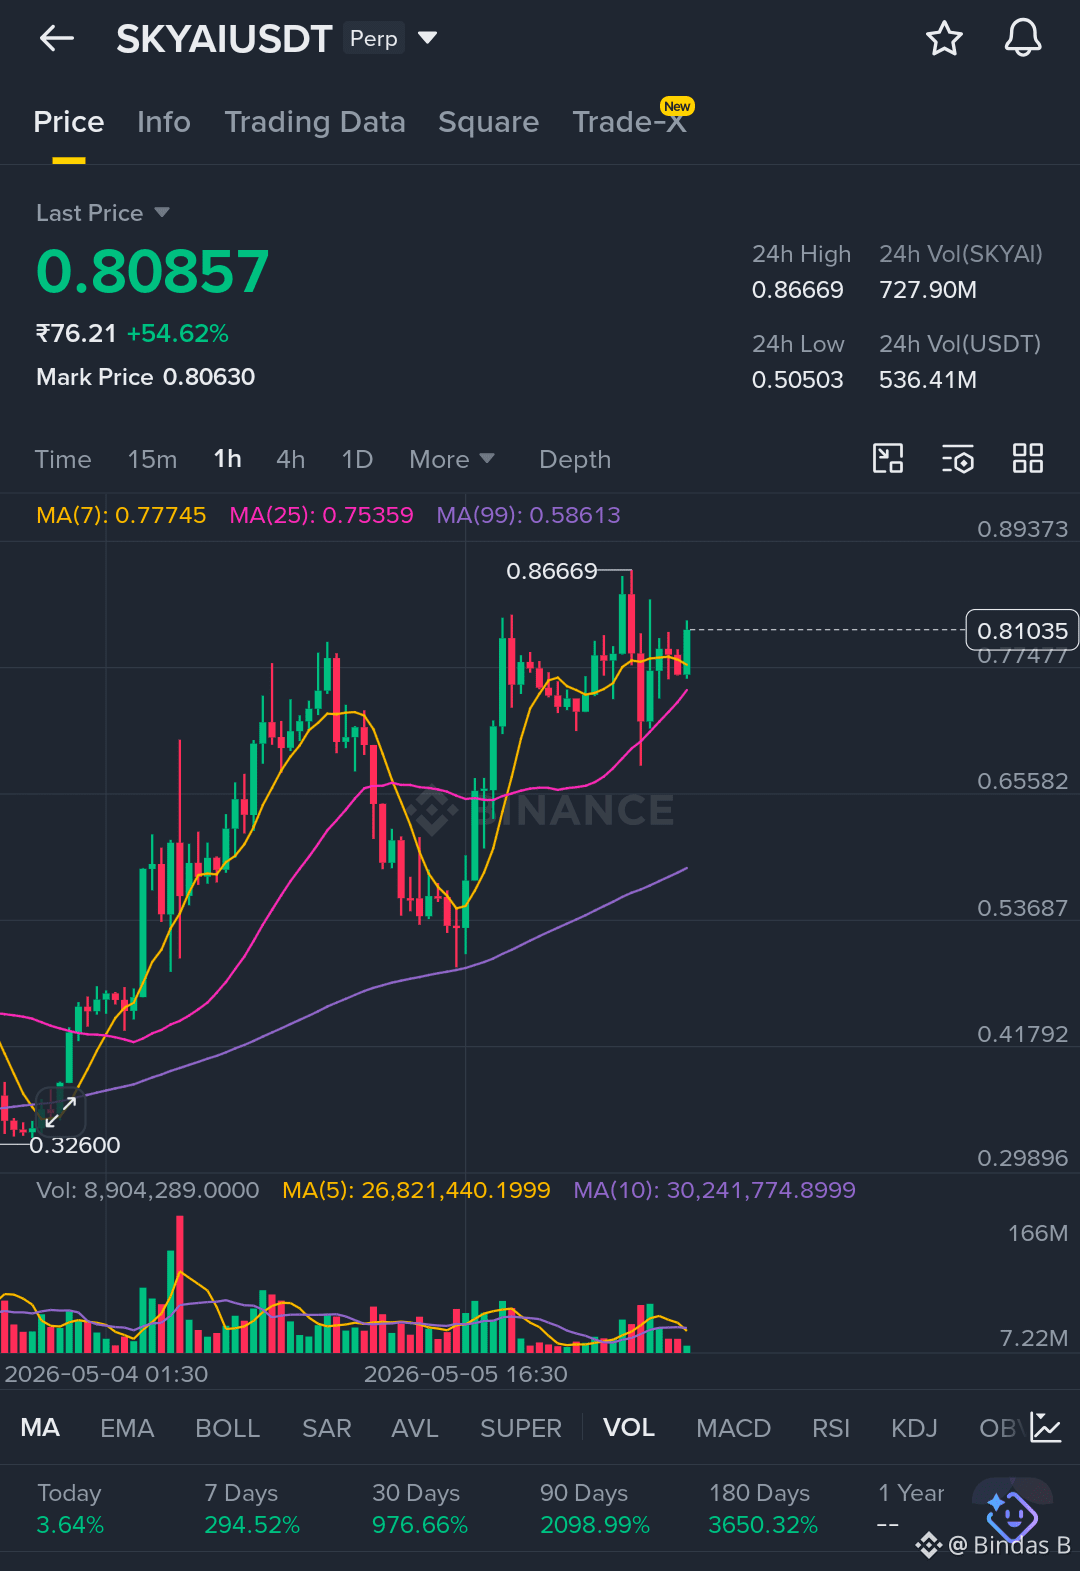
While the broader market fights for single-digit gains, the AI sector is printing absolute moonshots. SKYAI has surged a massive +54% in 24 hours, hitting a local high of $0.86669.
Zoom out and the numbers get wilder: +976% in 30 days and over +3,600% in 180 days.
Here is a quick breakdown of the 1-hour chart and how to play it:
📈 The Technical Breakdown (1H Chart)
"Shakeout and Recover" Structure: After a sharp pullback, buyers immediately absorbed the sell-off, printing a strong higher low and propelling the price back up.
Dynamic Support: * MA(7) at $0.77745: Acting as immediate dynamic support (price currently hovering near $0.80857).
MA(25) at $0.75359: The ultimate line in the sand for the bulls.
Volume: Volume peaked on the breakout and dried up during the pullback—suggesting healthy consolidation, not a mass sell-off.
🔮 Trading Scenarios
The Bull Case (Target: $1.00): If SKYAI holds above the MA(7) and breaks resistance at $0.8100, expect a retest of $0.86669. Slicing through that opens up price discovery with the psychological $1.00 milestone as a magnet.
The Bear Case (Correction): If we lose the MA(25) at $0.75359 on an hourly close, the short-term bullish structure breaks. This could trigger a slide back to $0.65000, or down to the lagging MA(99) at $0.58613 in a deeper macro correction.
⚠️ Risk Management First
Vertical moves can lead to brutal 30–40% pullbacks in hours. Avoid chasing and buying blindly. Look for confirmed breakouts above $0.86669 or tight stop-loss entries on a retest of the MA(25). Play smart!
Disclaimer: Not financial advice. Always do your own research.
🚀 SKYAI/USDT Goes Parabolic: The March to $1.00 is On! 🚀
While the broader market fights for single-digit gains, the AI sector is printing absolute moonshots. SKYAI has surged a massive +54% in 24 hours, hitting a local high of $0.86669.
Zoom out and the numbers get wilder: +976% in 30 days and over +3,600% in 180 days.
Here is a quick breakdown of the 1-hour chart and how to play it:
📈 The Technical Breakdown (1H Chart)
"Shakeout and Recover" Structure: After a sharp pullback, buyers immediately absorbed the sell-off, printing a strong higher low and propelling the price back up.
Dynamic Support: * MA(7) at $0.77745: Acting as immediate dynamic support (price currently hovering near $0.80857).
MA(25) at $0.75359: The ultimate line in the sand for the bulls.
Volume: Volume peaked on the breakout and dried up during the pullback—suggesting healthy consolidation, not a mass sell-off.
🔮 Trading Scenarios
The Bull Case (Target: $1.00): If SKYAI holds above the MA(7) and breaks resistance at $0.8100, expect a retest of $0.86669. Slicing through that opens up price discovery with the psychological $1.00 milestone as a magnet.
The Bear Case (Correction): If we lose the MA(25) at $0.75359 on an hourly close, the short-term bullish structure breaks. This could trigger a slide back to $0.65000, or down to the lagging MA(99) at $0.58613 in a deeper macro correction.
⚠️ Risk Management First
Vertical moves can lead to brutal 30–40% pullbacks in hours. Avoid chasing and buying blindly. Look for confirmed breakouts above $0.86669 or tight stop-loss entries on a retest of the MA(25). Play smart!
Disclaimer: Not financial advice. Always do your own research.