*Elliott Wave Analysis – Solana (SOL/USDT)*
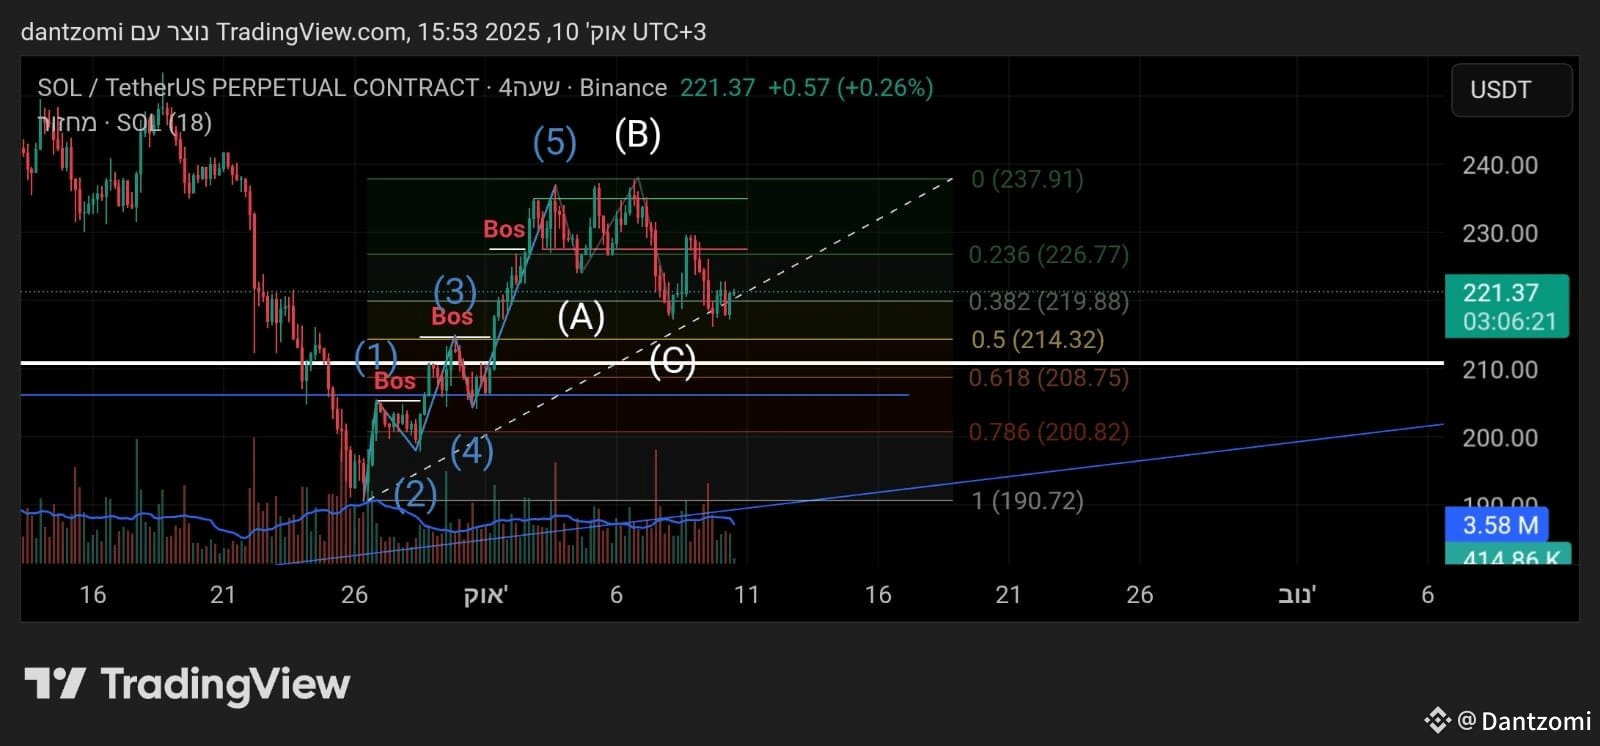
We’ve likely completed a classic 5-wave impulse move (blue) followed by an ABC corrective pattern (white).
Wave (5) peaked near 237.91 USDT, and the retracement has since pulled back close to the 0.5–0.618 Fibonacci zone — a typical area for Wave C to complete.
Currently, SOL is holding above the 0.5 level (214.32). If this support continues to hold and price breaks above 226.77 (0.236 Fib) with strong volume, it may signal that the correction has ended and a new bullish wave is beginning.
However, failure to hold above 214 could mean further downside towards 208.75 or even 200.82. Watch price action closely — a breakdown below 208 would indicate the correction is still in progress.
In summary:
- ✅ Support: 214.32 / 208.75
- ⚠️ Resistance: 226.77 / 237.91
- 🔍 Breakout above 226.77 = early signal for bullish continuation
- ❗Breakdown below 208 = deeper correction possible
Stay alert — this is a key zone that could define SOL's next big move.
Stay tuned for more, stay safe DYOR!
$SOL #solana
We’ve likely completed a classic 5-wave impulse move (blue) followed by an ABC corrective pattern (white).
Wave (5) peaked near 237.91 USDT, and the retracement has since pulled back close to the 0.5–0.618 Fibonacci zone — a typical area for Wave C to complete.
Currently, SOL is holding above the 0.5 level (214.32). If this support continues to hold and price breaks above 226.77 (0.236 Fib) with strong volume, it may signal that the correction has ended and a new bullish wave is beginning.
However, failure to hold above 214 could mean further downside towards 208.75 or even 200.82. Watch price action closely — a breakdown below 208 would indicate the correction is still in progress.
In summary:
- ✅ Support: 214.32 / 208.75
- ⚠️ Resistance: 226.77 / 237.91
- 🔍 Breakout above 226.77 = early signal for bullish continuation
- ❗Breakdown below 208 = deeper correction possible
Stay alert — this is a key zone that could define SOL's next big move.
Stay tuned for more, stay safe DYOR!
$SOL #solana