#SOLUSDT
#bullrun2024📈📈
1. Current Price Action & Trend
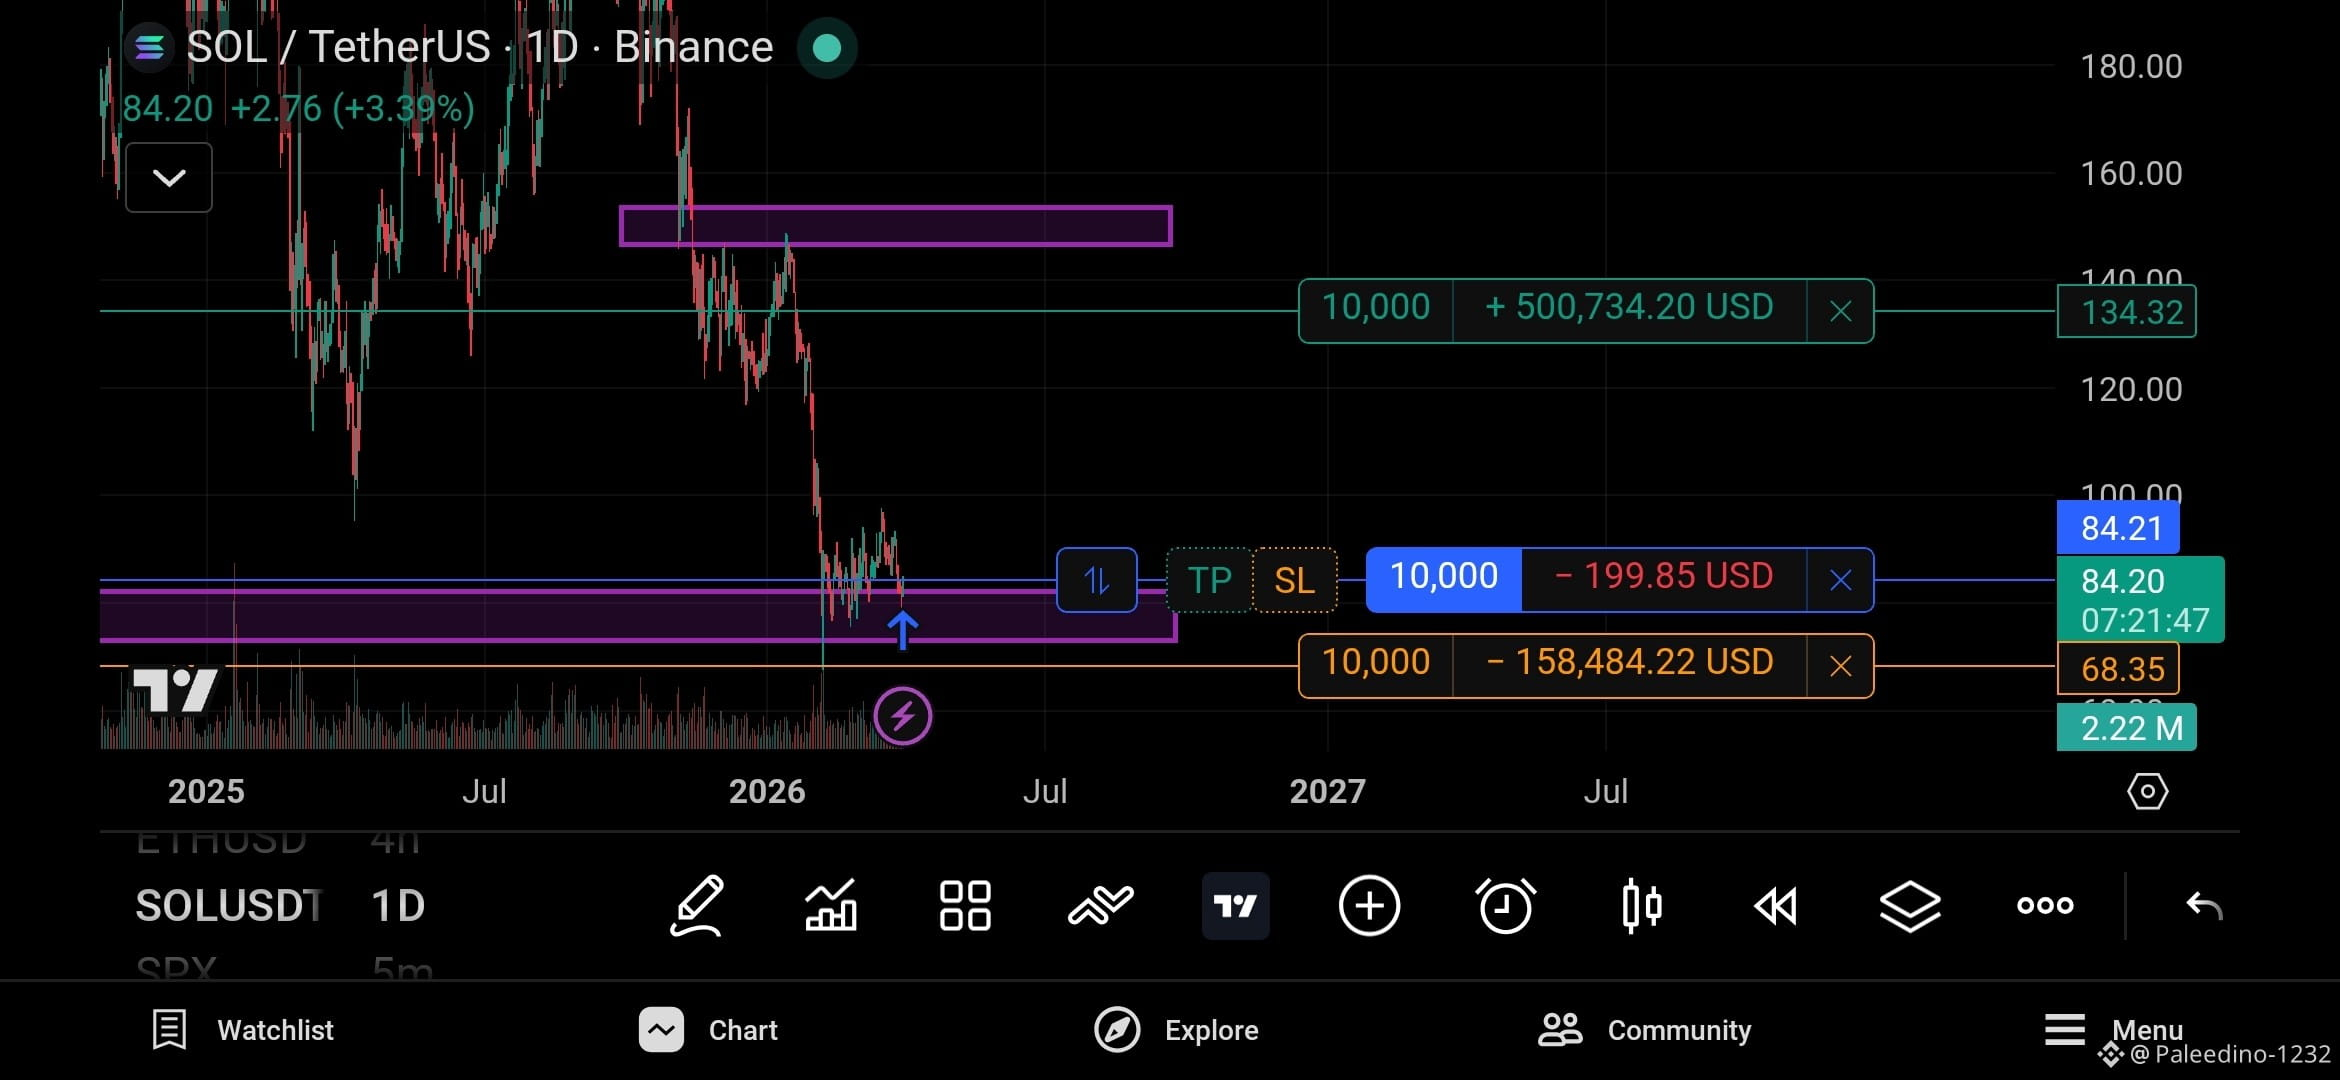
Current Price: Approximately $84.21.
Trend: The asset has undergone a significant correction from its 2025 highs (around $180) and is currently in a consolidation phase near the lows.
Support Zone: There is a clearly marked purple demand zone between roughly $68 and $84. The price is currently sitting at the top of this liquidity area.
2. Trade Setup Details
The chart shows an active long position (Buy) with the following parameters:
Entry Point: $84.20.
Take Profit (TP): Set at $134.32. If reached, this represents a projected profit of over $500,000 based on the 10,000 unit position size.
Stop Loss (SL): Set at $68.35. This is positioned at the bottom of the current support zone to protect against a breakdown.
3. Market Indicators
Timeframe: 1D (Daily), meaning each candle represents one day of trading. This setup is geared toward a medium-to-long-term swing trade.
Volume: There is a visible spike in volume near the recent lows, which often suggests "buying the dip" or accumulation by larger players.
Psychological Levels: The $100 level will likely act as the first major psychological resistance on the way up to the $134 target.
4. Risk/Reward Outlook
Strategy: This is a "bottom-fishing" play, attempting to catch a reversal at a historical support level.
Risk: The gap between the entry ($84) and the stop loss ($68) is significant. Ensure your total portfolio risk is managed if the price moves into that lower orange zone.
#bullrun2024📈📈
1. Current Price Action & Trend
Current Price: Approximately $84.21.
Trend: The asset has undergone a significant correction from its 2025 highs (around $180) and is currently in a consolidation phase near the lows.
Support Zone: There is a clearly marked purple demand zone between roughly $68 and $84. The price is currently sitting at the top of this liquidity area.
2. Trade Setup Details
The chart shows an active long position (Buy) with the following parameters:
Entry Point: $84.20.
Take Profit (TP): Set at $134.32. If reached, this represents a projected profit of over $500,000 based on the 10,000 unit position size.
Stop Loss (SL): Set at $68.35. This is positioned at the bottom of the current support zone to protect against a breakdown.
3. Market Indicators
Timeframe: 1D (Daily), meaning each candle represents one day of trading. This setup is geared toward a medium-to-long-term swing trade.
Volume: There is a visible spike in volume near the recent lows, which often suggests "buying the dip" or accumulation by larger players.
Psychological Levels: The $100 level will likely act as the first major psychological resistance on the way up to the $134 target.
4. Risk/Reward Outlook
Strategy: This is a "bottom-fishing" play, attempting to catch a reversal at a historical support level.
Risk: The gap between the entry ($84) and the stop loss ($68) is significant. Ensure your total portfolio risk is managed if the price moves into that lower orange zone.