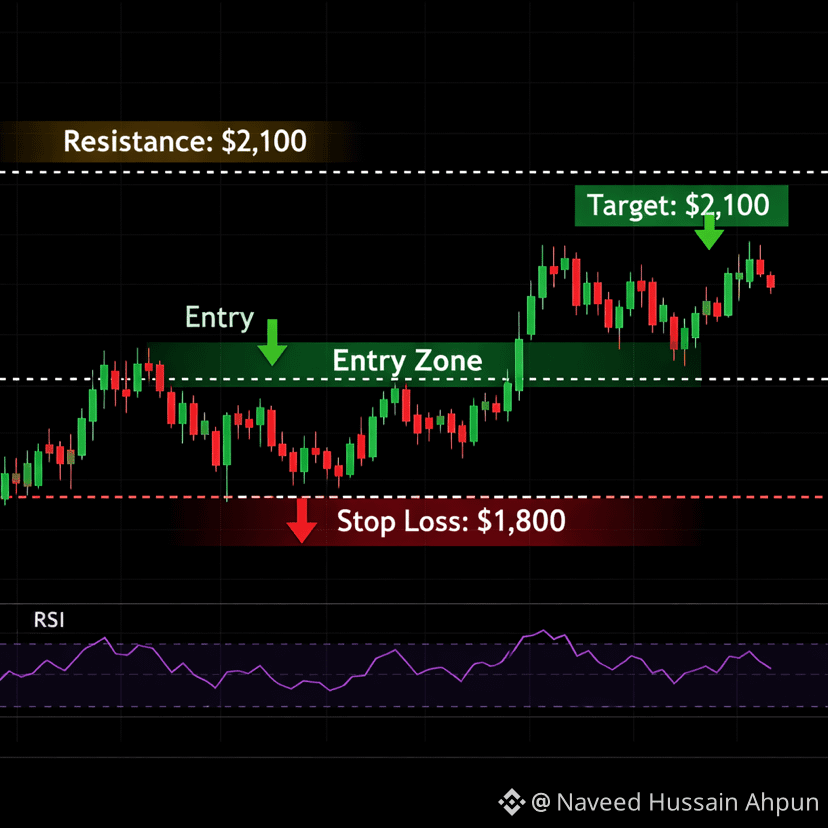
1. Candle Structure
• Recent candles show small bodies and consolidation after a previous drop.
• This means buyers and sellers are both active but momentum is weak.
• Lack of strong bullish candles indicates buyers are still cautious. 
2. Trend Direction
• The overall structure shows lower highs and lower lows, which signals a bearish trend on higher timeframes. 
• ETH is also trading below several moving averages, showing continued selling pressure. 
3. Key Levels on the Chart
Resistance (where price may struggle):
• $2,100
• $2,300 – $2,400
Support (where buyers may enter):
• $1,800
• $1,600
A break above $2,300 could start a short bullish trend.
A drop below $1,800 may push ETH toward $1,600. 
4. Indicator Signals
• RSI around 30–35 → near oversold zone. 
• Volume during consolidation is low, meaning no strong buying yet. 
✅ Short conclusion:
• Market is sideways but slightly bearish.
• Traders are watching the $2,100 breakout or $1,800 breakdown for the next move.
• Recent candles show small bodies and consolidation after a previous drop.
• This means buyers and sellers are both active but momentum is weak.
• Lack of strong bullish candles indicates buyers are still cautious. 
2. Trend Direction
• The overall structure shows lower highs and lower lows, which signals a bearish trend on higher timeframes. 
• ETH is also trading below several moving averages, showing continued selling pressure. 
3. Key Levels on the Chart
Resistance (where price may struggle):
• $2,100
• $2,300 – $2,400
Support (where buyers may enter):
• $1,800
• $1,600
A break above $2,300 could start a short bullish trend.
A drop below $1,800 may push ETH toward $1,600. 
4. Indicator Signals
• RSI around 30–35 → near oversold zone. 
• Volume during consolidation is low, meaning no strong buying yet. 
✅ Short conclusion:
• Market is sideways but slightly bearish.
• Traders are watching the $2,100 breakout or $1,800 breakdown for the next move.