
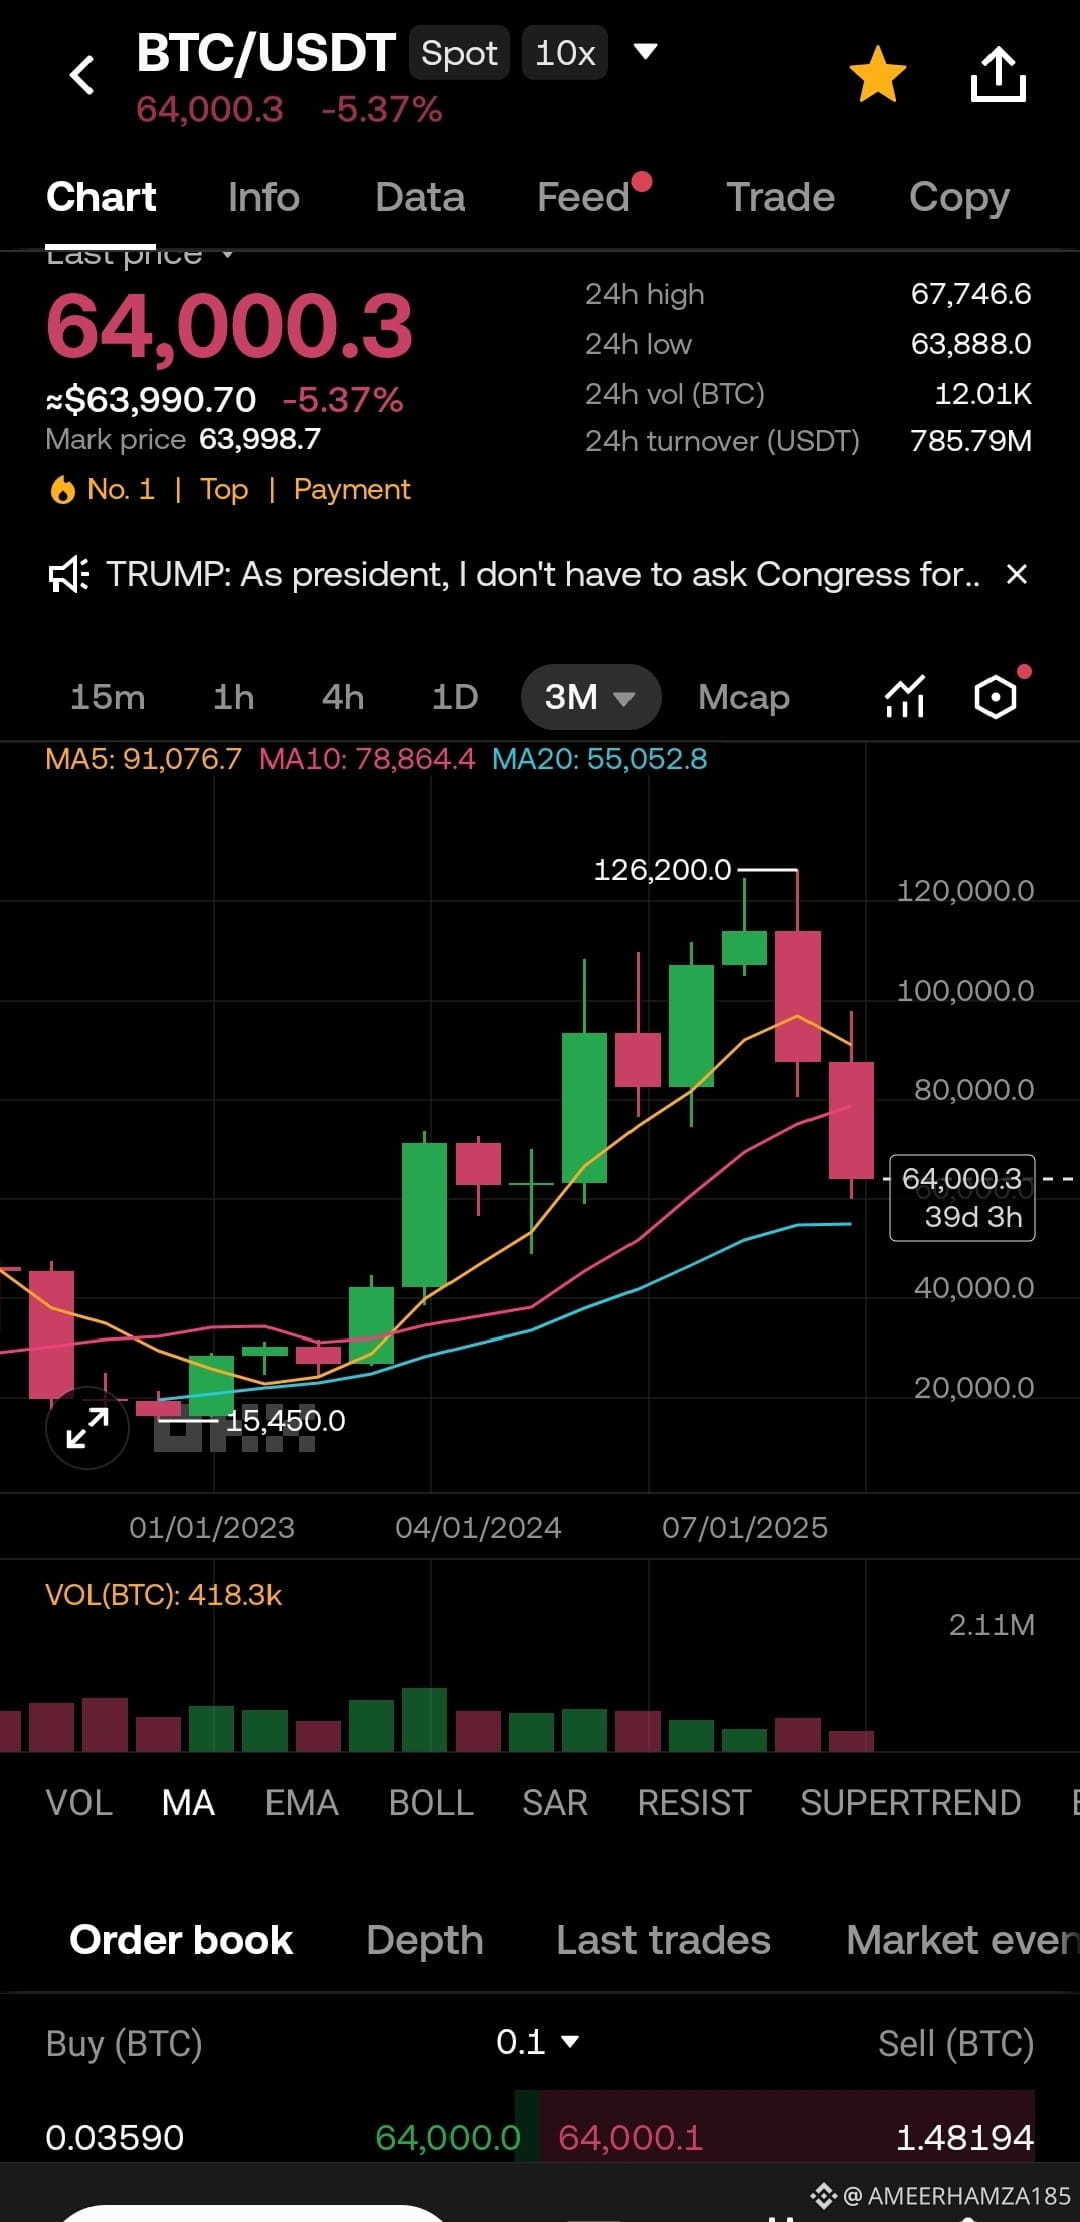
The chart shows that Bitcoin (BTC/USDT) is currently trading around $64,000 after a strong rally that pushed the price to nearly $126,200, followed by a noticeable correction. This kind of movement usually indicates a healthy market cycle where profits are taken before the next trend begins. From the image, the price is still above the long-term moving average (MA20), which suggests that the overall long-term trend could remain bullish despite short-term volatility. If BTC holds support near the $60K–$65K zone, the market may consolidate for some time and then attempt another upward move toward the $80K–$100K range in the future. However, if the price breaks below this support level, a deeper pullback could occur before buyers regain control. Overall, the chart reflects a market that is cooling down after a major bullish run but still has potential for growth in the coming months if demand and investor confidence remain strong.


Посты
Отказ от ответственности. Содержит мнения третьих сторон. Не является рекомендацией. Binance AI не предоставляет гарантий. См. Правила и условия.