



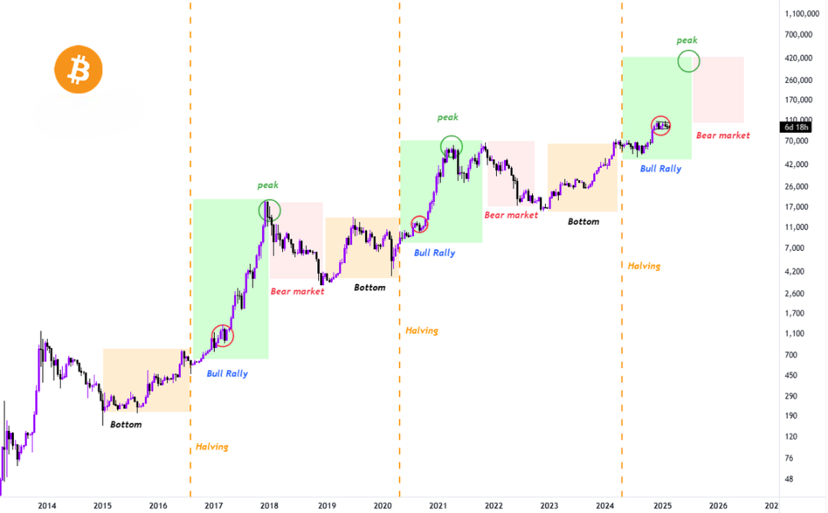
Most traders obsess over charts. Trendlines, breakouts, moving averages. And yes — structure matters.
But the real force behind Bitcoin’s biggest expansions and collapses rarely lives on the chart.
It lives in liquidity.
Bitcoin Doesn’t Move in Isolation
Bitcoin is often framed as a standalone revolution. But in practice, it behaves like a macro-sensitive asset. When global liquidity expands, BTC thrives. When liquidity contracts, it struggles — regardless of how strong the narrative may be.
Liquidity is simply the amount of money flowing through the financial system.
• Central banks cut rates → liquidity expands
• Quantitative easing increases → liquidity expands
• Bond yields fall → risk appetite improves
Reverse those conditions — and liquidity tightens.
Bitcoin reacts accordingly.
2020–2021: A Liquidity Explosion
The historic bull run wasn’t random.
It followed one of the most aggressive monetary expansions in modern history. Trillions of dollars entered global markets. Investors searched for yield and growth. Excess capital needed a home.
#Bitcoin absorbed a portion of that flow.
Price didn’t go vertical because of hype alone — it went vertical because the system was flooded with capital.
2022: The Tide Went Out
When central banks pivoted aggressively to fight inflation, liquidity reversed.
Rates surged. Yields rose. Risk appetite contracted.
Bitcoin fell alongside high-growth equities. Not because the network failed — but because capital became scarce.
This is the part many retail traders miss.
$BTC rarely crashes alone.
It sinks when liquidity drains.
Liquidity Moves Before Price Does
Here’s where smart money gains its edge.
Liquidity cycles move slowly. Policy shifts don’t happen overnight. Bond markets often reprice expectations months before crypto reacts.
Macro investors watch:
• Global M2 money supply
• Central bank balance sheets
• Real yields
• Dollar strength
• Credit conditions
These signals often shift before Bitcoin confirms the move.
Charts show the wave.
Liquidity shows the tide.
Institutions Amplify the Connection
As institutional participation increases, Bitcoin’s correlation to macro conditions strengthens.
Institutions allocate capital based on:
• Risk-adjusted returns
• Yield differentials
• Portfolio hedging
• Liquidity access
They don’t trade memes.
They trade conditions.
That means Bitcoin now behaves more like a macro asset than a speculative experiment.
Liquidity Shapes the Entire Crypto Cycle
The pattern tends to follow a rhythm:
1. Liquidity expands
2. Bitcoin moves first
3. Confidence builds
4. Capital rotates into altcoins
5. Broader expansion follows
Then the reverse:
1. Liquidity tightens
2. Bitcoin weakens
3. Altcoins underperform
4. Risk collapses
Understanding this rhythm is more powerful than memorizing chart patterns.
Why This Matters Now
Markets often feel chaotic in the short term.
But beneath volatility, liquidity conditions set the boundaries of what’s possible.
When liquidity is abundant, rallies extend.
When liquidity is constrained, rallies fade.
This doesn’t mean liquidity predicts exact tops or bottoms.
It defines probability zones.
The Real Edge
Most participants chase momentum.
Fewer monitor monetary conditions.
The difference?
One reacts to price.
The other anticipates the environment.
#BTC may appear unpredictable day to day. But across cycles, its largest moves align remarkably well with global liquidity waves.
Narratives matter.
Technology matters.
Adoption matters.
But liquidity determines whether those narratives ignite — or suffocate.
Follow the flow of capital, not just the candles.
That’s the indicator smart money quietly watches every cycle.
