
BlackCat Analysis
863 Публикации

BlackCat Analysis
 Square Verified+
Отправить жалобу
Заблокировать пользователя
Trader || X (Twitter): @BlackCatTrader7 |I Binance KOL II Trad e Setups are my Personal Opinions I| DYOR
Трейдер с регулярными сделками
1.9 г
34 подписок(и/а)
36.8K+ подписчиков(а)
67.6K+ понравилось
Посты
PINNED
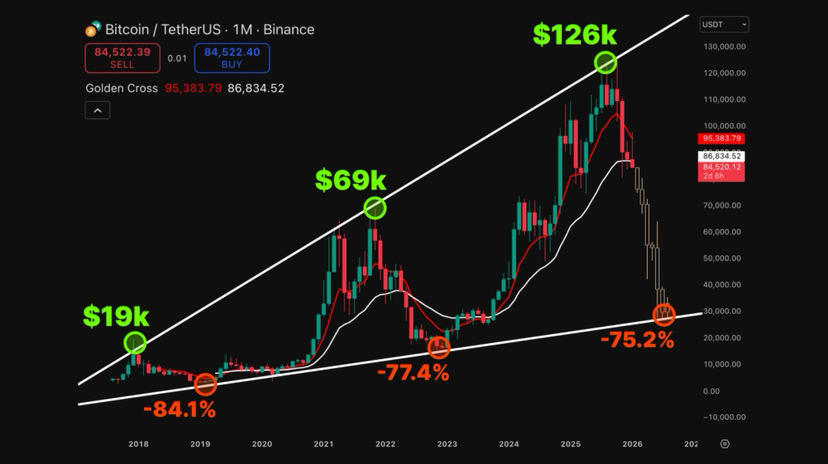
Статья
BTC At A Tipping Point? Alt Rotation Brewing Beneath The SurfaceBitcoin dominance is stretched.
Sentiment around alts is exhausted.
Capital concentration in $BTC has been extreme.
Positioning is one-sided.
And historically, that’s when rotation begins — not when confidence is high, but when fear peaks.
Why $BTC Matters
When dominance rises aggressively, liquidity flows into Bitcoin first.
It’s the defensive phase. The capital preservation phase.
But once that move matures and momentum slows, something shifts:
• BTC stabilizes
• Volatility compresses
• Relative strength starts appearing in select alts
• Capital quietly rotates
A sustained $BTC drop isn’t noise.
It’s liquidity redistribution.
Fear Is Usually Early
Right now, alt sentiment is fragile.
Underperformance has drained conviction.
Retail interest is muted.
That’s not how tops form.
Major alt expansions historically began during periods of disbelief — not hype.
2017 and 2021 both followed prolonged dominance strength before rotation accelerated.
The Important Detail
A dominance drop alone isn’t enough.
For a real alt expansion phase, you need:
• BTC stability (not collapse)
• Expanding liquidity
• Momentum shift on higher timeframes
• Selective strength before broad participation
If those align, the move can be fast.
The Strategic Window
Accumulation phases feel boring.
Rotation phases feel obvious — but by then, risk-reward shrinks.
The opportunity is usually in the transition.
If $BTC rolls over structurally, the next 60–90 days could look very different from the last six months.
Watch structure.
Watch liquidity.
Watch reaction — not emotion.
$BTC #Bitcoin #Crypto
{future}(BTCUSDT)
BTC At A Tipping Point? Alt Rotation Brewing Beneath The Surface
Bitcoin dominance is stretched.
Sentiment around alts is exhausted.
Capital concentration in $BTC has been extreme.
Positioning is one-sided.
And historically, that’s when rotation begins — not when confidence is high, but when fear peaks.
Why $BTC Matters
When dominance rises aggressively, liquidity flows into Bitcoin first.
It’s the defensive phase. The capital preservation phase.
But once that move matures and momentum slows, something shifts:
• BTC stabilizes
• Volatility compresses
• Relative strength starts appearing in select alts
• Capital quietly rotates
A sustained $BTC drop isn’t noise.
It’s liquidity redistribution.
Fear Is Usually Early
Right now, alt sentiment is fragile.
Underperformance has drained conviction.
Retail interest is muted.
That’s not how tops form.
Major alt expansions historically began during periods of disbelief — not hype.
2017 and 2021 both followed prolonged dominance strength before rotation accelerated.
The Important Detail
A dominance drop alone isn’t enough.
For a real alt expansion phase, you need:
• BTC stability (not collapse)
• Expanding liquidity
• Momentum shift on higher timeframes
• Selective strength before broad participation
If those align, the move can be fast.
The Strategic Window
Accumulation phases feel boring.
Rotation phases feel obvious — but by then, risk-reward shrinks.
The opportunity is usually in the transition.
If $BTC rolls over structurally, the next 60–90 days could look very different from the last six months.
Watch structure.
Watch liquidity.
Watch reaction — not emotion.
$BTC #Bitcoin #Crypto
Sentiment around alts is exhausted.
Capital concentration in $BTC has been extreme.
Positioning is one-sided.
And historically, that’s when rotation begins — not when confidence is high, but when fear peaks.
Why $BTC Matters
When dominance rises aggressively, liquidity flows into Bitcoin first.
It’s the defensive phase. The capital preservation phase.
But once that move matures and momentum slows, something shifts:
• BTC stabilizes
• Volatility compresses
• Relative strength starts appearing in select alts
• Capital quietly rotates
A sustained $BTC drop isn’t noise.
It’s liquidity redistribution.
Fear Is Usually Early
Right now, alt sentiment is fragile.
Underperformance has drained conviction.
Retail interest is muted.
That’s not how tops form.
Major alt expansions historically began during periods of disbelief — not hype.
2017 and 2021 both followed prolonged dominance strength before rotation accelerated.
The Important Detail
A dominance drop alone isn’t enough.
For a real alt expansion phase, you need:
• BTC stability (not collapse)
• Expanding liquidity
• Momentum shift on higher timeframes
• Selective strength before broad participation
If those align, the move can be fast.
The Strategic Window
Accumulation phases feel boring.
Rotation phases feel obvious — but by then, risk-reward shrinks.
The opportunity is usually in the transition.
If $BTC rolls over structurally, the next 60–90 days could look very different from the last six months.
Watch structure.
Watch liquidity.
Watch reaction — not emotion.
$BTC #Bitcoin #Crypto
45
19
123
135.7k
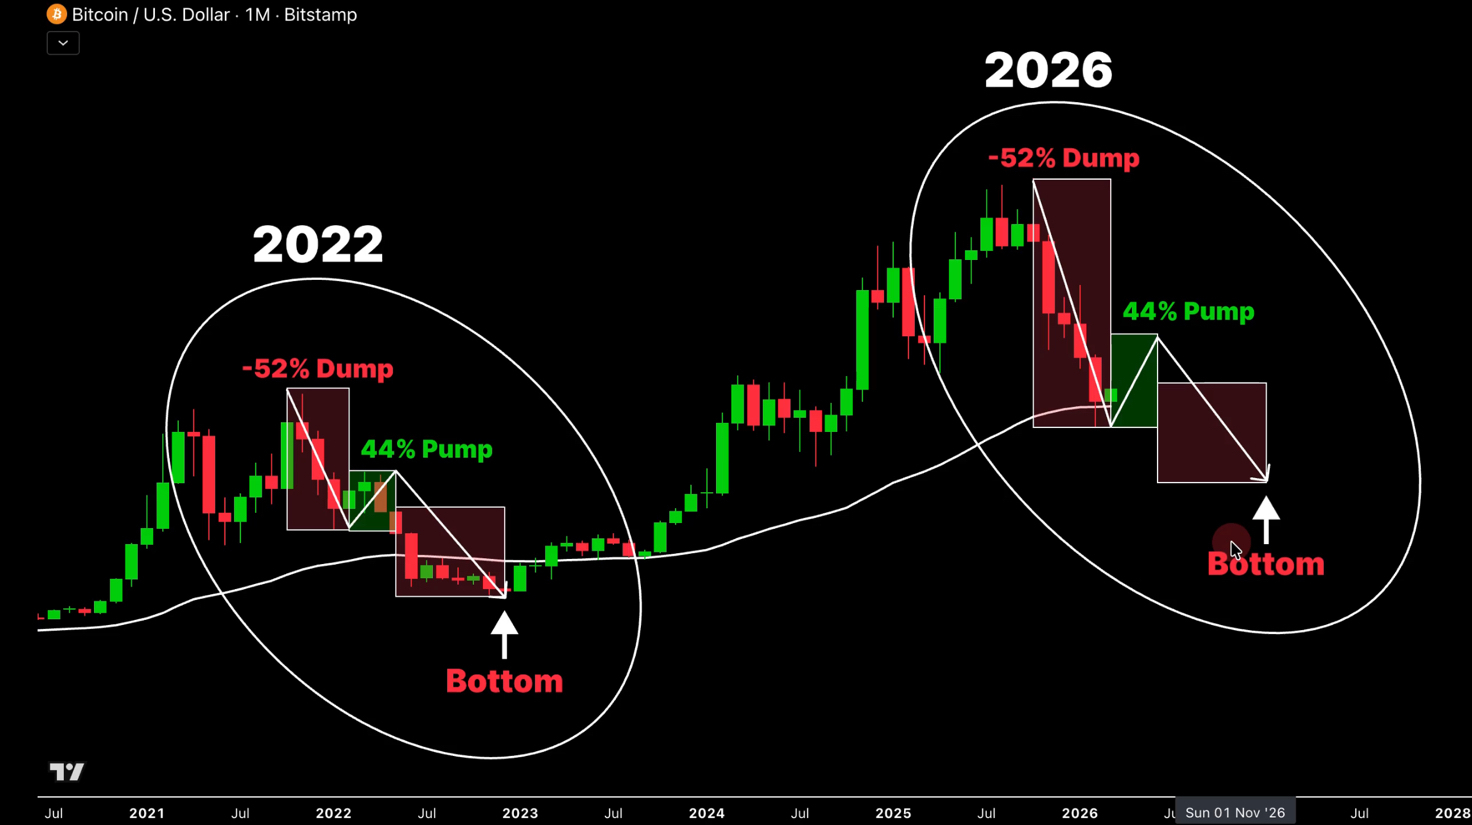
Статья
$BTC May Be Entering Wave 3 — The Most Violent Move Usually Comes Next.$BTC is beginning to show a structure that suggests the market may be transitioning into a more sensitive phase.
From a wave perspective, the recent movement resembles the completion of a wave 2 correction, which unfolded in a relatively clear zigzag pattern. If this interpretation continues to hold, the market could be approaching the start of wave 3, a phase that historically tends to produce the strongest and fastest movements in the direction of the main trend.
Structurally, wave 3 phases often coincide with expanding volatility and increasing pressure on market sentiment. Once momentum accelerates, the market can move quickly toward the next major liquidity zones.
In the current context, the 58,000–55,000 USD region becomes a key area to monitor. This zone stands out not only as a technical support region but also as a potential liquidity pocket where the market could test the strength of buyers. If selling momentum begins to accelerate, price could move toward this region relatively quickly as the market searches for deeper demand.
Liquidity dynamics also play an important role here. If Bitcoin were to approach this area with strong downside momentum, many positions that entered during the recent rebound could be forced to close. That kind of forced unwinding often amplifies volatility and can push the market into a short-term panic phase.
Psychologically, this is where the market often becomes most unstable. Traders expecting a continuation of the recovery may suddenly find themselves on the wrong side of the move, which can further accelerate selling pressure.
However, the scenario has a clear invalidation level. If price manages to reclaim and hold above 74,000 USD, the current wave structure would lose its reliability. A move above that level would suggest that the market is regaining strength rather than entering a deeper corrective phase.
For now, the key factor remains whether selling pressure continues to build. Markets at this stage can move very quickly, and shifts in structure can change the short-term outlook almost immediately.
$BTC #Bitcoin #Crypto
{future}(BTCUSDT)
$BTC May Be Entering Wave 3 — The Most Violent Move Usually Comes Next.
$BTC is beginning to show a structure that suggests the market may be transitioning into a more sensitive phase.
From a wave perspective, the recent movement resembles the completion of a wave 2 correction, which unfolded in a relatively clear zigzag pattern. If this interpretation continues to hold, the market could be approaching the start of wave 3, a phase that historically tends to produce the strongest and fastest movements in the direction of the main trend.
Structurally, wave 3 phases often coincide with expanding volatility and increasing pressure on market sentiment. Once momentum accelerates, the market can move quickly toward the next major liquidity zones.
In the current context, the 58,000–55,000 USD region becomes a key area to monitor. This zone stands out not only as a technical support region but also as a potential liquidity pocket where the market could test the strength of buyers. If selling momentum begins to accelerate, price could move toward this region relatively quickly as the market searches for deeper demand.
Liquidity dynamics also play an important role here. If Bitcoin were to approach this area with strong downside momentum, many positions that entered during the recent rebound could be forced to close. That kind of forced unwinding often amplifies volatility and can push the market into a short-term panic phase.
Psychologically, this is where the market often becomes most unstable. Traders expecting a continuation of the recovery may suddenly find themselves on the wrong side of the move, which can further accelerate selling pressure.
However, the scenario has a clear invalidation level. If price manages to reclaim and hold above 74,000 USD, the current wave structure would lose its reliability. A move above that level would suggest that the market is regaining strength rather than entering a deeper corrective phase.
For now, the key factor remains whether selling pressure continues to build. Markets at this stage can move very quickly, and shifts in structure can change the short-term outlook almost immediately.
$BTC #Bitcoin #Crypto
From a wave perspective, the recent movement resembles the completion of a wave 2 correction, which unfolded in a relatively clear zigzag pattern. If this interpretation continues to hold, the market could be approaching the start of wave 3, a phase that historically tends to produce the strongest and fastest movements in the direction of the main trend.
Structurally, wave 3 phases often coincide with expanding volatility and increasing pressure on market sentiment. Once momentum accelerates, the market can move quickly toward the next major liquidity zones.
In the current context, the 58,000–55,000 USD region becomes a key area to monitor. This zone stands out not only as a technical support region but also as a potential liquidity pocket where the market could test the strength of buyers. If selling momentum begins to accelerate, price could move toward this region relatively quickly as the market searches for deeper demand.
Liquidity dynamics also play an important role here. If Bitcoin were to approach this area with strong downside momentum, many positions that entered during the recent rebound could be forced to close. That kind of forced unwinding often amplifies volatility and can push the market into a short-term panic phase.
Psychologically, this is where the market often becomes most unstable. Traders expecting a continuation of the recovery may suddenly find themselves on the wrong side of the move, which can further accelerate selling pressure.
However, the scenario has a clear invalidation level. If price manages to reclaim and hold above 74,000 USD, the current wave structure would lose its reliability. A move above that level would suggest that the market is regaining strength rather than entering a deeper corrective phase.
For now, the key factor remains whether selling pressure continues to build. Markets at this stage can move very quickly, and shifts in structure can change the short-term outlook almost immediately.
$BTC #Bitcoin #Crypto
14
1
138
83.5k
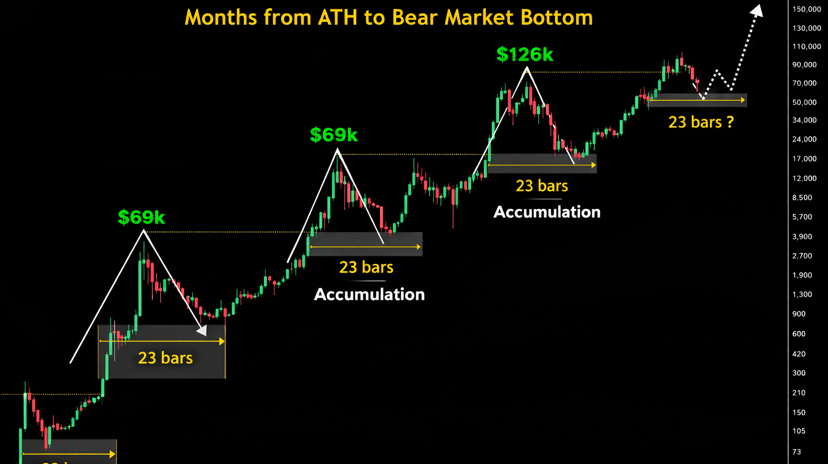
Статья
Bitcoin vs Altcoins: Early Rotation or Beginning of Expansion?While $BTC continues navigating macro pressure and uneven liquidity conditions, parts of the altcoin market are beginning to show a different behavior.
After nearly four years of prolonged correction and consolidation, several altcoins are quietly transitioning away from pure downtrend structure. The shift isn’t obvious through headlines or narratives — it’s showing up directly in price action.
What stands out is structural change.
Higher lows are beginning to form.
Trading ranges are expanding instead of compressing.
Former resistance zones are gradually being absorbed rather than rejected.
These are often early characteristics seen when markets move from accumulation into the first stages of expansion.
Interestingly, this rotation is happening while broader attention remains fixed on Bitcoin’s uncertainty. When the majority of participants are still focused on whether $BTC might weaken further, speculative capital sometimes begins exploring higher-beta assets earlier in the cycle.
That doesn’t automatically confirm a full altseason.
Early rotations can fail if liquidity doesn’t follow through. Sustainable growth usually requires improving participation, expanding volume, and consistent capital inflow — not just isolated price strength.
For now, the environment appears selective rather than euphoric.
This phase tends to reward patience and asset selection more than aggressive chasing. Markets often build new foundations quietly before wider recognition arrives.
If liquidity continues strengthening alongside improving structure, the current transition could evolve into a broader growth phase — one that typically becomes obvious only after much of the initial move has already unfolded.
$BTC #Bitcoin #Crypto
{future}(BTCUSDT)
Bitcoin vs Altcoins: Early Rotation or Beginning of Expansion?
While $BTC continues navigating macro pressure and uneven liquidity conditions, parts of the altcoin market are beginning to show a different behavior.
After nearly four years of prolonged correction and consolidation, several altcoins are quietly transitioning away from pure downtrend structure. The shift isn’t obvious through headlines or narratives — it’s showing up directly in price action.
What stands out is structural change.
Higher lows are beginning to form.
Trading ranges are expanding instead of compressing.
Former resistance zones are gradually being absorbed rather than rejected.
These are often early characteristics seen when markets move from accumulation into the first stages of expansion.
Interestingly, this rotation is happening while broader attention remains fixed on Bitcoin’s uncertainty. When the majority of participants are still focused on whether $BTC might weaken further, speculative capital sometimes begins exploring higher-beta assets earlier in the cycle.
That doesn’t automatically confirm a full altseason.
Early rotations can fail if liquidity doesn’t follow through. Sustainable growth usually requires improving participation, expanding volume, and consistent capital inflow — not just isolated price strength.
For now, the environment appears selective rather than euphoric.
This phase tends to reward patience and asset selection more than aggressive chasing. Markets often build new foundations quietly before wider recognition arrives.
If liquidity continues strengthening alongside improving structure, the current transition could evolve into a broader growth phase — one that typically becomes obvious only after much of the initial move has already unfolded.
$BTC #Bitcoin #Crypto
After nearly four years of prolonged correction and consolidation, several altcoins are quietly transitioning away from pure downtrend structure. The shift isn’t obvious through headlines or narratives — it’s showing up directly in price action.
What stands out is structural change.
Higher lows are beginning to form.
Trading ranges are expanding instead of compressing.
Former resistance zones are gradually being absorbed rather than rejected.
These are often early characteristics seen when markets move from accumulation into the first stages of expansion.
Interestingly, this rotation is happening while broader attention remains fixed on Bitcoin’s uncertainty. When the majority of participants are still focused on whether $BTC might weaken further, speculative capital sometimes begins exploring higher-beta assets earlier in the cycle.
That doesn’t automatically confirm a full altseason.
Early rotations can fail if liquidity doesn’t follow through. Sustainable growth usually requires improving participation, expanding volume, and consistent capital inflow — not just isolated price strength.
For now, the environment appears selective rather than euphoric.
This phase tends to reward patience and asset selection more than aggressive chasing. Markets often build new foundations quietly before wider recognition arrives.
If liquidity continues strengthening alongside improving structure, the current transition could evolve into a broader growth phase — one that typically becomes obvious only after much of the initial move has already unfolded.
$BTC #Bitcoin #Crypto
9
7
88
85.6k
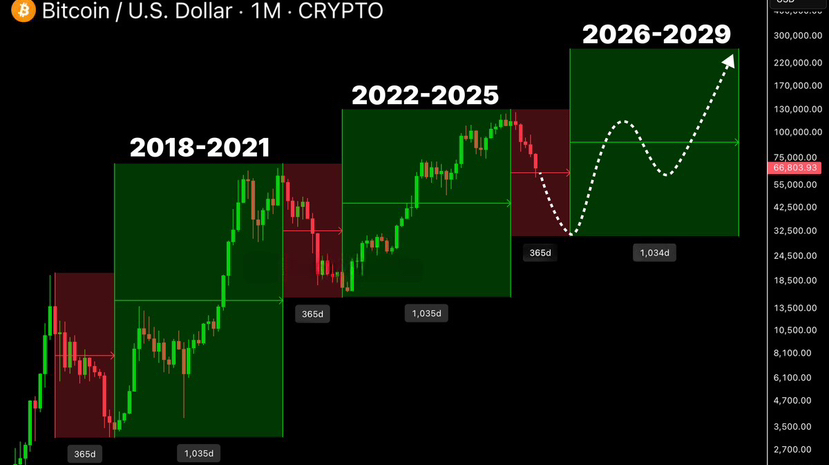
Статья
Bitcoin Cycle Mechanics: Compression Before Expansion?There’s a recurring rhythm in $BTC that many overlook:
Roughly 1 year of contraction → followed by ~3 years of expansion.
Not perfectly timed.
Not mechanically identical.
But structurally consistent.
How the cycle typically unfolds:
Phase 1 – Cleanup
Price declines. Excess leverage clears. Weak positioning exits.
Volatility compresses near the bottom as liquidity stabilizes.
Phase 2 – Base Formation
Sideways structure. Sentiment remains skeptical.
Accumulation happens quietly while narratives stay muted.
Phase 3 – Expansion
Momentum returns. Higher highs form.
Liquidity expands alongside participation.
New all-time highs develop only after structure confirms.
Now look at the present context.
We’ve already seen a correction phase that reset leverage and sentiment. The question is whether this compression is transitioning into a growth-loading phase — or whether more structural rebuilding is required.
For a true growth phase to begin, $BTC needs:
• Clear higher lows on higher timeframes
• Resistance zones reclaimed with follow-through
• Expanding volume, not thinning liquidity
• Reduced volatility on pullbacks
Cycles are not about predicting the exact week of reversal.
They’re about recognizing phase shifts.
If the contraction has largely completed, the market will start showing it through structure first — not headlines.
Correction phases exhaust participants.
Growth phases reward patience.
Right now, the chart is closer to transition than collapse.
But confirmation always comes from price behavior, not from cycle theory alone.
#BTC #Bitcoin #Crypto
{future}(BTCUSDT)
Bitcoin Cycle Mechanics: Compression Before Expansion?
There’s a recurring rhythm in $BTC that many overlook:
Roughly 1 year of contraction → followed by ~3 years of expansion.
Not perfectly timed.
Not mechanically identical.
But structurally consistent.
How the cycle typically unfolds:
Phase 1 – Cleanup
Price declines. Excess leverage clears. Weak positioning exits.
Volatility compresses near the bottom as liquidity stabilizes.
Phase 2 – Base Formation
Sideways structure. Sentiment remains skeptical.
Accumulation happens quietly while narratives stay muted.
Phase 3 – Expansion
Momentum returns. Higher highs form.
Liquidity expands alongside participation.
New all-time highs develop only after structure confirms.
Now look at the present context.
We’ve already seen a correction phase that reset leverage and sentiment. The question is whether this compression is transitioning into a growth-loading phase — or whether more structural rebuilding is required.
For a true growth phase to begin, $BTC needs:
• Clear higher lows on higher timeframes
• Resistance zones reclaimed with follow-through
• Expanding volume, not thinning liquidity
• Reduced volatility on pullbacks
Cycles are not about predicting the exact week of reversal.
They’re about recognizing phase shifts.
If the contraction has largely completed, the market will start showing it through structure first — not headlines.
Correction phases exhaust participants.
Growth phases reward patience.
Right now, the chart is closer to transition than collapse.
But confirmation always comes from price behavior, not from cycle theory alone.
#BTC #Bitcoin #Crypto
Roughly 1 year of contraction → followed by ~3 years of expansion.
Not perfectly timed.
Not mechanically identical.
But structurally consistent.
How the cycle typically unfolds:
Phase 1 – Cleanup
Price declines. Excess leverage clears. Weak positioning exits.
Volatility compresses near the bottom as liquidity stabilizes.
Phase 2 – Base Formation
Sideways structure. Sentiment remains skeptical.
Accumulation happens quietly while narratives stay muted.
Phase 3 – Expansion
Momentum returns. Higher highs form.
Liquidity expands alongside participation.
New all-time highs develop only after structure confirms.
Now look at the present context.
We’ve already seen a correction phase that reset leverage and sentiment. The question is whether this compression is transitioning into a growth-loading phase — or whether more structural rebuilding is required.
For a true growth phase to begin, $BTC needs:
• Clear higher lows on higher timeframes
• Resistance zones reclaimed with follow-through
• Expanding volume, not thinning liquidity
• Reduced volatility on pullbacks
Cycles are not about predicting the exact week of reversal.
They’re about recognizing phase shifts.
If the contraction has largely completed, the market will start showing it through structure first — not headlines.
Correction phases exhaust participants.
Growth phases reward patience.
Right now, the chart is closer to transition than collapse.
But confirmation always comes from price behavior, not from cycle theory alone.
#BTC #Bitcoin #Crypto
12
6
73
69.1k
Статья
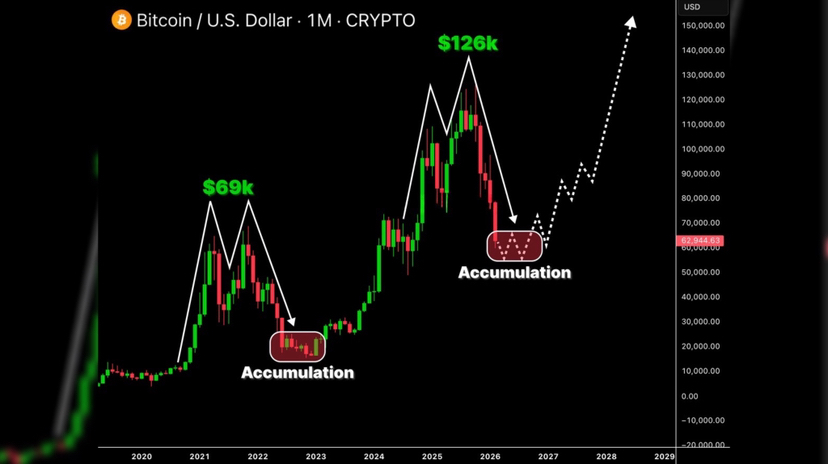
Bitcoin: Is the 2019–2022 Structure Repeating?There’s a growing narrative that $BTC is mirroring the 2019–2022 cycle almost step by step.
The sequence looks familiar:
Double top → sharp correction → extended accumulation → expansion phase.
On higher timeframes, the structural resemblance is noticeable. After a euphoric peak, price retraces aggressively, volatility compresses, and the market shifts into a prolonged sideways range where both bulls and bears lose conviction. That’s typically where long-term positioning quietly rebuilds.
But similarity is not certainty.
In 2019, the accumulation phase formed after liquidity was fully flushed and volatility contracted significantly. The breakout only happened once structure shifted — higher lows, resistance reclaim, sustained volume expansion.
If the pattern truly repeats, the current phase would represent late-stage consolidation rather than early-stage collapse.
However, there are a few conditions to monitor before concluding we are “closer to the bottom”:
• Is selling pressure decreasing on each push lower?
• Are higher timeframe lows holding consistently?
• Is liquidity being absorbed instead of aggressively rejected?
• Is volatility compressing instead of expanding?
Accumulation is not about blindly buying weakness. It’s about recognizing when downside momentum fades and structure stabilizes.
If this is indeed a historical rhyme, positioning during consolidation — not during breakout euphoria — tends to offer the best asymmetric opportunity.
But confirmation always comes from structure, not from pattern comparison alone.
Markets can echo the past.
They don’t copy it perfectly.
If you’re building positions, do it with structure awareness — not just historical optimism.
$BTC #Bitcoin #Crypto
{future}(BTCUSDT)
Bitcoin: Is the 2019–2022 Structure Repeating?
There’s a growing narrative that $BTC is mirroring the 2019–2022 cycle almost step by step.
The sequence looks familiar:
Double top → sharp correction → extended accumulation → expansion phase.
On higher timeframes, the structural resemblance is noticeable. After a euphoric peak, price retraces aggressively, volatility compresses, and the market shifts into a prolonged sideways range where both bulls and bears lose conviction. That’s typically where long-term positioning quietly rebuilds.
But similarity is not certainty.
In 2019, the accumulation phase formed after liquidity was fully flushed and volatility contracted significantly. The breakout only happened once structure shifted — higher lows, resistance reclaim, sustained volume expansion.
If the pattern truly repeats, the current phase would represent late-stage consolidation rather than early-stage collapse.
However, there are a few conditions to monitor before concluding we are “closer to the bottom”:
• Is selling pressure decreasing on each push lower?
• Are higher timeframe lows holding consistently?
• Is liquidity being absorbed instead of aggressively rejected?
• Is volatility compressing instead of expanding?
Accumulation is not about blindly buying weakness. It’s about recognizing when downside momentum fades and structure stabilizes.
If this is indeed a historical rhyme, positioning during consolidation — not during breakout euphoria — tends to offer the best asymmetric opportunity.
But confirmation always comes from structure, not from pattern comparison alone.
Markets can echo the past.
They don’t copy it perfectly.
If you’re building positions, do it with structure awareness — not just historical optimism.
$BTC #Bitcoin #Crypto
The sequence looks familiar:
Double top → sharp correction → extended accumulation → expansion phase.
On higher timeframes, the structural resemblance is noticeable. After a euphoric peak, price retraces aggressively, volatility compresses, and the market shifts into a prolonged sideways range where both bulls and bears lose conviction. That’s typically where long-term positioning quietly rebuilds.
But similarity is not certainty.
In 2019, the accumulation phase formed after liquidity was fully flushed and volatility contracted significantly. The breakout only happened once structure shifted — higher lows, resistance reclaim, sustained volume expansion.
If the pattern truly repeats, the current phase would represent late-stage consolidation rather than early-stage collapse.
However, there are a few conditions to monitor before concluding we are “closer to the bottom”:
• Is selling pressure decreasing on each push lower?
• Are higher timeframe lows holding consistently?
• Is liquidity being absorbed instead of aggressively rejected?
• Is volatility compressing instead of expanding?
Accumulation is not about blindly buying weakness. It’s about recognizing when downside momentum fades and structure stabilizes.
If this is indeed a historical rhyme, positioning during consolidation — not during breakout euphoria — tends to offer the best asymmetric opportunity.
But confirmation always comes from structure, not from pattern comparison alone.
Markets can echo the past.
They don’t copy it perfectly.
If you’re building positions, do it with structure awareness — not just historical optimism.
$BTC #Bitcoin #Crypto
8
6
90
109k
Статья
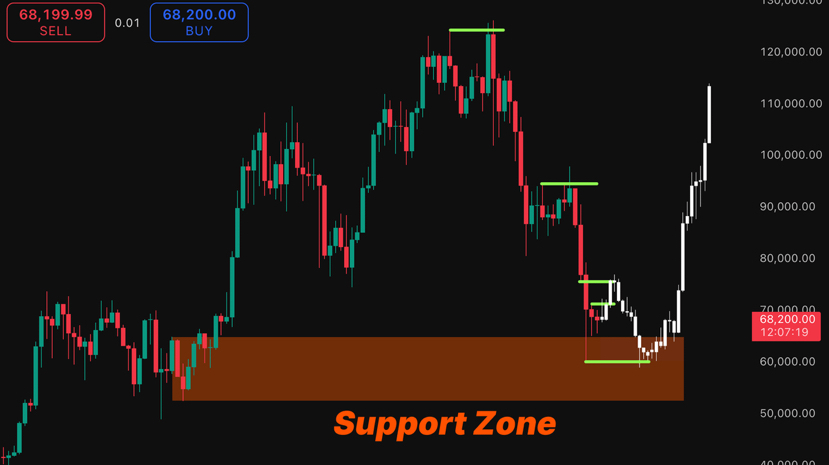
BTC Range Update — The Tape Already SpokeThis is what a real post-capitulation range looks like.
The drop to $60K wasn’t random volatility.
It was a selling climax.
Forced liquidations. Panic exits. Peak supply.
That low defines the floor.
The bounce to $72K wasn’t strength returning.
It was a reaction rally.
Short covering. Relief. Mechanical mean reversion.
That high defines the ceiling.
Now you have the battlefield:
$60K–$72K.
And this is where most traders get it wrong.
A Range Isn’t Noise — It’s A Process
After a heavy selloff, the range isn’t sideways chaos.
It’s a negotiation.
It answers one question:
Who is quietly gaining control?
If buyers are absorbing supply:
• Volume contracts over time
• Pullbacks get shallower
• Down candles shrink
• Upside expansions widen
That’s accumulation.
If sellers remain dominant:
• Volume stays elevated
• Drops expand aggressively
• Bounces overlap and stall
• Lower highs form inside the box
That’s distribution.
What The Structure Actually Shows
Look closely at how this range matured.
Volume never meaningfully cooled.
Upside attempts lacked follow-through.
Down candles consistently expanded wider than the up legs.
Sellers pressed for two consecutive weeks.
That’s not neutral tape.
That’s pressure.
The climax and the reaction rally only set the boundaries.
The real information comes from behavior inside the box.
And the behavior hasn’t been buyer-controlled.
Why Most Traders Misread It
People see chop and assume equilibrium.
But ranges after heavy selloffs often resolve in the direction of internal pressure.
If sellers dominate inside the range, the eventual break usually comes lower.
Not because of drama.
Because of exhaustion.
The Key Takeaway
$60K–$72K is not random consolidation.
It’s a structural decision zone.
The tape has been leaning one direction.
Most see sideways.
The market is actually revealing intent.
$BTC #Bitcoin #Crypto
{future}(BTCUSDT)
BTC Range Update — The Tape Already Spoke
This is what a real post-capitulation range looks like.
The drop to $60K wasn’t random volatility.
It was a selling climax.
Forced liquidations. Panic exits. Peak supply.
That low defines the floor.
The bounce to $72K wasn’t strength returning.
It was a reaction rally.
Short covering. Relief. Mechanical mean reversion.
That high defines the ceiling.
Now you have the battlefield:
$60K–$72K.
And this is where most traders get it wrong.
A Range Isn’t Noise — It’s A Process
After a heavy selloff, the range isn’t sideways chaos.
It’s a negotiation.
It answers one question:
Who is quietly gaining control?
If buyers are absorbing supply:
• Volume contracts over time
• Pullbacks get shallower
• Down candles shrink
• Upside expansions widen
That’s accumulation.
If sellers remain dominant:
• Volume stays elevated
• Drops expand aggressively
• Bounces overlap and stall
• Lower highs form inside the box
That’s distribution.
What The Structure Actually Shows
Look closely at how this range matured.
Volume never meaningfully cooled.
Upside attempts lacked follow-through.
Down candles consistently expanded wider than the up legs.
Sellers pressed for two consecutive weeks.
That’s not neutral tape.
That’s pressure.
The climax and the reaction rally only set the boundaries.
The real information comes from behavior inside the box.
And the behavior hasn’t been buyer-controlled.
Why Most Traders Misread It
People see chop and assume equilibrium.
But ranges after heavy selloffs often resolve in the direction of internal pressure.
If sellers dominate inside the range, the eventual break usually comes lower.
Not because of drama.
Because of exhaustion.
The Key Takeaway
$60K–$72K is not random consolidation.
It’s a structural decision zone.
The tape has been leaning one direction.
Most see sideways.
The market is actually revealing intent.
$BTC #Bitcoin #Crypto
The drop to $60K wasn’t random volatility.
It was a selling climax.
Forced liquidations. Panic exits. Peak supply.
That low defines the floor.
The bounce to $72K wasn’t strength returning.
It was a reaction rally.
Short covering. Relief. Mechanical mean reversion.
That high defines the ceiling.
Now you have the battlefield:
$60K–$72K.
And this is where most traders get it wrong.
A Range Isn’t Noise — It’s A Process
After a heavy selloff, the range isn’t sideways chaos.
It’s a negotiation.
It answers one question:
Who is quietly gaining control?
If buyers are absorbing supply:
• Volume contracts over time
• Pullbacks get shallower
• Down candles shrink
• Upside expansions widen
That’s accumulation.
If sellers remain dominant:
• Volume stays elevated
• Drops expand aggressively
• Bounces overlap and stall
• Lower highs form inside the box
That’s distribution.
What The Structure Actually Shows
Look closely at how this range matured.
Volume never meaningfully cooled.
Upside attempts lacked follow-through.
Down candles consistently expanded wider than the up legs.
Sellers pressed for two consecutive weeks.
That’s not neutral tape.
That’s pressure.
The climax and the reaction rally only set the boundaries.
The real information comes from behavior inside the box.
And the behavior hasn’t been buyer-controlled.
Why Most Traders Misread It
People see chop and assume equilibrium.
But ranges after heavy selloffs often resolve in the direction of internal pressure.
If sellers dominate inside the range, the eventual break usually comes lower.
Not because of drama.
Because of exhaustion.
The Key Takeaway
$60K–$72K is not random consolidation.
It’s a structural decision zone.
The tape has been leaning one direction.
Most see sideways.
The market is actually revealing intent.
$BTC #Bitcoin #Crypto
3
1
37
22.9k
Статья
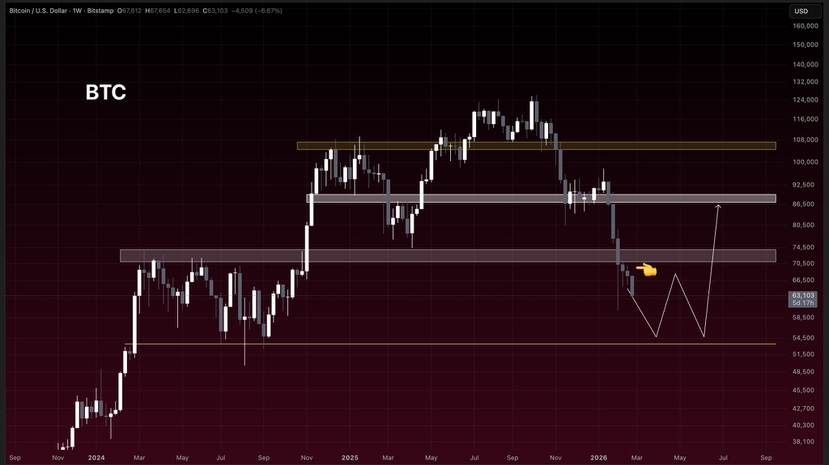
BTC Lost $70K — And That Changes The StructureFor nearly a year, the $70K–$71K weekly band acted as a structural shelf.
Support.
Acceptance.
Confidence.
Now it’s gone.
And this isn’t about intraday wicks — we’re talking about weekly closes below the level. That’s a structural shift, not noise.
When a level holds that long and then breaks, pretending nothing changed is dangerous.
Why $70K Mattered
That zone wasn’t just psychological.
It represented:
• Prior breakout acceptance
• High-volume consolidation
• Institutional cost clusters
• Trend continuation support
Once price loses a level like that and starts closing below it, it flips from support → resistance.
That grey shelf now caps upside until reclaimed.
The Downside Map
As long as $BTC remains below that weekly band:
➜ $60K becomes the first liquidity magnet
➜ $53K (yellow zone) becomes the deeper structural test
Those aren’t dramatic predictions — they’re logical liquidity pools below the breakdown.
Markets move toward inefficiencies.
Right now, liquidity sits lower.
What Flips The Script
The invalidation is simple:
Reclaim $70.8K
Close ABOVE it on a weekly basis
Hold it — not spike it
If that happens, the breakdown becomes a shakeout.
Structure would rotate back toward:
• Mid-$70Ks
• Possibly $80Ks
But until that reclaim happens, the burden of proof stays with bulls.
This Isn’t Emotional — It’s Structural
Every breakdown thesis needs an invalidation.
Here it is.
Below $70K weekly = defensive posture
Above $70.8K weekly hold = structural recovery
No guessing. No bias.
Just levels.
Right now, price is trading beneath a level that defined the market for a year.
That’s not something to ignore.
It’s something to respect.
$BTC #Bitcoin #Crypto
{future}(BTCUSDT)
BTC Lost $70K — And That Changes The Structure
For nearly a year, the $70K–$71K weekly band acted as a structural shelf.
Support.
Acceptance.
Confidence.
Now it’s gone.
And this isn’t about intraday wicks — we’re talking about weekly closes below the level. That’s a structural shift, not noise.
When a level holds that long and then breaks, pretending nothing changed is dangerous.
Why $70K Mattered
That zone wasn’t just psychological.
It represented:
• Prior breakout acceptance
• High-volume consolidation
• Institutional cost clusters
• Trend continuation support
Once price loses a level like that and starts closing below it, it flips from support → resistance.
That grey shelf now caps upside until reclaimed.
The Downside Map
As long as $BTC remains below that weekly band:
➜ $60K becomes the first liquidity magnet
➜ $53K (yellow zone) becomes the deeper structural test
Those aren’t dramatic predictions — they’re logical liquidity pools below the breakdown.
Markets move toward inefficiencies.
Right now, liquidity sits lower.
What Flips The Script
The invalidation is simple:
Reclaim $70.8K
Close ABOVE it on a weekly basis
Hold it — not spike it
If that happens, the breakdown becomes a shakeout.
Structure would rotate back toward:
• Mid-$70Ks
• Possibly $80Ks
But until that reclaim happens, the burden of proof stays with bulls.
This Isn’t Emotional — It’s Structural
Every breakdown thesis needs an invalidation.
Here it is.
Below $70K weekly = defensive posture
Above $70.8K weekly hold = structural recovery
No guessing. No bias.
Just levels.
Right now, price is trading beneath a level that defined the market for a year.
That’s not something to ignore.
It’s something to respect.
$BTC #Bitcoin #Crypto
Support.
Acceptance.
Confidence.
Now it’s gone.
And this isn’t about intraday wicks — we’re talking about weekly closes below the level. That’s a structural shift, not noise.
When a level holds that long and then breaks, pretending nothing changed is dangerous.
Why $70K Mattered
That zone wasn’t just psychological.
It represented:
• Prior breakout acceptance
• High-volume consolidation
• Institutional cost clusters
• Trend continuation support
Once price loses a level like that and starts closing below it, it flips from support → resistance.
That grey shelf now caps upside until reclaimed.
The Downside Map
As long as $BTC remains below that weekly band:
➜ $60K becomes the first liquidity magnet
➜ $53K (yellow zone) becomes the deeper structural test
Those aren’t dramatic predictions — they’re logical liquidity pools below the breakdown.
Markets move toward inefficiencies.
Right now, liquidity sits lower.
What Flips The Script
The invalidation is simple:
Reclaim $70.8K
Close ABOVE it on a weekly basis
Hold it — not spike it
If that happens, the breakdown becomes a shakeout.
Structure would rotate back toward:
• Mid-$70Ks
• Possibly $80Ks
But until that reclaim happens, the burden of proof stays with bulls.
This Isn’t Emotional — It’s Structural
Every breakdown thesis needs an invalidation.
Here it is.
Below $70K weekly = defensive posture
Above $70.8K weekly hold = structural recovery
No guessing. No bias.
Just levels.
Right now, price is trading beneath a level that defined the market for a year.
That’s not something to ignore.
It’s something to respect.
$BTC #Bitcoin #Crypto
15
7
27
20.7k
Статья
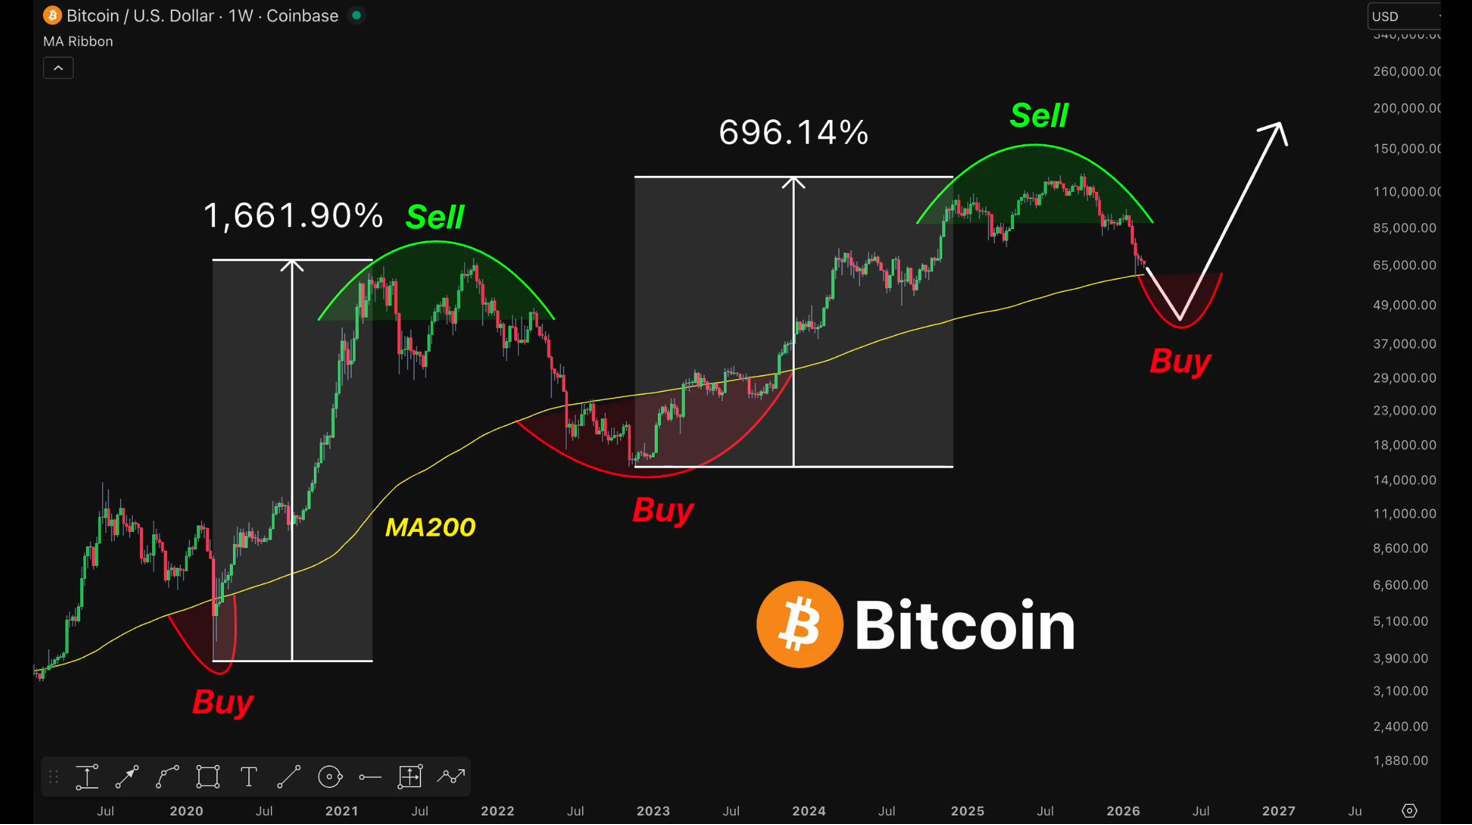
Why I Think BTC This Crypto Bull Cycle Has Already BegunFor months, the market felt exhausted.
Every bounce was sold.
Every breakout failed.
Confidence was thin.
But recently, the tone has shifted — not dramatically, not euphorically — just subtly and structurally. And that kind of shift is often how real bull cycles begin.
This doesn’t look like hype.
It looks like transition.
1. Structure Is Quietly Improving
In every major cycle, the change happens before the headlines catch up.
First, the lower lows stop printing.
Then higher lows begin forming.
Then pullbacks become shallower.
That’s what’s developing now.
Instead of cascading breakdowns, dips are getting absorbed faster. Volatility feels controlled rather than chaotic. The market isn’t collapsing on weakness — it’s stabilizing.
Structural resilience is the earliest bullish tell.
2. BTC Is Acting Like a Leader Again
Bitcoin doesn’t need vertical candles to signal strength.
Slow grinding accumulation is often more powerful than explosive rallies. When $BTC holds levels despite negative sentiment and reclaims key zones without euphoria, it suggests positioning — not speculation.
Bull markets often start in boredom.
Not excitement.
Right now feels more like silent positioning than retail mania.
3. Liquidity Is Slowly Returning
Crypto doesn’t move on hope.
It moves on liquidity.
We’re beginning to see capital rotate back into risk assets. Institutional participation is more measured, but it’s present. Long-term investors are engaging again.
Liquidity expansions always precede strong crypto cycles.
When money flows, crypto tends to amplify.
And the early flow signals are appearing.
4. Ethereum and Infrastructure Are Quietly Building
Ethereum doesn’t always lead loudly.
In past cycles, $ETH often lagged slightly before accelerating aggressively. Development activity remains consistent. On-chain engagement hasn’t collapsed.
Strong ecosystems build before price reacts.
That pattern looks familiar.
5. Altcoins Are Showing Selective Strength
Deep bear markets crush everything indiscriminately.
That’s not happening now.
We’re seeing selective rotation:
• AI-related projects
• Infrastructure protocols
• High-liquidity meme assets
Not everything is pumping — and that’s healthy.
Early bull phases reward selectivity, not chaos.
6. Sentiment Is Still Skeptical
This might be the strongest signal of all.
People are cautious.
Narratives are restrained.
Doubt dominates discussions.
True bull markets don’t begin with consensus optimism. They begin when most participants remain defensive.
When everyone agrees it’s bullish, the easy move is gone.
Right now, skepticism remains high — and that’s constructive.
7. On-Chain Behavior Is Supportive
Long-term holders aren’t distributing aggressively.
Supply isn’t flooding exchanges.
Coins are moving into stronger hands.
Selling pressure feels absorbed rather than expanding.
Tightening supply combined with gradual demand recovery creates sustainable conditions.
Not explosive — sustainable.
8. The Market Is Absorbing Bad News
In bear markets, negative headlines cause violent reactions.
Recently, bad news hasn’t triggered collapse. Price reacts — but doesn’t cascade.
That shift in reaction function matters.
Markets that absorb negativity tend to be transitioning upward.
Important Reality
This doesn’t mean straight-line gains.
Early bull cycles are messy:
• Choppy ranges
• Fake breakdowns
• Frustrating consolidations
They don’t feel obvious.
They feel confusing.
Only later do they become obvious in hindsight.
Why I Believe the Shift Is Underway
Because:
• Structure is stabilizing
• Liquidity is rotating
• Supply is tightening
• Sentiment remains skeptical
• Downside reactions are weakening
That alignment doesn’t guarantee parabolic upside tomorrow.
But it strongly resembles the early stages of past cycle transitions.
Bull markets don’t begin with fireworks.
They begin with subtle strength.
And right now, the market feels quietly strong.
That’s usually how the biggest moves start.
#Bitcoin #Ethereum #Crypto
{future}(BTCUSDT)
{future}(ETHUSDT)
Why I Think BTC This Crypto Bull Cycle Has Already Begun
For months, the market felt exhausted.
Every bounce was sold.
Every breakout failed.
Confidence was thin.
But recently, the tone has shifted — not dramatically, not euphorically — just subtly and structurally. And that kind of shift is often how real bull cycles begin.
This doesn’t look like hype.
It looks like transition.
1. Structure Is Quietly Improving
In every major cycle, the change happens before the headlines catch up.
First, the lower lows stop printing.
Then higher lows begin forming.
Then pullbacks become shallower.
That’s what’s developing now.
Instead of cascading breakdowns, dips are getting absorbed faster. Volatility feels controlled rather than chaotic. The market isn’t collapsing on weakness — it’s stabilizing.
Structural resilience is the earliest bullish tell.
2. BTC Is Acting Like a Leader Again
Bitcoin doesn’t need vertical candles to signal strength.
Slow grinding accumulation is often more powerful than explosive rallies. When $BTC holds levels despite negative sentiment and reclaims key zones without euphoria, it suggests positioning — not speculation.
Bull markets often start in boredom.
Not excitement.
Right now feels more like silent positioning than retail mania.
3. Liquidity Is Slowly Returning
Crypto doesn’t move on hope.
It moves on liquidity.
We’re beginning to see capital rotate back into risk assets. Institutional participation is more measured, but it’s present. Long-term investors are engaging again.
Liquidity expansions always precede strong crypto cycles.
When money flows, crypto tends to amplify.
And the early flow signals are appearing.
4. Ethereum and Infrastructure Are Quietly Building
Ethereum doesn’t always lead loudly.
In past cycles, $ETH often lagged slightly before accelerating aggressively. Development activity remains consistent. On-chain engagement hasn’t collapsed.
Strong ecosystems build before price reacts.
That pattern looks familiar.
5. Altcoins Are Showing Selective Strength
Deep bear markets crush everything indiscriminately.
That’s not happening now.
We’re seeing selective rotation:
• AI-related projects
• Infrastructure protocols
• High-liquidity meme assets
Not everything is pumping — and that’s healthy.
Early bull phases reward selectivity, not chaos.
6. Sentiment Is Still Skeptical
This might be the strongest signal of all.
People are cautious.
Narratives are restrained.
Doubt dominates discussions.
True bull markets don’t begin with consensus optimism. They begin when most participants remain defensive.
When everyone agrees it’s bullish, the easy move is gone.
Right now, skepticism remains high — and that’s constructive.
7. On-Chain Behavior Is Supportive
Long-term holders aren’t distributing aggressively.
Supply isn’t flooding exchanges.
Coins are moving into stronger hands.
Selling pressure feels absorbed rather than expanding.
Tightening supply combined with gradual demand recovery creates sustainable conditions.
Not explosive — sustainable.
8. The Market Is Absorbing Bad News
In bear markets, negative headlines cause violent reactions.
Recently, bad news hasn’t triggered collapse. Price reacts — but doesn’t cascade.
That shift in reaction function matters.
Markets that absorb negativity tend to be transitioning upward.
Important Reality
This doesn’t mean straight-line gains.
Early bull cycles are messy:
• Choppy ranges
• Fake breakdowns
• Frustrating consolidations
They don’t feel obvious.
They feel confusing.
Only later do they become obvious in hindsight.
Why I Believe the Shift Is Underway
Because:
• Structure is stabilizing
• Liquidity is rotating
• Supply is tightening
• Sentiment remains skeptical
• Downside reactions are weakening
That alignment doesn’t guarantee parabolic upside tomorrow.
But it strongly resembles the early stages of past cycle transitions.
Bull markets don’t begin with fireworks.
They begin with subtle strength.
And right now, the market feels quietly strong.
That’s usually how the biggest moves start.
#Bitcoin #Ethereum #Crypto
Every bounce was sold.
Every breakout failed.
Confidence was thin.
But recently, the tone has shifted — not dramatically, not euphorically — just subtly and structurally. And that kind of shift is often how real bull cycles begin.
This doesn’t look like hype.
It looks like transition.
1. Structure Is Quietly Improving
In every major cycle, the change happens before the headlines catch up.
First, the lower lows stop printing.
Then higher lows begin forming.
Then pullbacks become shallower.
That’s what’s developing now.
Instead of cascading breakdowns, dips are getting absorbed faster. Volatility feels controlled rather than chaotic. The market isn’t collapsing on weakness — it’s stabilizing.
Structural resilience is the earliest bullish tell.
2. BTC Is Acting Like a Leader Again
Bitcoin doesn’t need vertical candles to signal strength.
Slow grinding accumulation is often more powerful than explosive rallies. When $BTC holds levels despite negative sentiment and reclaims key zones without euphoria, it suggests positioning — not speculation.
Bull markets often start in boredom.
Not excitement.
Right now feels more like silent positioning than retail mania.
3. Liquidity Is Slowly Returning
Crypto doesn’t move on hope.
It moves on liquidity.
We’re beginning to see capital rotate back into risk assets. Institutional participation is more measured, but it’s present. Long-term investors are engaging again.
Liquidity expansions always precede strong crypto cycles.
When money flows, crypto tends to amplify.
And the early flow signals are appearing.
4. Ethereum and Infrastructure Are Quietly Building
Ethereum doesn’t always lead loudly.
In past cycles, $ETH often lagged slightly before accelerating aggressively. Development activity remains consistent. On-chain engagement hasn’t collapsed.
Strong ecosystems build before price reacts.
That pattern looks familiar.
5. Altcoins Are Showing Selective Strength
Deep bear markets crush everything indiscriminately.
That’s not happening now.
We’re seeing selective rotation:
• AI-related projects
• Infrastructure protocols
• High-liquidity meme assets
Not everything is pumping — and that’s healthy.
Early bull phases reward selectivity, not chaos.
6. Sentiment Is Still Skeptical
This might be the strongest signal of all.
People are cautious.
Narratives are restrained.
Doubt dominates discussions.
True bull markets don’t begin with consensus optimism. They begin when most participants remain defensive.
When everyone agrees it’s bullish, the easy move is gone.
Right now, skepticism remains high — and that’s constructive.
7. On-Chain Behavior Is Supportive
Long-term holders aren’t distributing aggressively.
Supply isn’t flooding exchanges.
Coins are moving into stronger hands.
Selling pressure feels absorbed rather than expanding.
Tightening supply combined with gradual demand recovery creates sustainable conditions.
Not explosive — sustainable.
8. The Market Is Absorbing Bad News
In bear markets, negative headlines cause violent reactions.
Recently, bad news hasn’t triggered collapse. Price reacts — but doesn’t cascade.
That shift in reaction function matters.
Markets that absorb negativity tend to be transitioning upward.
Important Reality
This doesn’t mean straight-line gains.
Early bull cycles are messy:
• Choppy ranges
• Fake breakdowns
• Frustrating consolidations
They don’t feel obvious.
They feel confusing.
Only later do they become obvious in hindsight.
Why I Believe the Shift Is Underway
Because:
• Structure is stabilizing
• Liquidity is rotating
• Supply is tightening
• Sentiment remains skeptical
• Downside reactions are weakening
That alignment doesn’t guarantee parabolic upside tomorrow.
But it strongly resembles the early stages of past cycle transitions.
Bull markets don’t begin with fireworks.
They begin with subtle strength.
And right now, the market feels quietly strong.
That’s usually how the biggest moves start.
#Bitcoin #Ethereum #Crypto
15
8
87
94.8k
Статья
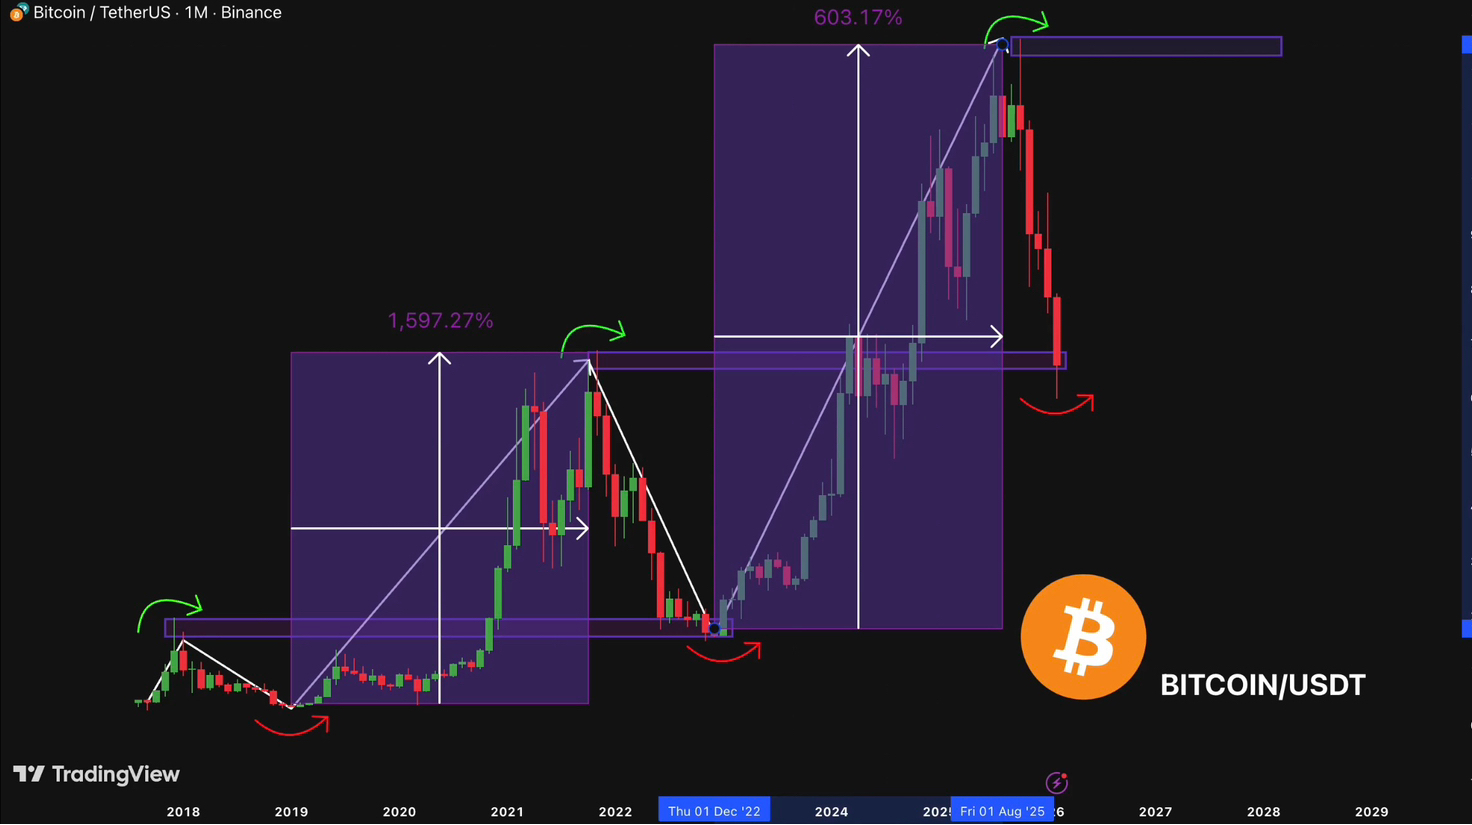
BTC At Historical Production Cost ZoneThere’s a level on the chart that doesn’t get enough attention.
Not resistance.
Not a trendline.
Not a moving average.
Production cost.
Right now, Bitcoin is trading very close to its estimated average mining cost — the same economic zone that has quietly marked every major macro bottom in previous cycles.
And that’s not random.
Why Production Cost Matters
Production cost represents the real economic floor of the network.
When price approaches this zone:
➜ Miner profit margins compress
➜ Aggressive selling slows down
➜ Inefficient miners shut off
➜ Network sell pressure naturally declines
Mining is a business. When margins shrink, forced supply decreases over time. That supply contraction changes the balance between buyers and sellers.
Not overnight.
But structurally.
The Historical Pattern
Look back at prior cycle bottoms:
• 2015 → Bottom formed near production cost
• 2018 → Bottom aligned with mining cost compression
• 2022 → Price stabilized around the same economic floor
• 2026 → Price once again testing that zone
Every time price fell materially below production cost, it didn’t stay there long. Extended mining at a loss is unsustainable.
Eventually, equilibrium returns.
What Typically Follows
This zone doesn’t trigger instant rallies.
It usually triggers a process:
➜ Volatility contracts
➜ Sentiment deteriorates
➜ Weak hands exit
➜ Stronger capital accumulates
➜ Structure slowly rebuilds
Only later does expansion begin.
By the time momentum returns, the opportunity window is already smaller.
The Psychology of This Phase
This is where:
• Fear dominates narratives
• Analysts call for extreme lower targets
• Retail conviction collapses
• Long-term capital quietly positions
Production cost zones don’t feel bullish when they form.
They feel uncomfortable.
That discomfort is part of the structure.
Important Context
This level is not a guaranteed bottom.
Black swans can push price lower temporarily.
Macro shocks can distort cycles.
But historically, production cost has acted as a gravity zone — a place where downside risk compresses relative to long-term upside.
Markets don’t respect this area because of magic.
They respect it because it reflects real economic pressure inside the system.
When economics stabilize, structure stabilizes.
And when structure stabilizes, cycles reset.
History doesn’t repeat perfectly.
But the rhythm of supply economics has remained surprisingly consistent.
Smart capital isn’t reacting emotionally here.
It’s observing the cost floor.
And so far, $BTC is trading right on top of it.
$BTC #Bitcoin #Crypto
{future}(BTCUSDT)
BTC At Historical Production Cost Zone
There’s a level on the chart that doesn’t get enough attention.
Not resistance.
Not a trendline.
Not a moving average.
Production cost.
Right now, Bitcoin is trading very close to its estimated average mining cost — the same economic zone that has quietly marked every major macro bottom in previous cycles.
And that’s not random.
Why Production Cost Matters
Production cost represents the real economic floor of the network.
When price approaches this zone:
➜ Miner profit margins compress
➜ Aggressive selling slows down
➜ Inefficient miners shut off
➜ Network sell pressure naturally declines
Mining is a business. When margins shrink, forced supply decreases over time. That supply contraction changes the balance between buyers and sellers.
Not overnight.
But structurally.
The Historical Pattern
Look back at prior cycle bottoms:
• 2015 → Bottom formed near production cost
• 2018 → Bottom aligned with mining cost compression
• 2022 → Price stabilized around the same economic floor
• 2026 → Price once again testing that zone
Every time price fell materially below production cost, it didn’t stay there long. Extended mining at a loss is unsustainable.
Eventually, equilibrium returns.
What Typically Follows
This zone doesn’t trigger instant rallies.
It usually triggers a process:
➜ Volatility contracts
➜ Sentiment deteriorates
➜ Weak hands exit
➜ Stronger capital accumulates
➜ Structure slowly rebuilds
Only later does expansion begin.
By the time momentum returns, the opportunity window is already smaller.
The Psychology of This Phase
This is where:
• Fear dominates narratives
• Analysts call for extreme lower targets
• Retail conviction collapses
• Long-term capital quietly positions
Production cost zones don’t feel bullish when they form.
They feel uncomfortable.
That discomfort is part of the structure.
Important Context
This level is not a guaranteed bottom.
Black swans can push price lower temporarily.
Macro shocks can distort cycles.
But historically, production cost has acted as a gravity zone — a place where downside risk compresses relative to long-term upside.
Markets don’t respect this area because of magic.
They respect it because it reflects real economic pressure inside the system.
When economics stabilize, structure stabilizes.
And when structure stabilizes, cycles reset.
History doesn’t repeat perfectly.
But the rhythm of supply economics has remained surprisingly consistent.
Smart capital isn’t reacting emotionally here.
It’s observing the cost floor.
And so far, $BTC is trading right on top of it.
$BTC #Bitcoin #Crypto
Not resistance.
Not a trendline.
Not a moving average.
Production cost.
Right now, Bitcoin is trading very close to its estimated average mining cost — the same economic zone that has quietly marked every major macro bottom in previous cycles.
And that’s not random.
Why Production Cost Matters
Production cost represents the real economic floor of the network.
When price approaches this zone:
➜ Miner profit margins compress
➜ Aggressive selling slows down
➜ Inefficient miners shut off
➜ Network sell pressure naturally declines
Mining is a business. When margins shrink, forced supply decreases over time. That supply contraction changes the balance between buyers and sellers.
Not overnight.
But structurally.
The Historical Pattern
Look back at prior cycle bottoms:
• 2015 → Bottom formed near production cost
• 2018 → Bottom aligned with mining cost compression
• 2022 → Price stabilized around the same economic floor
• 2026 → Price once again testing that zone
Every time price fell materially below production cost, it didn’t stay there long. Extended mining at a loss is unsustainable.
Eventually, equilibrium returns.
What Typically Follows
This zone doesn’t trigger instant rallies.
It usually triggers a process:
➜ Volatility contracts
➜ Sentiment deteriorates
➜ Weak hands exit
➜ Stronger capital accumulates
➜ Structure slowly rebuilds
Only later does expansion begin.
By the time momentum returns, the opportunity window is already smaller.
The Psychology of This Phase
This is where:
• Fear dominates narratives
• Analysts call for extreme lower targets
• Retail conviction collapses
• Long-term capital quietly positions
Production cost zones don’t feel bullish when they form.
They feel uncomfortable.
That discomfort is part of the structure.
Important Context
This level is not a guaranteed bottom.
Black swans can push price lower temporarily.
Macro shocks can distort cycles.
But historically, production cost has acted as a gravity zone — a place where downside risk compresses relative to long-term upside.
Markets don’t respect this area because of magic.
They respect it because it reflects real economic pressure inside the system.
When economics stabilize, structure stabilizes.
And when structure stabilizes, cycles reset.
History doesn’t repeat perfectly.
But the rhythm of supply economics has remained surprisingly consistent.
Smart capital isn’t reacting emotionally here.
It’s observing the cost floor.
And so far, $BTC is trading right on top of it.
$BTC #Bitcoin #Crypto
2
2
14
14.7k
Статья
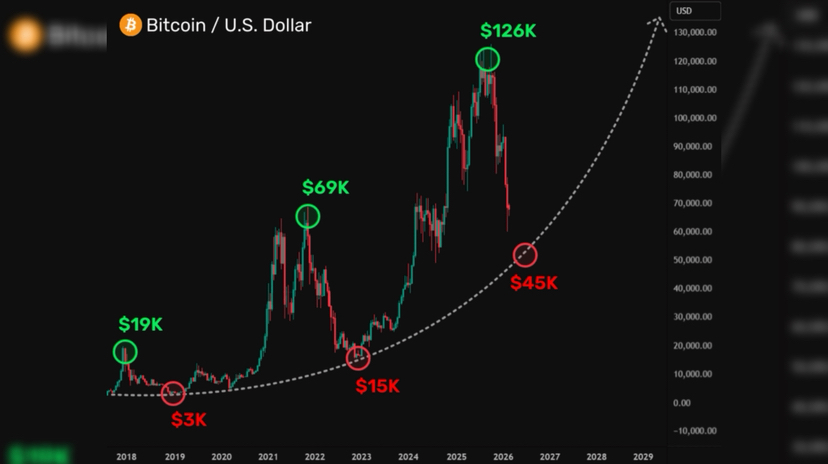
BTC At a Reversal Threshold: Hold the Low, Open the Path to $70KNo matter how you frame it, the current $BTC structure still leans toward a constructive scenario. When I look at the chart, one thing stands out clearly: the market is behaving exactly how strong trends often behave before expansion.
First, it did what needed to be done — it swept liquidity.
Thin pockets below support were taken out. Leveraged longs were flushed. Weak hands were removed. What remains is cleaner structure and redistributed positioning. That kind of reset is often a prerequisite before a sustainable move higher.
Interestingly, instead of squeezing shorts immediately by pushing higher, the market chose to clear downside leverage first. To me, that signals prioritization — remove excess long exposure before attempting expansion.
The Bearish Argument Still Exists
From a purely technical standpoint, one could argue that the recent move resembles a breakdown from a bearish flag, with deeper targets — potentially even below $50,000.
But if that scenario plays out, price would be driven directly into major long-term support — zones where historical demand has reacted aggressively. For bears, pushing price that deep without a significant macro catalyst would likely be overextension at this stage.
The Key Variable: The Most Recent Low
Everything now hinges on how price closes and reacts around the recent low.
If that zone:
• Holds firmly
• Shows absorption
• Builds higher lows
• Compresses volatility
Then the entire recent move shifts from “breakdown” to “tight accumulation.”
And in that case, the path toward $70K — and potentially higher — opens naturally through structural expansion.
This is still a scenario, not certainty.
But markets rarely expand without first cleaning out excess positioning.
Right now, the structure suggests that process may already be underway.
Hold the low — build the base — target expansion.
$BTC #Bitcoin #Crypto
{future}(BTCUSDT)
BTC At a Reversal Threshold: Hold the Low, Open the Path to $70K
No matter how you frame it, the current $BTC structure still leans toward a constructive scenario. When I look at the chart, one thing stands out clearly: the market is behaving exactly how strong trends often behave before expansion.
First, it did what needed to be done — it swept liquidity.
Thin pockets below support were taken out. Leveraged longs were flushed. Weak hands were removed. What remains is cleaner structure and redistributed positioning. That kind of reset is often a prerequisite before a sustainable move higher.
Interestingly, instead of squeezing shorts immediately by pushing higher, the market chose to clear downside leverage first. To me, that signals prioritization — remove excess long exposure before attempting expansion.
The Bearish Argument Still Exists
From a purely technical standpoint, one could argue that the recent move resembles a breakdown from a bearish flag, with deeper targets — potentially even below $50,000.
But if that scenario plays out, price would be driven directly into major long-term support — zones where historical demand has reacted aggressively. For bears, pushing price that deep without a significant macro catalyst would likely be overextension at this stage.
The Key Variable: The Most Recent Low
Everything now hinges on how price closes and reacts around the recent low.
If that zone:
• Holds firmly
• Shows absorption
• Builds higher lows
• Compresses volatility
Then the entire recent move shifts from “breakdown” to “tight accumulation.”
And in that case, the path toward $70K — and potentially higher — opens naturally through structural expansion.
This is still a scenario, not certainty.
But markets rarely expand without first cleaning out excess positioning.
Right now, the structure suggests that process may already be underway.
Hold the low — build the base — target expansion.
$BTC #Bitcoin #Crypto
First, it did what needed to be done — it swept liquidity.
Thin pockets below support were taken out. Leveraged longs were flushed. Weak hands were removed. What remains is cleaner structure and redistributed positioning. That kind of reset is often a prerequisite before a sustainable move higher.
Interestingly, instead of squeezing shorts immediately by pushing higher, the market chose to clear downside leverage first. To me, that signals prioritization — remove excess long exposure before attempting expansion.
The Bearish Argument Still Exists
From a purely technical standpoint, one could argue that the recent move resembles a breakdown from a bearish flag, with deeper targets — potentially even below $50,000.
But if that scenario plays out, price would be driven directly into major long-term support — zones where historical demand has reacted aggressively. For bears, pushing price that deep without a significant macro catalyst would likely be overextension at this stage.
The Key Variable: The Most Recent Low
Everything now hinges on how price closes and reacts around the recent low.
If that zone:
• Holds firmly
• Shows absorption
• Builds higher lows
• Compresses volatility
Then the entire recent move shifts from “breakdown” to “tight accumulation.”
And in that case, the path toward $70K — and potentially higher — opens naturally through structural expansion.
This is still a scenario, not certainty.
But markets rarely expand without first cleaning out excess positioning.
Right now, the structure suggests that process may already be underway.
Hold the low — build the base — target expansion.
$BTC #Bitcoin #Crypto
5
3
56
55.2k
Статья
Data From 3 Bear Cycles: How Much Longer Until $BTC Finds a Bottom?Every cycle feels unique in the moment.
But when you zoom out, momentum behaves in surprisingly repetitive ways.
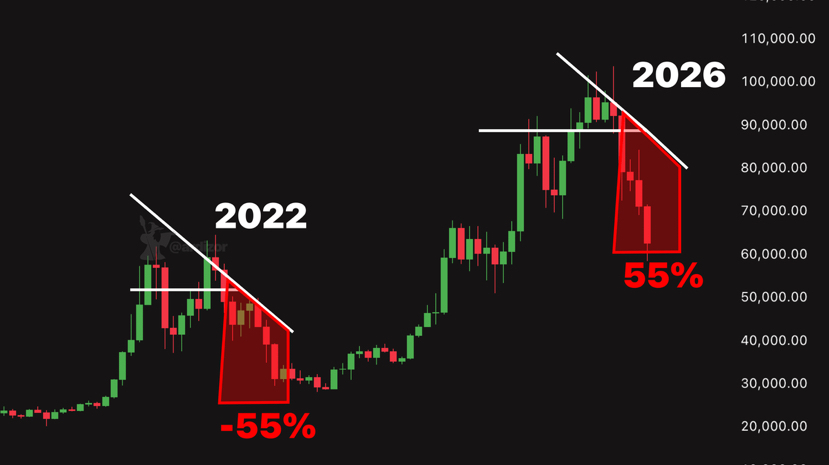
I compared the last three major bear markets using the monthly Stochastic — not as a crystal ball, but as a higher-timeframe momentum gauge.
Right now, the monthly Stochastic sits around the 56th percentile and falling. That matters because historically, once momentum rolls over from this zone, the path toward deeper compression often continues.
What History Shows
From roughly the same momentum percentile in prior cycles:
• 2014–2015: ~396 days to reach the macro low
• 2018–2019: ~335 days
• 2022–2023: ~275 days
There’s a clear pattern:
Each bear cycle shortened by roughly 60 days.
If that structural compression continues, it suggests roughly ~200–220 days may remain before a comparable macro bottom forms.
That doesn’t mean price must follow that timeline — only that the momentum decay rhythm has been accelerating across cycles.
Important Clarification
Stochastic does not predict bottoms.
It confirms momentum exhaustion on a higher timeframe.
Historically:
• The strongest accumulation windows occurred when monthly Stochastic dropped below the 20th percentile
• Price often bottomed 2–4 months before the official momentum crossover
• Structural bases formed before sentiment shifted
Momentum confirms.
Structure leads.
What This Implies
If the pattern rhymes:
A potential macro bottom window could develop sometime in the mid-year zone — assuming no major black swan event accelerates or distorts the cycle.
But price alone isn’t enough.
What I’m watching for:
• A clearly defined accumulation range
• Volatility compression
• Diminishing sell pressure
• Monthly Stochastic approaching sub-20 territory
That confluence matters more than a specific dollar level.
Current Positioning
I’ve accumulated some spot exposure.
There are buy orders staged lower — including around the $50K region — but levels are secondary.
The real trigger is structural confirmation.
The Bigger Truth
No one knows the exact bottom.
Not analysts.
Not influencers.
Not even those who’ve navigated multiple cycles successfully.
But markets leave footprints.
Momentum weakens before reversal.
Liquidity dries before expansion.
Sentiment collapses before rebuilding.
Every cycle tells a story.
The question is whether you’re reacting emotionally — or reading the structure patiently.
$BTC #Bitcoin #Crypto
{future}(BTCUSDT)
Data From 3 Bear Cycles: How Much Longer Until $BTC Finds a Bottom?
Every cycle feels unique in the moment.
But when you zoom out, momentum behaves in surprisingly repetitive ways.
I compared the last three major bear markets using the monthly Stochastic — not as a crystal ball, but as a higher-timeframe momentum gauge.
Right now, the monthly Stochastic sits around the 56th percentile and falling. That matters because historically, once momentum rolls over from this zone, the path toward deeper compression often continues.
What History Shows
From roughly the same momentum percentile in prior cycles:
• 2014–2015: ~396 days to reach the macro low
• 2018–2019: ~335 days
• 2022–2023: ~275 days
There’s a clear pattern:
Each bear cycle shortened by roughly 60 days.
If that structural compression continues, it suggests roughly ~200–220 days may remain before a comparable macro bottom forms.
That doesn’t mean price must follow that timeline — only that the momentum decay rhythm has been accelerating across cycles.
Important Clarification
Stochastic does not predict bottoms.
It confirms momentum exhaustion on a higher timeframe.
Historically:
• The strongest accumulation windows occurred when monthly Stochastic dropped below the 20th percentile
• Price often bottomed 2–4 months before the official momentum crossover
• Structural bases formed before sentiment shifted
Momentum confirms.
Structure leads.
What This Implies
If the pattern rhymes:
A potential macro bottom window could develop sometime in the mid-year zone — assuming no major black swan event accelerates or distorts the cycle.
But price alone isn’t enough.
What I’m watching for:
• A clearly defined accumulation range
• Volatility compression
• Diminishing sell pressure
• Monthly Stochastic approaching sub-20 territory
That confluence matters more than a specific dollar level.
Current Positioning
I’ve accumulated some spot exposure.
There are buy orders staged lower — including around the $50K region — but levels are secondary.
The real trigger is structural confirmation.
The Bigger Truth
No one knows the exact bottom.
Not analysts.
Not influencers.
Not even those who’ve navigated multiple cycles successfully.
But markets leave footprints.
Momentum weakens before reversal.
Liquidity dries before expansion.
Sentiment collapses before rebuilding.
Every cycle tells a story.
The question is whether you’re reacting emotionally — or reading the structure patiently.
$BTC #Bitcoin #Crypto
But when you zoom out, momentum behaves in surprisingly repetitive ways.
I compared the last three major bear markets using the monthly Stochastic — not as a crystal ball, but as a higher-timeframe momentum gauge.
Right now, the monthly Stochastic sits around the 56th percentile and falling. That matters because historically, once momentum rolls over from this zone, the path toward deeper compression often continues.
What History Shows
From roughly the same momentum percentile in prior cycles:
• 2014–2015: ~396 days to reach the macro low
• 2018–2019: ~335 days
• 2022–2023: ~275 days
There’s a clear pattern:
Each bear cycle shortened by roughly 60 days.
If that structural compression continues, it suggests roughly ~200–220 days may remain before a comparable macro bottom forms.
That doesn’t mean price must follow that timeline — only that the momentum decay rhythm has been accelerating across cycles.
Important Clarification
Stochastic does not predict bottoms.
It confirms momentum exhaustion on a higher timeframe.
Historically:
• The strongest accumulation windows occurred when monthly Stochastic dropped below the 20th percentile
• Price often bottomed 2–4 months before the official momentum crossover
• Structural bases formed before sentiment shifted
Momentum confirms.
Structure leads.
What This Implies
If the pattern rhymes:
A potential macro bottom window could develop sometime in the mid-year zone — assuming no major black swan event accelerates or distorts the cycle.
But price alone isn’t enough.
What I’m watching for:
• A clearly defined accumulation range
• Volatility compression
• Diminishing sell pressure
• Monthly Stochastic approaching sub-20 territory
That confluence matters more than a specific dollar level.
Current Positioning
I’ve accumulated some spot exposure.
There are buy orders staged lower — including around the $50K region — but levels are secondary.
The real trigger is structural confirmation.
The Bigger Truth
No one knows the exact bottom.
Not analysts.
Not influencers.
Not even those who’ve navigated multiple cycles successfully.
But markets leave footprints.
Momentum weakens before reversal.
Liquidity dries before expansion.
Sentiment collapses before rebuilding.
Every cycle tells a story.
The question is whether you’re reacting emotionally — or reading the structure patiently.
$BTC #Bitcoin #Crypto
10
3
51
53.2k
Статья
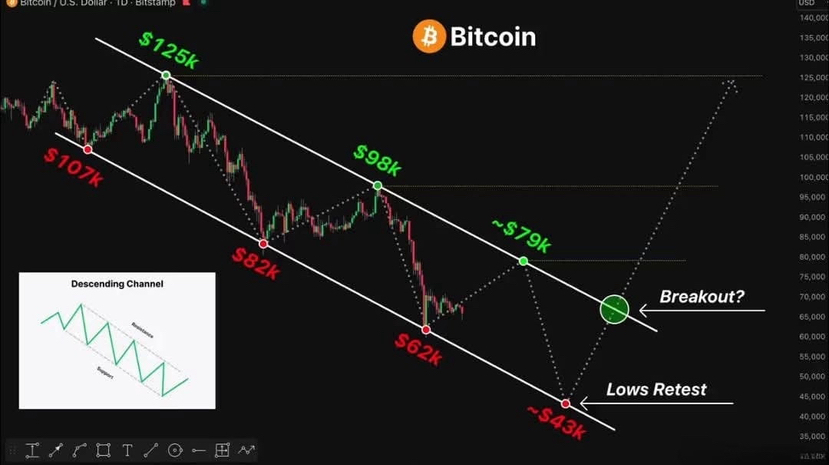
BTC Descending Channel Structure in PlayZoom out and the sequence becomes clear.
$125K → $82K → $98K → $62K → ~$79K → ~$43K
Progressive lower highs.
Repeated support interactions.
Clean channel compression.
This isn’t random volatility — it’s a structured descending channel.
What the Pattern Tells Us
Inside the channel:
• Each rally fails below the previous high
• Each selloff revisits liquidity near support
• Volatility compresses over time
• Momentum weakens into the lower boundary
This kind of structure reflects controlled distribution and mechanical repricing — not chaotic collapse.
But descending channels eventually resolve.
And when they do, expansion tends to be decisive.
The Breakout Phase
If price establishes acceptance above the upper boundary:
• Lower-high structure breaks
• Shorts lose structural control
• Momentum flips from compression to expansion
• Liquidity above becomes fuel
Breakouts from prolonged descending channels historically produce aggressive moves — not slow drifts.
Because energy has been stored.
The Critical Detail
A wick above resistance isn’t enough.
The structure must:
• Close above the channel
• Hold the breakout on retest
• Print higher highs and higher lows
• Expand volume with momentum
Without that confirmation, it’s just another liquidity sweep.
If Structure Holds
Compression → Break → Expansion.
That’s the cycle.
If the breakout confirms, parabolic acceleration becomes structurally possible — not guaranteed, but possible.
Until then, it’s still a channel.
Watch the boundary.
That’s where compression turns into momentum.
$BTC #Bitcoin #Crypto
{future}(BTCUSDT)
BTC Descending Channel Structure in Play
Zoom out and the sequence becomes clear.
$125K → $82K → $98K → $62K → ~$79K → ~$43K
Progressive lower highs.
Repeated support interactions.
Clean channel compression.
This isn’t random volatility — it’s a structured descending channel.
What the Pattern Tells Us
Inside the channel:
• Each rally fails below the previous high
• Each selloff revisits liquidity near support
• Volatility compresses over time
• Momentum weakens into the lower boundary
This kind of structure reflects controlled distribution and mechanical repricing — not chaotic collapse.
But descending channels eventually resolve.
And when they do, expansion tends to be decisive.
The Breakout Phase
If price establishes acceptance above the upper boundary:
• Lower-high structure breaks
• Shorts lose structural control
• Momentum flips from compression to expansion
• Liquidity above becomes fuel
Breakouts from prolonged descending channels historically produce aggressive moves — not slow drifts.
Because energy has been stored.
The Critical Detail
A wick above resistance isn’t enough.
The structure must:
• Close above the channel
• Hold the breakout on retest
• Print higher highs and higher lows
• Expand volume with momentum
Without that confirmation, it’s just another liquidity sweep.
If Structure Holds
Compression → Break → Expansion.
That’s the cycle.
If the breakout confirms, parabolic acceleration becomes structurally possible — not guaranteed, but possible.
Until then, it’s still a channel.
Watch the boundary.
That’s where compression turns into momentum.
$BTC #Bitcoin #Crypto
$125K → $82K → $98K → $62K → ~$79K → ~$43K
Progressive lower highs.
Repeated support interactions.
Clean channel compression.
This isn’t random volatility — it’s a structured descending channel.
What the Pattern Tells Us
Inside the channel:
• Each rally fails below the previous high
• Each selloff revisits liquidity near support
• Volatility compresses over time
• Momentum weakens into the lower boundary
This kind of structure reflects controlled distribution and mechanical repricing — not chaotic collapse.
But descending channels eventually resolve.
And when they do, expansion tends to be decisive.
The Breakout Phase
If price establishes acceptance above the upper boundary:
• Lower-high structure breaks
• Shorts lose structural control
• Momentum flips from compression to expansion
• Liquidity above becomes fuel
Breakouts from prolonged descending channels historically produce aggressive moves — not slow drifts.
Because energy has been stored.
The Critical Detail
A wick above resistance isn’t enough.
The structure must:
• Close above the channel
• Hold the breakout on retest
• Print higher highs and higher lows
• Expand volume with momentum
Without that confirmation, it’s just another liquidity sweep.
If Structure Holds
Compression → Break → Expansion.
That’s the cycle.
If the breakout confirms, parabolic acceleration becomes structurally possible — not guaranteed, but possible.
Until then, it’s still a channel.
Watch the boundary.
That’s where compression turns into momentum.
$BTC #Bitcoin #Crypto
32
10
98
99.2k
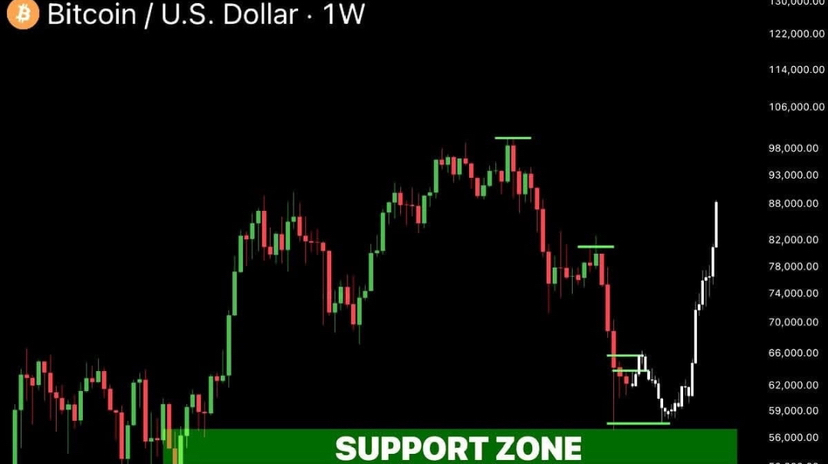
Статья
FINAL LEG? $BTC Compression Before Another Sweep$BTC is currently rotating inside the $67K–$69K pocket — a tight intraday range that looks stable on the surface, but structurally fragile underneath.
Momentum isn’t expanding.
Buyers aren’t accelerating.
And every push higher lacks follow-through.
When price stalls mid-range like this, it often signals imbalance below.
Why ~$58K Matters
If the current structure continues — lower highs, muted volume, slow drift — a gradual move toward the $58K liquidity zone becomes increasingly probable.
That region holds:
• Prior demand interaction
• Stop clusters from late longs
• Untested liquidity pockets
• Structural imbalance from the previous bounce
Markets tend to revisit unfinished zones before rebuilding trend.
Base Formation Or Breakdown?
A move into ~$58K doesn’t automatically mean collapse.
It could represent:
• Final liquidity sweep
• Sentiment exhaustion
• Repricing before stabilization
What matters most isn’t the touch.
It’s the reaction.
• Strong absorption + compression → potential base building
• Weak bounce + heavy supply → continuation risk
Current Context
Inside $67K–$69K, we’re in equilibrium.
But equilibrium without expansion usually resolves with expansion.
The question is direction.
Structure will confirm it.
Watch how price behaves near $58K if it gets there.
That’s where the real decision may unfold.
$BTC #Bitcoin #Crypto
{future}(BTCUSDT)
FINAL LEG? $BTC Compression Before Another Sweep
$BTC is currently rotating inside the $67K–$69K pocket — a tight intraday range that looks stable on the surface, but structurally fragile underneath.
Momentum isn’t expanding.
Buyers aren’t accelerating.
And every push higher lacks follow-through.
When price stalls mid-range like this, it often signals imbalance below.
Why ~$58K Matters
If the current structure continues — lower highs, muted volume, slow drift — a gradual move toward the $58K liquidity zone becomes increasingly probable.
That region holds:
• Prior demand interaction
• Stop clusters from late longs
• Untested liquidity pockets
• Structural imbalance from the previous bounce
Markets tend to revisit unfinished zones before rebuilding trend.
Base Formation Or Breakdown?
A move into ~$58K doesn’t automatically mean collapse.
It could represent:
• Final liquidity sweep
• Sentiment exhaustion
• Repricing before stabilization
What matters most isn’t the touch.
It’s the reaction.
• Strong absorption + compression → potential base building
• Weak bounce + heavy supply → continuation risk
Current Context
Inside $67K–$69K, we’re in equilibrium.
But equilibrium without expansion usually resolves with expansion.
The question is direction.
Structure will confirm it.
Watch how price behaves near $58K if it gets there.
That’s where the real decision may unfold.
$BTC #Bitcoin #Crypto
Momentum isn’t expanding.
Buyers aren’t accelerating.
And every push higher lacks follow-through.
When price stalls mid-range like this, it often signals imbalance below.
Why ~$58K Matters
If the current structure continues — lower highs, muted volume, slow drift — a gradual move toward the $58K liquidity zone becomes increasingly probable.
That region holds:
• Prior demand interaction
• Stop clusters from late longs
• Untested liquidity pockets
• Structural imbalance from the previous bounce
Markets tend to revisit unfinished zones before rebuilding trend.
Base Formation Or Breakdown?
A move into ~$58K doesn’t automatically mean collapse.
It could represent:
• Final liquidity sweep
• Sentiment exhaustion
• Repricing before stabilization
What matters most isn’t the touch.
It’s the reaction.
• Strong absorption + compression → potential base building
• Weak bounce + heavy supply → continuation risk
Current Context
Inside $67K–$69K, we’re in equilibrium.
But equilibrium without expansion usually resolves with expansion.
The question is direction.
Structure will confirm it.
Watch how price behaves near $58K if it gets there.
That’s where the real decision may unfold.
$BTC #Bitcoin #Crypto
22
17.9k
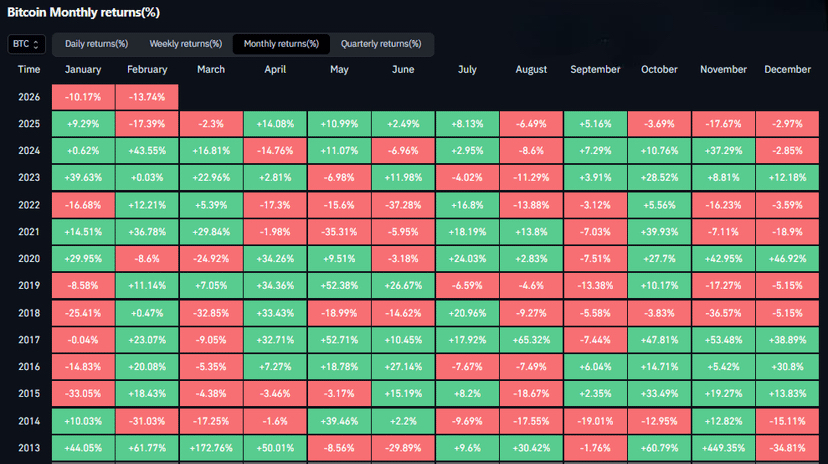
Статья
BTC 7-Year Record in Focus: Momentum Exhaustion or Structural Breakdown?Bitcoin is approaching a macro statistic we haven’t seen since 2018.
If this month closes red, $BTC will print its longest streak of consecutive monthly declines in seven years. That’s not just a headline number — that’s higher-timeframe momentum compression.
On the monthly chart, streaks like this rarely happen in random conditions. They usually appear when:
• Liquidity is tight
• Sentiment is damaged
• Long-term holders feel pressure
• Short-term traders are already exhausted
Extended red sequences reflect structural stress. Capital rotates out. Conviction weakens. Volatility begins to compress after repeated downside.
But here’s what history shows:
When downside becomes repetitive, reaction energy builds.
Markets don’t trend linearly forever. Persistent monthly declines often push positioning to an extreme. And extremes are where inflection potential increases — not because price “must” reverse, but because risk becomes more asymmetrical.
2018 taught that prolonged weakness can precede a major reset phase.
The key isn’t just whether February closes red.
The real signal will be:
• Does downside momentum accelerate after the close?
• Or does volatility contract and absorption increase?
If breakdown continuation follows, the macro trend remains dominant.
If compression and higher-low structure begin forming, it signals transition — not euphoria, but stabilization.
Long monthly streaks don’t guarantee reversals.
They signal that the market is approaching a decision zone.
Pressure builds.
Liquidity thins.
Positioning stretches.
What happens next will define whether this is structural continuation… or late-stage exhaustion.
$BTC #Bitcoin #Crypto
{future}(BTCUSDT)
BTC 7-Year Record in Focus: Momentum Exhaustion or Structural Breakdown?
Bitcoin is approaching a macro statistic we haven’t seen since 2018.
If this month closes red, $BTC will print its longest streak of consecutive monthly declines in seven years. That’s not just a headline number — that’s higher-timeframe momentum compression.
On the monthly chart, streaks like this rarely happen in random conditions. They usually appear when:
• Liquidity is tight
• Sentiment is damaged
• Long-term holders feel pressure
• Short-term traders are already exhausted
Extended red sequences reflect structural stress. Capital rotates out. Conviction weakens. Volatility begins to compress after repeated downside.
But here’s what history shows:
When downside becomes repetitive, reaction energy builds.
Markets don’t trend linearly forever. Persistent monthly declines often push positioning to an extreme. And extremes are where inflection potential increases — not because price “must” reverse, but because risk becomes more asymmetrical.
2018 taught that prolonged weakness can precede a major reset phase.
The key isn’t just whether February closes red.
The real signal will be:
• Does downside momentum accelerate after the close?
• Or does volatility contract and absorption increase?
If breakdown continuation follows, the macro trend remains dominant.
If compression and higher-low structure begin forming, it signals transition — not euphoria, but stabilization.
Long monthly streaks don’t guarantee reversals.
They signal that the market is approaching a decision zone.
Pressure builds.
Liquidity thins.
Positioning stretches.
What happens next will define whether this is structural continuation… or late-stage exhaustion.
$BTC #Bitcoin #Crypto
If this month closes red, $BTC will print its longest streak of consecutive monthly declines in seven years. That’s not just a headline number — that’s higher-timeframe momentum compression.
On the monthly chart, streaks like this rarely happen in random conditions. They usually appear when:
• Liquidity is tight
• Sentiment is damaged
• Long-term holders feel pressure
• Short-term traders are already exhausted
Extended red sequences reflect structural stress. Capital rotates out. Conviction weakens. Volatility begins to compress after repeated downside.
But here’s what history shows:
When downside becomes repetitive, reaction energy builds.
Markets don’t trend linearly forever. Persistent monthly declines often push positioning to an extreme. And extremes are where inflection potential increases — not because price “must” reverse, but because risk becomes more asymmetrical.
2018 taught that prolonged weakness can precede a major reset phase.
The key isn’t just whether February closes red.
The real signal will be:
• Does downside momentum accelerate after the close?
• Or does volatility contract and absorption increase?
If breakdown continuation follows, the macro trend remains dominant.
If compression and higher-low structure begin forming, it signals transition — not euphoria, but stabilization.
Long monthly streaks don’t guarantee reversals.
They signal that the market is approaching a decision zone.
Pressure builds.
Liquidity thins.
Positioning stretches.
What happens next will define whether this is structural continuation… or late-stage exhaustion.
$BTC #Bitcoin #Crypto
5
1
23
20.2k
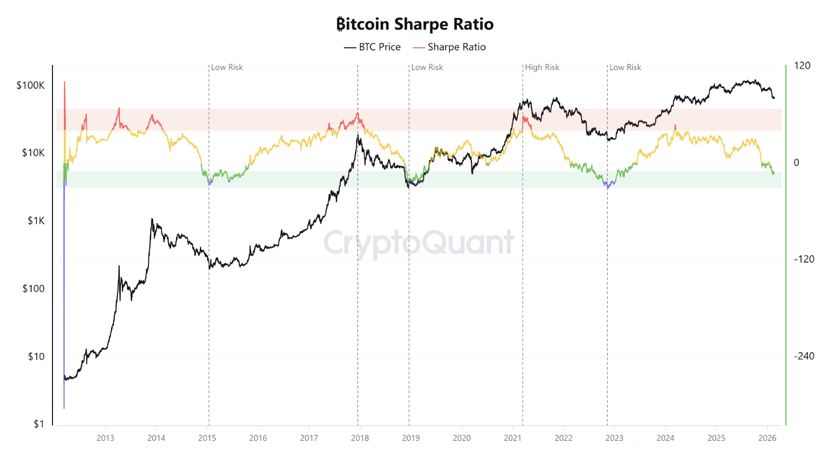
Статья
Bitcoin Sharpe Ratio: Why -11.6 Is Getting AttentionMost traders stare at price.
Smarter capital watches risk-adjusted return.
That’s where the Sharpe Ratio comes in.
What the Sharpe Ratio Really Measures
Think of it this way:
If Bitcoin delivers strong returns with controlled volatility, the Sharpe Ratio rises.
If Bitcoin delivers weak (or negative) returns with high volatility, the Sharpe collapses.
Formulaically:
Sharpe = (Return − Risk-Free Rate) / Volatility
In simple terms:
• High Sharpe → Strong reward relative to risk
• Low Sharpe → Weak reward relative to risk
• Negative Sharpe → You’re taking risk… and not getting paid for it
It doesn’t predict direction.
It measures efficiency.
What Does -11.6 Actually Signal?
A reading near -11.6 means volatility has remained elevated while returns have been deeply negative. Investors are experiencing drawdown without compensation.
Historically, when the Sharpe Ratio pushed into deeply negative territory:
• 2015 cycle low
• 2019 cycle reset
• 2023 structural bottom
In each of those cases, Sharpe hovered near or inside extreme negative zones before major recoveries began.
That doesn’t mean price instantly reversed.
It means risk/reward asymmetry improved dramatically.
Why This Zone Matters
When Sharpe collapses:
• Weak hands are already shaken out
• Returns have underperformed volatility
• Sentiment is damaged
• Risk is visibly high
But paradoxically, this is when forward reward potential historically improves — not because risk disappears, but because much of the downside repricing has already occurred.
It’s not a “buy signal.”
It’s a compression signal.
Bottom or Bottom Zone?
Sharpe doesn’t call exact bottoms.
It defines environments.
A deeply negative Sharpe reading suggests:
• You are late in the risk-adjustment phase
• Reward has been suppressed
• Volatility has already punished positioning
Could the zone go deeper? Yes.
Could it stabilize and reverse? Also yes.
The key is what happens next:
If volatility compresses while returns stabilize, Sharpe turns upward — and historically, that’s when trend shifts begin.
The Big Picture
A -11.6 Sharpe Ratio doesn’t scream “bottom confirmed.”
It whispers something more important:
The market has already paid a heavy emotional and volatility cost.
And historically, those environments have preceded the rebuilding phase — not the euphoric one.
Risk is visible.
Reward is compressed.
That’s usually when asymmetry begins to tilt.
$BTC #Bitcoin #Crypto
{future}(BTCUSDT)
Bitcoin Sharpe Ratio: Why -11.6 Is Getting Attention
Most traders stare at price.
Smarter capital watches risk-adjusted return.
That’s where the Sharpe Ratio comes in.
What the Sharpe Ratio Really Measures
Think of it this way:
If Bitcoin delivers strong returns with controlled volatility, the Sharpe Ratio rises.
If Bitcoin delivers weak (or negative) returns with high volatility, the Sharpe collapses.
Formulaically:
Sharpe = (Return − Risk-Free Rate) / Volatility
In simple terms:
• High Sharpe → Strong reward relative to risk
• Low Sharpe → Weak reward relative to risk
• Negative Sharpe → You’re taking risk… and not getting paid for it
It doesn’t predict direction.
It measures efficiency.
What Does -11.6 Actually Signal?
A reading near -11.6 means volatility has remained elevated while returns have been deeply negative. Investors are experiencing drawdown without compensation.
Historically, when the Sharpe Ratio pushed into deeply negative territory:
• 2015 cycle low
• 2019 cycle reset
• 2023 structural bottom
In each of those cases, Sharpe hovered near or inside extreme negative zones before major recoveries began.
That doesn’t mean price instantly reversed.
It means risk/reward asymmetry improved dramatically.
Why This Zone Matters
When Sharpe collapses:
• Weak hands are already shaken out
• Returns have underperformed volatility
• Sentiment is damaged
• Risk is visibly high
But paradoxically, this is when forward reward potential historically improves — not because risk disappears, but because much of the downside repricing has already occurred.
It’s not a “buy signal.”
It’s a compression signal.
Bottom or Bottom Zone?
Sharpe doesn’t call exact bottoms.
It defines environments.
A deeply negative Sharpe reading suggests:
• You are late in the risk-adjustment phase
• Reward has been suppressed
• Volatility has already punished positioning
Could the zone go deeper? Yes.
Could it stabilize and reverse? Also yes.
The key is what happens next:
If volatility compresses while returns stabilize, Sharpe turns upward — and historically, that’s when trend shifts begin.
The Big Picture
A -11.6 Sharpe Ratio doesn’t scream “bottom confirmed.”
It whispers something more important:
The market has already paid a heavy emotional and volatility cost.
And historically, those environments have preceded the rebuilding phase — not the euphoric one.
Risk is visible.
Reward is compressed.
That’s usually when asymmetry begins to tilt.
$BTC #Bitcoin #Crypto
Smarter capital watches risk-adjusted return.
That’s where the Sharpe Ratio comes in.
What the Sharpe Ratio Really Measures
Think of it this way:
If Bitcoin delivers strong returns with controlled volatility, the Sharpe Ratio rises.
If Bitcoin delivers weak (or negative) returns with high volatility, the Sharpe collapses.
Formulaically:
Sharpe = (Return − Risk-Free Rate) / Volatility
In simple terms:
• High Sharpe → Strong reward relative to risk
• Low Sharpe → Weak reward relative to risk
• Negative Sharpe → You’re taking risk… and not getting paid for it
It doesn’t predict direction.
It measures efficiency.
What Does -11.6 Actually Signal?
A reading near -11.6 means volatility has remained elevated while returns have been deeply negative. Investors are experiencing drawdown without compensation.
Historically, when the Sharpe Ratio pushed into deeply negative territory:
• 2015 cycle low
• 2019 cycle reset
• 2023 structural bottom
In each of those cases, Sharpe hovered near or inside extreme negative zones before major recoveries began.
That doesn’t mean price instantly reversed.
It means risk/reward asymmetry improved dramatically.
Why This Zone Matters
When Sharpe collapses:
• Weak hands are already shaken out
• Returns have underperformed volatility
• Sentiment is damaged
• Risk is visibly high
But paradoxically, this is when forward reward potential historically improves — not because risk disappears, but because much of the downside repricing has already occurred.
It’s not a “buy signal.”
It’s a compression signal.
Bottom or Bottom Zone?
Sharpe doesn’t call exact bottoms.
It defines environments.
A deeply negative Sharpe reading suggests:
• You are late in the risk-adjustment phase
• Reward has been suppressed
• Volatility has already punished positioning
Could the zone go deeper? Yes.
Could it stabilize and reverse? Also yes.
The key is what happens next:
If volatility compresses while returns stabilize, Sharpe turns upward — and historically, that’s when trend shifts begin.
The Big Picture
A -11.6 Sharpe Ratio doesn’t scream “bottom confirmed.”
It whispers something more important:
The market has already paid a heavy emotional and volatility cost.
And historically, those environments have preceded the rebuilding phase — not the euphoric one.
Risk is visible.
Reward is compressed.
That’s usually when asymmetry begins to tilt.
$BTC #Bitcoin #Crypto
8
14.2k
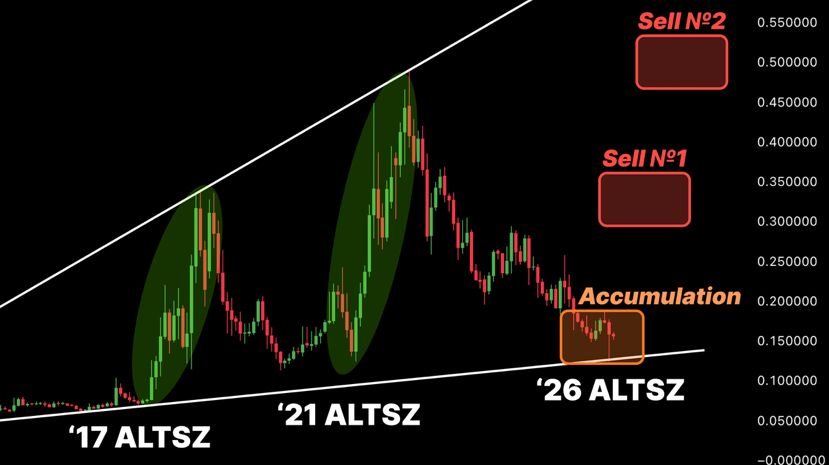
Статья
BTC $1M Blueprint? The Quiet Phase Before the RotationSomething subtle is happening beneath the surface.
The ratio structure between Bitcoin and alts is compressing again — not violently, not emotionally… just quietly. And historically, the quiet phases are the ones that matter most.
Look back at 2017.
Look back at 2021.
Both cycles shared the same rhythm:
• Extended underperformance against BTC
• Months of boredom and disbelief
• Slow capital positioning
• Then sudden, aggressive expansion
Right now feels similar.
The Compression Phase
Alt/BTC structure isn’t exploding — it’s coiling.
Dominance has pushed hard for months.
Sentiment toward alts is muted.
Liquidity is selective, not euphoric.
That’s typically how rotation begins — not with noise, but with positioning.
Smart capital doesn’t wait for narratives to trend.
It accumulates during indifference.
The Classic Cycle Playbook
The recurring strategy across cycles has been simple:
Accumulate during boredom.
Hold through skepticism.
Distribute into retail FOMO 60–120 days later.
But cycles evolve.
Liquidity conditions today are tighter.
Macro sensitivity is higher.
Institutional flows change rotation speed.
Not every consolidation becomes a 100x expansion.
Structure matters. Timing matters. Liquidity matters more than ever.
What Makes This Different
In prior cycles, retail frenzy fueled altseason.
Now?
Capital rotates faster.
Narratives mature quicker.
Momentum phases compress in time.
If a rotation begins, it may be sharper — and shorter.
The window may not stay open long.
The Real Question
Is this early-stage accumulation before Altseason 2026…
Or just another false rotation inside a broader BTC-dominant regime?
The chart won’t announce it.
It will shift quietly — then suddenly.
And by the time it feels obvious, positioning will already be crowded.
Smart money moves before the story spreads.
$BTC #Bitcoin #Crypto
{future}(BTCUSDT)
BTC $1M Blueprint? The Quiet Phase Before the Rotation
Something subtle is happening beneath the surface.
The ratio structure between Bitcoin and alts is compressing again — not violently, not emotionally… just quietly. And historically, the quiet phases are the ones that matter most.
Look back at 2017.
Look back at 2021.
Both cycles shared the same rhythm:
• Extended underperformance against BTC
• Months of boredom and disbelief
• Slow capital positioning
• Then sudden, aggressive expansion
Right now feels similar.
The Compression Phase
Alt/BTC structure isn’t exploding — it’s coiling.
Dominance has pushed hard for months.
Sentiment toward alts is muted.
Liquidity is selective, not euphoric.
That’s typically how rotation begins — not with noise, but with positioning.
Smart capital doesn’t wait for narratives to trend.
It accumulates during indifference.
The Classic Cycle Playbook
The recurring strategy across cycles has been simple:
Accumulate during boredom.
Hold through skepticism.
Distribute into retail FOMO 60–120 days later.
But cycles evolve.
Liquidity conditions today are tighter.
Macro sensitivity is higher.
Institutional flows change rotation speed.
Not every consolidation becomes a 100x expansion.
Structure matters. Timing matters. Liquidity matters more than ever.
What Makes This Different
In prior cycles, retail frenzy fueled altseason.
Now?
Capital rotates faster.
Narratives mature quicker.
Momentum phases compress in time.
If a rotation begins, it may be sharper — and shorter.
The window may not stay open long.
The Real Question
Is this early-stage accumulation before Altseason 2026…
Or just another false rotation inside a broader BTC-dominant regime?
The chart won’t announce it.
It will shift quietly — then suddenly.
And by the time it feels obvious, positioning will already be crowded.
Smart money moves before the story spreads.
$BTC #Bitcoin #Crypto
The ratio structure between Bitcoin and alts is compressing again — not violently, not emotionally… just quietly. And historically, the quiet phases are the ones that matter most.
Look back at 2017.
Look back at 2021.
Both cycles shared the same rhythm:
• Extended underperformance against BTC
• Months of boredom and disbelief
• Slow capital positioning
• Then sudden, aggressive expansion
Right now feels similar.
The Compression Phase
Alt/BTC structure isn’t exploding — it’s coiling.
Dominance has pushed hard for months.
Sentiment toward alts is muted.
Liquidity is selective, not euphoric.
That’s typically how rotation begins — not with noise, but with positioning.
Smart capital doesn’t wait for narratives to trend.
It accumulates during indifference.
The Classic Cycle Playbook
The recurring strategy across cycles has been simple:
Accumulate during boredom.
Hold through skepticism.
Distribute into retail FOMO 60–120 days later.
But cycles evolve.
Liquidity conditions today are tighter.
Macro sensitivity is higher.
Institutional flows change rotation speed.
Not every consolidation becomes a 100x expansion.
Structure matters. Timing matters. Liquidity matters more than ever.
What Makes This Different
In prior cycles, retail frenzy fueled altseason.
Now?
Capital rotates faster.
Narratives mature quicker.
Momentum phases compress in time.
If a rotation begins, it may be sharper — and shorter.
The window may not stay open long.
The Real Question
Is this early-stage accumulation before Altseason 2026…
Or just another false rotation inside a broader BTC-dominant regime?
The chart won’t announce it.
It will shift quietly — then suddenly.
And by the time it feels obvious, positioning will already be crowded.
Smart money moves before the story spreads.
$BTC #Bitcoin #Crypto
12
13.9k
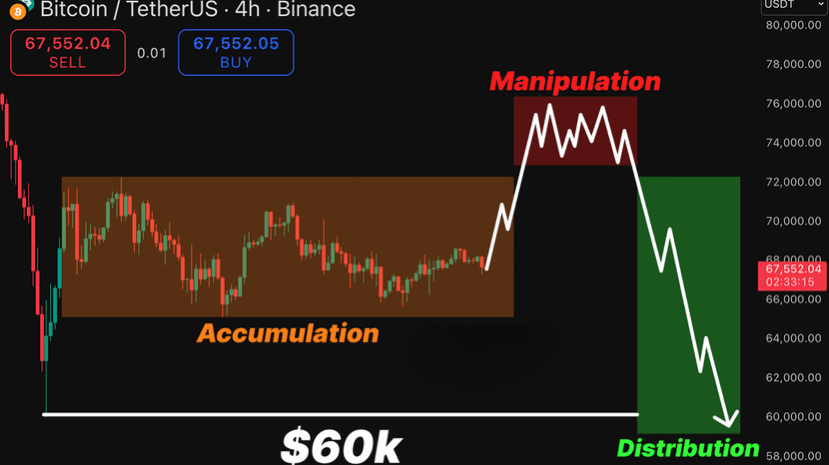
Статья
BTC AMD Structure Building? Liquidity Trap Potential Near $75KZoom out and the structure becomes clear.
Bitcoin has been compressing above $60K in what looks like a clean Accumulation range — tight consolidation, overlapping candles, failed breakdown attempts, and steady liquidity development on both sides.
That’s Phase 1.
Now comes the part most traders misread: Manipulation.
Why $74K–$75K Matters
If the AMD (Accumulation → Manipulation → Distribution) model unfolds, the next move could be a sharp expansion toward $74K–$75K.
That zone is loaded with:
• Prior breakdown structure
• Resting stop liquidity
• Breakout trader entries
• Short squeeze fuel
A fast move there would look explosive.
It would feel like confirmation.
Momentum would flip bullish.
Social sentiment would shift.
Late longs would chase.
And that’s exactly what manipulation phases are designed to trigger.
What Happens After the Grab?
If absorption fails at $75K, the model suggests:
• Heavy supply enters
• Liquidity above gets harvested
• Price rotates sharply
• $60K gets revisited
That’s the Distribution phase — where strong hands offload into strength and weak hands get trapped.
Markets don’t move based on hope.
They move toward liquidity pools.
And liquidity is clearly sitting above this range.
The Key Isn’t the Spike — It’s the Reaction
A spike alone doesn’t confirm a trap.
The reaction does.
• Acceptance above $75K + consolidation → structural repair
• Fast rejection + heavy selling → classic liquidity sweep
This is a precision zone.
What Makes This Dangerous
Sideways markets exhaust traders.
They create frustration.
Then when the breakout finally comes, emotion overrides discipline.
That’s when traps work best.
Right now, BTC is coiling.
If $75K gets tagged, don’t focus on the candle.
Focus on whether the market holds or rejects.
That’s where the game changes.
$BTC #Bitcoin #Crypto
{future}(BTCUSDT)
BTC AMD Structure Building? Liquidity Trap Potential Near $75K
Zoom out and the structure becomes clear.
Bitcoin has been compressing above $60K in what looks like a clean Accumulation range — tight consolidation, overlapping candles, failed breakdown attempts, and steady liquidity development on both sides.
That’s Phase 1.
Now comes the part most traders misread: Manipulation.
Why $74K–$75K Matters
If the AMD (Accumulation → Manipulation → Distribution) model unfolds, the next move could be a sharp expansion toward $74K–$75K.
That zone is loaded with:
• Prior breakdown structure
• Resting stop liquidity
• Breakout trader entries
• Short squeeze fuel
A fast move there would look explosive.
It would feel like confirmation.
Momentum would flip bullish.
Social sentiment would shift.
Late longs would chase.
And that’s exactly what manipulation phases are designed to trigger.
What Happens After the Grab?
If absorption fails at $75K, the model suggests:
• Heavy supply enters
• Liquidity above gets harvested
• Price rotates sharply
• $60K gets revisited
That’s the Distribution phase — where strong hands offload into strength and weak hands get trapped.
Markets don’t move based on hope.
They move toward liquidity pools.
And liquidity is clearly sitting above this range.
The Key Isn’t the Spike — It’s the Reaction
A spike alone doesn’t confirm a trap.
The reaction does.
• Acceptance above $75K + consolidation → structural repair
• Fast rejection + heavy selling → classic liquidity sweep
This is a precision zone.
What Makes This Dangerous
Sideways markets exhaust traders.
They create frustration.
Then when the breakout finally comes, emotion overrides discipline.
That’s when traps work best.
Right now, BTC is coiling.
If $75K gets tagged, don’t focus on the candle.
Focus on whether the market holds or rejects.
That’s where the game changes.
$BTC #Bitcoin #Crypto
Bitcoin has been compressing above $60K in what looks like a clean Accumulation range — tight consolidation, overlapping candles, failed breakdown attempts, and steady liquidity development on both sides.
That’s Phase 1.
Now comes the part most traders misread: Manipulation.
Why $74K–$75K Matters
If the AMD (Accumulation → Manipulation → Distribution) model unfolds, the next move could be a sharp expansion toward $74K–$75K.
That zone is loaded with:
• Prior breakdown structure
• Resting stop liquidity
• Breakout trader entries
• Short squeeze fuel
A fast move there would look explosive.
It would feel like confirmation.
Momentum would flip bullish.
Social sentiment would shift.
Late longs would chase.
And that’s exactly what manipulation phases are designed to trigger.
What Happens After the Grab?
If absorption fails at $75K, the model suggests:
• Heavy supply enters
• Liquidity above gets harvested
• Price rotates sharply
• $60K gets revisited
That’s the Distribution phase — where strong hands offload into strength and weak hands get trapped.
Markets don’t move based on hope.
They move toward liquidity pools.
And liquidity is clearly sitting above this range.
The Key Isn’t the Spike — It’s the Reaction
A spike alone doesn’t confirm a trap.
The reaction does.
• Acceptance above $75K + consolidation → structural repair
• Fast rejection + heavy selling → classic liquidity sweep
This is a precision zone.
What Makes This Dangerous
Sideways markets exhaust traders.
They create frustration.
Then when the breakout finally comes, emotion overrides discipline.
That’s when traps work best.
Right now, BTC is coiling.
If $75K gets tagged, don’t focus on the candle.
Focus on whether the market holds or rejects.
That’s where the game changes.
$BTC #Bitcoin #Crypto
2
18
11.5k
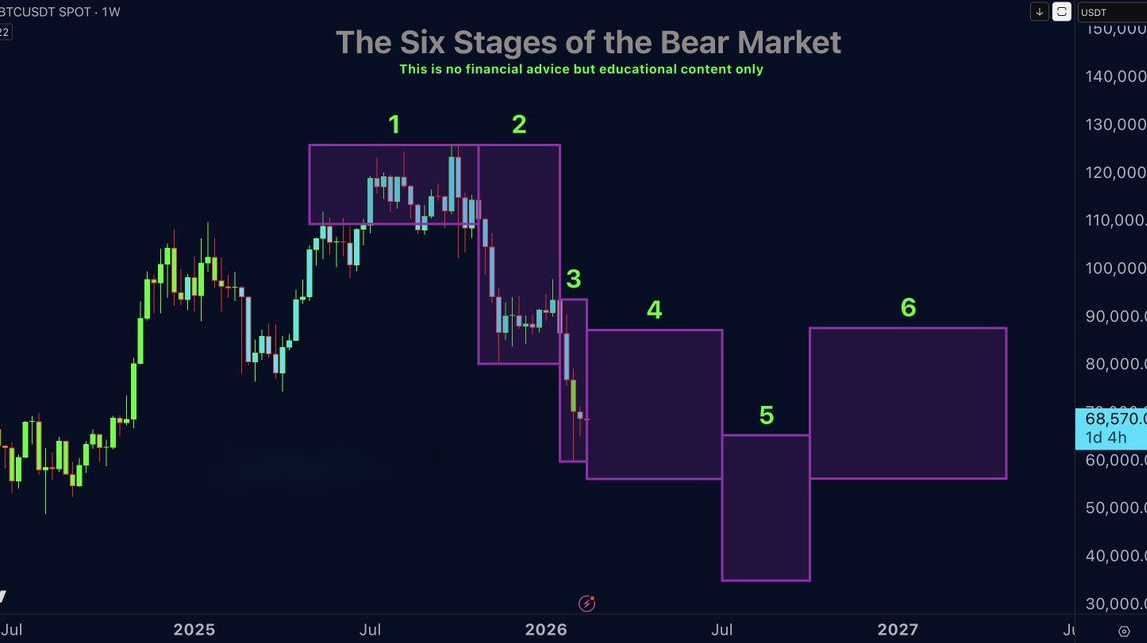
Статья
BTC The Big Sunday Framework — Where Are We in the Cycle?I don’t view this market as random volatility.
I view it as a structured six-stage process that repeats every cycle because the drivers repeat: liquidity mechanics, leverage expansion and collapse, and predictable human behavior under stress.
Right now, $BTC is in Stage 4 of this bear market sequence.
Let’s break the structure down clearly.
Stage 1 — Euphoria & Leverage Saturation
This was the 115K–125K phase.
• Extreme bullish sentiment
• Aggressive upside spikes
• Sideways grind at elevated levels
• “Risk has disappeared” psychology
• Absurd price targets everywhere
Under the surface, the market was overleveraged and overloaded with late entrants. This stage always ends quietly before it ends violently.
Stage 2 — Psychological Breakdown
The key level this cycle: $100K.
Once that level broke, the tone shifted instantly.
This phase is designed to:
• Shock short-term investors
• Trigger leverage liquidations
• Remove reaction time
• Create panic before recalibration
The October 10 crash — the largest liquidation event in crypto history — fits perfectly here. It was fast, intentional, mechanical.
Retail didn’t react. The market moved first.
Stage 3 — Mechanical Repricing & Bear Confirmation
After psychology cracks, speed increases.
From 97K to 60K in roughly 30 days — nearly a 50% wipeout of market cap.
This is the fastest, most brutal phase.
• No time to hedge
• No time to reduce exposure
• Leverage forced out
• Panic widespread
Stage 3 confirms the bear structurally.
The violent mechanical flush is likely behind us.
Stage 4 — Dehydration & Psychological Torture (Current Phase)
This is where we are now.
Stage 4 is not violent. It is exhausting.
• Sideways movement inside a defined range
• Fake breakouts and breakdowns
• Liquidity traps above and below
• Weak hands slowly giving up
Sideways markets create the most liquidity.
They trap breakout buyers.
They trap breakdown sellers.
They frustrate everyone.
Retail says:
“Better to sell now — it will drop another 30–40%.”
This is when short-term holder capitulation peaks — and on-chain data confirms that behavior.
I expect the range to persist for months, not weeks.
Short-term, I’ve placed bids between 57–60K for tactical bounces — but this does not change my broader expectation of lower targets later.
Stage 5 — True Capitulation
This is emotional destruction.
• Panic among experienced holders
• Forced selling
• Possible exchange failures or macro shock
• Black swan narratives
Originally I projected 50–60K as bottom.
Then 40–50K.
With current macro stress (REPO markets, global liquidity tightening), I now consider 35–45K the ultimate capitulation zone.
That would represent the final liquidity grab.
Stage 6 — Stabilization & Structural Reversal
This is when:
• Volatility remains high
• Sentiment screams for 10K
• Retail wants “just one more drop”
• Large players accumulate aggressively
Retail always misses this phase.
They sell Stage 4.
They panic in Stage 5.
They wait for lower prices in Stage 6.
Then the next bull begins without them.
Where We Stand
Stage 4.
The violent mechanical crash is likely behind us.
Now comes the psychological damage phase.
Regret.
Recalculation.
Delayed exit plans.
The biggest lesson remains:
When price moves fast → reaction time disappears.
When price moves slowly → discipline disappears.
Understanding the stage prevents emotional decision-making.
My heavy accumulation begins between Stage 5 and Stage 6 — not before.
This pattern has repeated across every Bitcoin cycle.
Liquidity changes. Macro changes.
Human behavior does not.
$BTC #Bitcoin #Crypto
{future}(BTCUSDT)
BTC The Big Sunday Framework — Where Are We in the Cycle?
I don’t view this market as random volatility.
I view it as a structured six-stage process that repeats every cycle because the drivers repeat: liquidity mechanics, leverage expansion and collapse, and predictable human behavior under stress.
Right now, $BTC is in Stage 4 of this bear market sequence.
Let’s break the structure down clearly.
Stage 1 — Euphoria & Leverage Saturation
This was the 115K–125K phase.
• Extreme bullish sentiment
• Aggressive upside spikes
• Sideways grind at elevated levels
• “Risk has disappeared” psychology
• Absurd price targets everywhere
Under the surface, the market was overleveraged and overloaded with late entrants. This stage always ends quietly before it ends violently.
Stage 2 — Psychological Breakdown
The key level this cycle: $100K.
Once that level broke, the tone shifted instantly.
This phase is designed to:
• Shock short-term investors
• Trigger leverage liquidations
• Remove reaction time
• Create panic before recalibration
The October 10 crash — the largest liquidation event in crypto history — fits perfectly here. It was fast, intentional, mechanical.
Retail didn’t react. The market moved first.
Stage 3 — Mechanical Repricing & Bear Confirmation
After psychology cracks, speed increases.
From 97K to 60K in roughly 30 days — nearly a 50% wipeout of market cap.
This is the fastest, most brutal phase.
• No time to hedge
• No time to reduce exposure
• Leverage forced out
• Panic widespread
Stage 3 confirms the bear structurally.
The violent mechanical flush is likely behind us.
Stage 4 — Dehydration & Psychological Torture (Current Phase)
This is where we are now.
Stage 4 is not violent. It is exhausting.
• Sideways movement inside a defined range
• Fake breakouts and breakdowns
• Liquidity traps above and below
• Weak hands slowly giving up
Sideways markets create the most liquidity.
They trap breakout buyers.
They trap breakdown sellers.
They frustrate everyone.
Retail says:
“Better to sell now — it will drop another 30–40%.”
This is when short-term holder capitulation peaks — and on-chain data confirms that behavior.
I expect the range to persist for months, not weeks.
Short-term, I’ve placed bids between 57–60K for tactical bounces — but this does not change my broader expectation of lower targets later.
Stage 5 — True Capitulation
This is emotional destruction.
• Panic among experienced holders
• Forced selling
• Possible exchange failures or macro shock
• Black swan narratives
Originally I projected 50–60K as bottom.
Then 40–50K.
With current macro stress (REPO markets, global liquidity tightening), I now consider 35–45K the ultimate capitulation zone.
That would represent the final liquidity grab.
Stage 6 — Stabilization & Structural Reversal
This is when:
• Volatility remains high
• Sentiment screams for 10K
• Retail wants “just one more drop”
• Large players accumulate aggressively
Retail always misses this phase.
They sell Stage 4.
They panic in Stage 5.
They wait for lower prices in Stage 6.
Then the next bull begins without them.
Where We Stand
Stage 4.
The violent mechanical crash is likely behind us.
Now comes the psychological damage phase.
Regret.
Recalculation.
Delayed exit plans.
The biggest lesson remains:
When price moves fast → reaction time disappears.
When price moves slowly → discipline disappears.
Understanding the stage prevents emotional decision-making.
My heavy accumulation begins between Stage 5 and Stage 6 — not before.
This pattern has repeated across every Bitcoin cycle.
Liquidity changes. Macro changes.
Human behavior does not.
$BTC #Bitcoin #Crypto
I view it as a structured six-stage process that repeats every cycle because the drivers repeat: liquidity mechanics, leverage expansion and collapse, and predictable human behavior under stress.
Right now, $BTC is in Stage 4 of this bear market sequence.
Let’s break the structure down clearly.
Stage 1 — Euphoria & Leverage Saturation
This was the 115K–125K phase.
• Extreme bullish sentiment
• Aggressive upside spikes
• Sideways grind at elevated levels
• “Risk has disappeared” psychology
• Absurd price targets everywhere
Under the surface, the market was overleveraged and overloaded with late entrants. This stage always ends quietly before it ends violently.
Stage 2 — Psychological Breakdown
The key level this cycle: $100K.
Once that level broke, the tone shifted instantly.
This phase is designed to:
• Shock short-term investors
• Trigger leverage liquidations
• Remove reaction time
• Create panic before recalibration
The October 10 crash — the largest liquidation event in crypto history — fits perfectly here. It was fast, intentional, mechanical.
Retail didn’t react. The market moved first.
Stage 3 — Mechanical Repricing & Bear Confirmation
After psychology cracks, speed increases.
From 97K to 60K in roughly 30 days — nearly a 50% wipeout of market cap.
This is the fastest, most brutal phase.
• No time to hedge
• No time to reduce exposure
• Leverage forced out
• Panic widespread
Stage 3 confirms the bear structurally.
The violent mechanical flush is likely behind us.
Stage 4 — Dehydration & Psychological Torture (Current Phase)
This is where we are now.
Stage 4 is not violent. It is exhausting.
• Sideways movement inside a defined range
• Fake breakouts and breakdowns
• Liquidity traps above and below
• Weak hands slowly giving up
Sideways markets create the most liquidity.
They trap breakout buyers.
They trap breakdown sellers.
They frustrate everyone.
Retail says:
“Better to sell now — it will drop another 30–40%.”
This is when short-term holder capitulation peaks — and on-chain data confirms that behavior.
I expect the range to persist for months, not weeks.
Short-term, I’ve placed bids between 57–60K for tactical bounces — but this does not change my broader expectation of lower targets later.
Stage 5 — True Capitulation
This is emotional destruction.
• Panic among experienced holders
• Forced selling
• Possible exchange failures or macro shock
• Black swan narratives
Originally I projected 50–60K as bottom.
Then 40–50K.
With current macro stress (REPO markets, global liquidity tightening), I now consider 35–45K the ultimate capitulation zone.
That would represent the final liquidity grab.
Stage 6 — Stabilization & Structural Reversal
This is when:
• Volatility remains high
• Sentiment screams for 10K
• Retail wants “just one more drop”
• Large players accumulate aggressively
Retail always misses this phase.
They sell Stage 4.
They panic in Stage 5.
They wait for lower prices in Stage 6.
Then the next bull begins without them.
Where We Stand
Stage 4.
The violent mechanical crash is likely behind us.
Now comes the psychological damage phase.
Regret.
Recalculation.
Delayed exit plans.
The biggest lesson remains:
When price moves fast → reaction time disappears.
When price moves slowly → discipline disappears.
Understanding the stage prevents emotional decision-making.
My heavy accumulation begins between Stage 5 and Stage 6 — not before.
This pattern has repeated across every Bitcoin cycle.
Liquidity changes. Macro changes.
Human behavior does not.
$BTC #Bitcoin #Crypto
13
18.2k

Статья
BTC Higher Timeframe Elliott Structure Taking ShapeOn the higher timeframes, Bitcoin is beginning to resemble a broader corrective Elliott Wave sequence rather than a completed reset.
The decline from the cycle high can be interpreted as a developing 1–4 structure — impulsive weakness followed by partial recoveries that failed to reclaim macro trend strength.
If that interpretation holds, a final Wave 5 extension lower could still be pending.
The $45K–$40K Zone: Why It Matters
A move into the $45K–$40K demand region would:
• Align with historical ~65–70% drawdowns seen in prior cycles
• Sweep deeper liquidity pockets
• Reset long-term leverage and sentiment
• Complete a textbook five-wave corrective structure
Previous macro cycles have shown similar proportional retracements before durable accumulation phases began.
From a structural perspective, that region would represent:
• Psychological capitulation
• Long-term value repricing
• Macro demand re-engagement zone
Historical Context
Bitcoin cycles have often followed this rhythm:
1. Extended bull expansion
2. Multi-leg corrective phase
3. Final exhaustion move
4. Prolonged accumulation
5. Next expansion wave
A potential bottoming or range-building phase into mid-2026 would not be structurally unusual — if the five-wave sequence completes as projected.
Important Distinction
Elliott Wave analysis is not prediction.
It’s probabilistic mapping.
Wave counts provide scenario frameworks — not guarantees.
Invalidation levels matter. Structure matters. Reaction at key zones matters more than the model itself.
What To Watch
For this corrective scenario to gain credibility:
• Lower highs must continue
• Major resistance levels must reject
• Downside momentum must persist
• Demand zones must show reaction before reversal
If price instead reclaims macro resistance decisively, the corrective count would require reevaluation.
Right now, the structure leans corrective — but unconfirmed.
The difference between continuation and reversal will likely be decided by how price behaves if and when the $45K–$40K region comes into play.
Elliott provides the roadmap.
The market provides the verdict.
$BTC #Bitcoin #Crypto
{future}(BTCUSDT)
BTC Higher Timeframe Elliott Structure Taking Shape
On the higher timeframes, Bitcoin is beginning to resemble a broader corrective Elliott Wave sequence rather than a completed reset.
The decline from the cycle high can be interpreted as a developing 1–4 structure — impulsive weakness followed by partial recoveries that failed to reclaim macro trend strength.
If that interpretation holds, a final Wave 5 extension lower could still be pending.
The $45K–$40K Zone: Why It Matters
A move into the $45K–$40K demand region would:
• Align with historical ~65–70% drawdowns seen in prior cycles
• Sweep deeper liquidity pockets
• Reset long-term leverage and sentiment
• Complete a textbook five-wave corrective structure
Previous macro cycles have shown similar proportional retracements before durable accumulation phases began.
From a structural perspective, that region would represent:
• Psychological capitulation
• Long-term value repricing
• Macro demand re-engagement zone
Historical Context
Bitcoin cycles have often followed this rhythm:
1. Extended bull expansion
2. Multi-leg corrective phase
3. Final exhaustion move
4. Prolonged accumulation
5. Next expansion wave
A potential bottoming or range-building phase into mid-2026 would not be structurally unusual — if the five-wave sequence completes as projected.
Important Distinction
Elliott Wave analysis is not prediction.
It’s probabilistic mapping.
Wave counts provide scenario frameworks — not guarantees.
Invalidation levels matter. Structure matters. Reaction at key zones matters more than the model itself.
What To Watch
For this corrective scenario to gain credibility:
• Lower highs must continue
• Major resistance levels must reject
• Downside momentum must persist
• Demand zones must show reaction before reversal
If price instead reclaims macro resistance decisively, the corrective count would require reevaluation.
Right now, the structure leans corrective — but unconfirmed.
The difference between continuation and reversal will likely be decided by how price behaves if and when the $45K–$40K region comes into play.
Elliott provides the roadmap.
The market provides the verdict.
$BTC #Bitcoin #Crypto
The decline from the cycle high can be interpreted as a developing 1–4 structure — impulsive weakness followed by partial recoveries that failed to reclaim macro trend strength.
If that interpretation holds, a final Wave 5 extension lower could still be pending.
The $45K–$40K Zone: Why It Matters
A move into the $45K–$40K demand region would:
• Align with historical ~65–70% drawdowns seen in prior cycles
• Sweep deeper liquidity pockets
• Reset long-term leverage and sentiment
• Complete a textbook five-wave corrective structure
Previous macro cycles have shown similar proportional retracements before durable accumulation phases began.
From a structural perspective, that region would represent:
• Psychological capitulation
• Long-term value repricing
• Macro demand re-engagement zone
Historical Context
Bitcoin cycles have often followed this rhythm:
1. Extended bull expansion
2. Multi-leg corrective phase
3. Final exhaustion move
4. Prolonged accumulation
5. Next expansion wave
A potential bottoming or range-building phase into mid-2026 would not be structurally unusual — if the five-wave sequence completes as projected.
Important Distinction
Elliott Wave analysis is not prediction.
It’s probabilistic mapping.
Wave counts provide scenario frameworks — not guarantees.
Invalidation levels matter. Structure matters. Reaction at key zones matters more than the model itself.
What To Watch
For this corrective scenario to gain credibility:
• Lower highs must continue
• Major resistance levels must reject
• Downside momentum must persist
• Demand zones must show reaction before reversal
If price instead reclaims macro resistance decisively, the corrective count would require reevaluation.
Right now, the structure leans corrective — but unconfirmed.
The difference between continuation and reversal will likely be decided by how price behaves if and when the $45K–$40K region comes into play.
Elliott provides the roadmap.
The market provides the verdict.
$BTC #Bitcoin #Crypto
18
12.7k
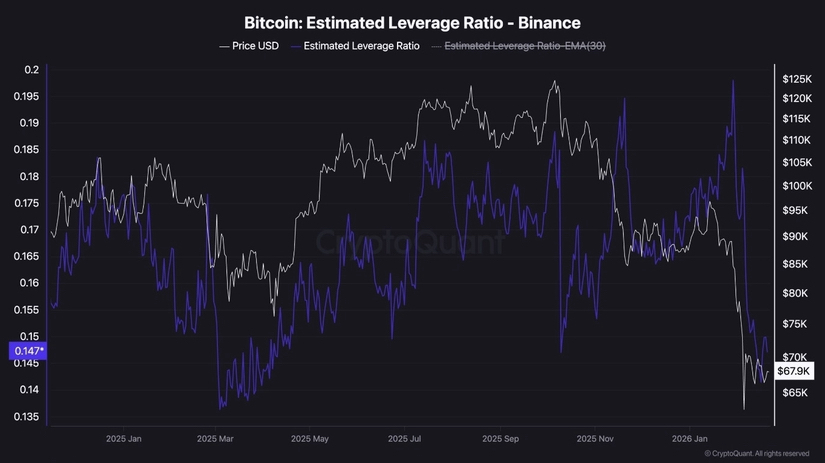
Статья
BTC Why the $70K Reclaim Matters More Than the BounceBitcoin’s flush toward the $60K region triggered sharp volatility — but now the market is attempting stabilization above a key demand pocket.
The real question isn’t whether BTC can bounce.
It’s whether it can reclaim and hold above $70K, because that level sits at the center of the current structural battle.
🔎 Daily Chart: Structure Still Leans Bearish
On the daily timeframe, $BTC remains inside a well-defined downward channel, consistently printing:
• Lower highs
• Lower lows
The latest sell-off tagged the $60K–$63K demand zone, where buyers stepped in and prevented immediate continuation lower.
However, the broader structure hasn’t flipped.
Price remains:
• Below the 100-day MA
• Below the 200-day MA
• With both averages sloping downward
That keeps macro momentum tilted bearish.
The $75K–$80K zone now acts as a strong supply cluster — aligning with prior breakdown structure.
Until BTC reclaims the mid-channel region and key moving averages, rallies should be treated as corrective, not impulsive.
The $60K level remains the structural line in the sand.
📉 4H Chart: Compression Before Expansion
On the 4-hour chart, price is coiling inside a tight symmetrical triangle after the bounce from $60K.
This reflects short-term equilibrium after high volatility.
• Upper trendline → immediate resistance
• Rising lower trendline → short-term support
Price is approaching the apex — meaning resolution is likely soon.
Upside Break Scenario
A clean breakout above the triangle could trigger a move toward:
• $74K–$76K
• Prior breakdown supply
• Liquidity cluster near previous rejection zones
Downside Break Scenario
Failure to break higher could lead to:
• Retest of $60K demand
• Possible liquidity sweep below it
• Expansion deeper into channel structure
Compression rarely lasts long.
📊 Sentiment & Leverage Reset
One key development: Estimated Leverage Ratio on Binance has dropped sharply.
That tells us:
• Excessive leveraged positions have been wiped
• Speculative froth has been cleared
• Near-term systemic fragility has reduced
Leverage now sits at much lower levels.
That lowers immediate squeeze risk — but also creates room for leverage to rebuild, which could amplify the next directional breakout.
🎯 Why $70K Is the Pivot
$70K isn’t just psychological.
It represents:
• Breakdown structure
• Lower high territory
• Channel midpoint
• Short-term liquidity pivot
A sustained reclaim above $70K would:
• Break lower-high rhythm
• Improve short-term structure
• Open path toward $75K supply
Failure to reclaim it keeps the structure corrective and vulnerable.
The Current Setup
Bitcoin is at a delicate inflection point:
• Daily demand is holding
• 4H compression is tightening
• Leverage has reset
• Structure remains fragile
The next major move likely begins with a decisive triangle break.
$60K defines downside risk.
$70K defines structural repair.
$75K defines first macro supply test.
The market is coiled.
Now it’s waiting.
$BTC #Bitcoin #Crypto
{future}(BTCUSDT)
BTC Why the $70K Reclaim Matters More Than the Bounce
Bitcoin’s flush toward the $60K region triggered sharp volatility — but now the market is attempting stabilization above a key demand pocket.
The real question isn’t whether BTC can bounce.
It’s whether it can reclaim and hold above $70K, because that level sits at the center of the current structural battle.
🔎 Daily Chart: Structure Still Leans Bearish
On the daily timeframe, $BTC remains inside a well-defined downward channel, consistently printing:
• Lower highs
• Lower lows
The latest sell-off tagged the $60K–$63K demand zone, where buyers stepped in and prevented immediate continuation lower.
However, the broader structure hasn’t flipped.
Price remains:
• Below the 100-day MA
• Below the 200-day MA
• With both averages sloping downward
That keeps macro momentum tilted bearish.
The $75K–$80K zone now acts as a strong supply cluster — aligning with prior breakdown structure.
Until BTC reclaims the mid-channel region and key moving averages, rallies should be treated as corrective, not impulsive.
The $60K level remains the structural line in the sand.
📉 4H Chart: Compression Before Expansion
On the 4-hour chart, price is coiling inside a tight symmetrical triangle after the bounce from $60K.
This reflects short-term equilibrium after high volatility.
• Upper trendline → immediate resistance
• Rising lower trendline → short-term support
Price is approaching the apex — meaning resolution is likely soon.
Upside Break Scenario
A clean breakout above the triangle could trigger a move toward:
• $74K–$76K
• Prior breakdown supply
• Liquidity cluster near previous rejection zones
Downside Break Scenario
Failure to break higher could lead to:
• Retest of $60K demand
• Possible liquidity sweep below it
• Expansion deeper into channel structure
Compression rarely lasts long.
📊 Sentiment & Leverage Reset
One key development: Estimated Leverage Ratio on Binance has dropped sharply.
That tells us:
• Excessive leveraged positions have been wiped
• Speculative froth has been cleared
• Near-term systemic fragility has reduced
Leverage now sits at much lower levels.
That lowers immediate squeeze risk — but also creates room for leverage to rebuild, which could amplify the next directional breakout.
🎯 Why $70K Is the Pivot
$70K isn’t just psychological.
It represents:
• Breakdown structure
• Lower high territory
• Channel midpoint
• Short-term liquidity pivot
A sustained reclaim above $70K would:
• Break lower-high rhythm
• Improve short-term structure
• Open path toward $75K supply
Failure to reclaim it keeps the structure corrective and vulnerable.
The Current Setup
Bitcoin is at a delicate inflection point:
• Daily demand is holding
• 4H compression is tightening
• Leverage has reset
• Structure remains fragile
The next major move likely begins with a decisive triangle break.
$60K defines downside risk.
$70K defines structural repair.
$75K defines first macro supply test.
The market is coiled.
Now it’s waiting.
$BTC #Bitcoin #Crypto
The real question isn’t whether BTC can bounce.
It’s whether it can reclaim and hold above $70K, because that level sits at the center of the current structural battle.
🔎 Daily Chart: Structure Still Leans Bearish
On the daily timeframe, $BTC remains inside a well-defined downward channel, consistently printing:
• Lower highs
• Lower lows
The latest sell-off tagged the $60K–$63K demand zone, where buyers stepped in and prevented immediate continuation lower.
However, the broader structure hasn’t flipped.
Price remains:
• Below the 100-day MA
• Below the 200-day MA
• With both averages sloping downward
That keeps macro momentum tilted bearish.
The $75K–$80K zone now acts as a strong supply cluster — aligning with prior breakdown structure.
Until BTC reclaims the mid-channel region and key moving averages, rallies should be treated as corrective, not impulsive.
The $60K level remains the structural line in the sand.
📉 4H Chart: Compression Before Expansion
On the 4-hour chart, price is coiling inside a tight symmetrical triangle after the bounce from $60K.
This reflects short-term equilibrium after high volatility.
• Upper trendline → immediate resistance
• Rising lower trendline → short-term support
Price is approaching the apex — meaning resolution is likely soon.
Upside Break Scenario
A clean breakout above the triangle could trigger a move toward:
• $74K–$76K
• Prior breakdown supply
• Liquidity cluster near previous rejection zones
Downside Break Scenario
Failure to break higher could lead to:
• Retest of $60K demand
• Possible liquidity sweep below it
• Expansion deeper into channel structure
Compression rarely lasts long.
📊 Sentiment & Leverage Reset
One key development: Estimated Leverage Ratio on Binance has dropped sharply.
That tells us:
• Excessive leveraged positions have been wiped
• Speculative froth has been cleared
• Near-term systemic fragility has reduced
Leverage now sits at much lower levels.
That lowers immediate squeeze risk — but also creates room for leverage to rebuild, which could amplify the next directional breakout.
🎯 Why $70K Is the Pivot
$70K isn’t just psychological.
It represents:
• Breakdown structure
• Lower high territory
• Channel midpoint
• Short-term liquidity pivot
A sustained reclaim above $70K would:
• Break lower-high rhythm
• Improve short-term structure
• Open path toward $75K supply
Failure to reclaim it keeps the structure corrective and vulnerable.
The Current Setup
Bitcoin is at a delicate inflection point:
• Daily demand is holding
• 4H compression is tightening
• Leverage has reset
• Structure remains fragile
The next major move likely begins with a decisive triangle break.
$60K defines downside risk.
$70K defines structural repair.
$75K defines first macro supply test.
The market is coiled.
Now it’s waiting.
$BTC #Bitcoin #Crypto
11
13k
Войдите, чтобы посмотреть больше материала
Присоединяйтесь к пользователям криптовалют по всему миру на Binance Square
⚡️ Получайте новейшую и полезную информацию о криптоактивах.
💬 Нам доверяет крупнейшая в мире криптобиржа.
👍 Получите достоверные аналитические данные от верифицированных создателей контента.
Эл. почта/номер телефона
В тренде
USStocksCloseLowerAmazonSuedByFTC
Просмотров: 2,675
148 обсуждают
#usstockscloseloweramazonsuedbyftc — Amazon's ad machine is now a courtroom target 📉
US stocks closed lower Monday — and the FTC just went after the biggest cash cow Amazon has left.
The market: Dow -0.7% (53,185.90), S&P 500 -0.33% , Nasdaq -0.12% . The driver wasn't earnings — it was the Strait of Hormuz: US–Iran clashes resumed, Brent ($BZ ) blew past $90 , and energy was the only sector that worked (+0.9%).
The lawsuit: The FTC + 22 state AGs sued Amazon in the Western District of Washington over a "secret ad surcharge scheme" — alleging it overcharged 1.2M+ advertisers by $20B+ since 2019 through undisclosed surcharges and artificially inflated auction rates. Sponsored Products advertisers paid their own bid price ~30–40% of the time in 2021 — but ~80% by 2024 . Over 500K small businesses allegedly hit.
Amazon's reply: "Misguided" — its auctions prioritize product relevance over bids, and it claims the system actually saved advertisers $8B over five years.
The hit: $AMZN slid ~ 2.5% in after-hours trade (~$259.77). This is the second federal antitrust front against the company — ads were a $68.6B revenue line in 2025, the fastest-growing part of the business. The FTC wants an injunction + restitution, not just a fine.
Same war, same Tuesday, two different scoreboards: oil up, Big Tech on the defensive.
For reference only — not investment advice.
#NvidiaToInvest$3.5BInMediaTek #USFundsAlcoaGalliumPlantInAustralia #USCryptoLinkedEquityIndexRises8.81%InAugust #USIranMilitaryClashesResume
KimHotbae
·Лайков: 0
·Просмотров: 548
NvidiaToInvest$3.5BInMediaTek
Просмотров: 964
31 обсуждают
USFundsAlcoaGalliumPlantInAustralia
Просмотров: 4,891
158 обсуждают