📈 SEI/USDT Chart Analysis – Potential Long Opportunity Emerging! 🔥
Published on Binance Square by @chathuwavlog16 – July 31, 2025
---
🧠 Technical Overview (4H Chart)
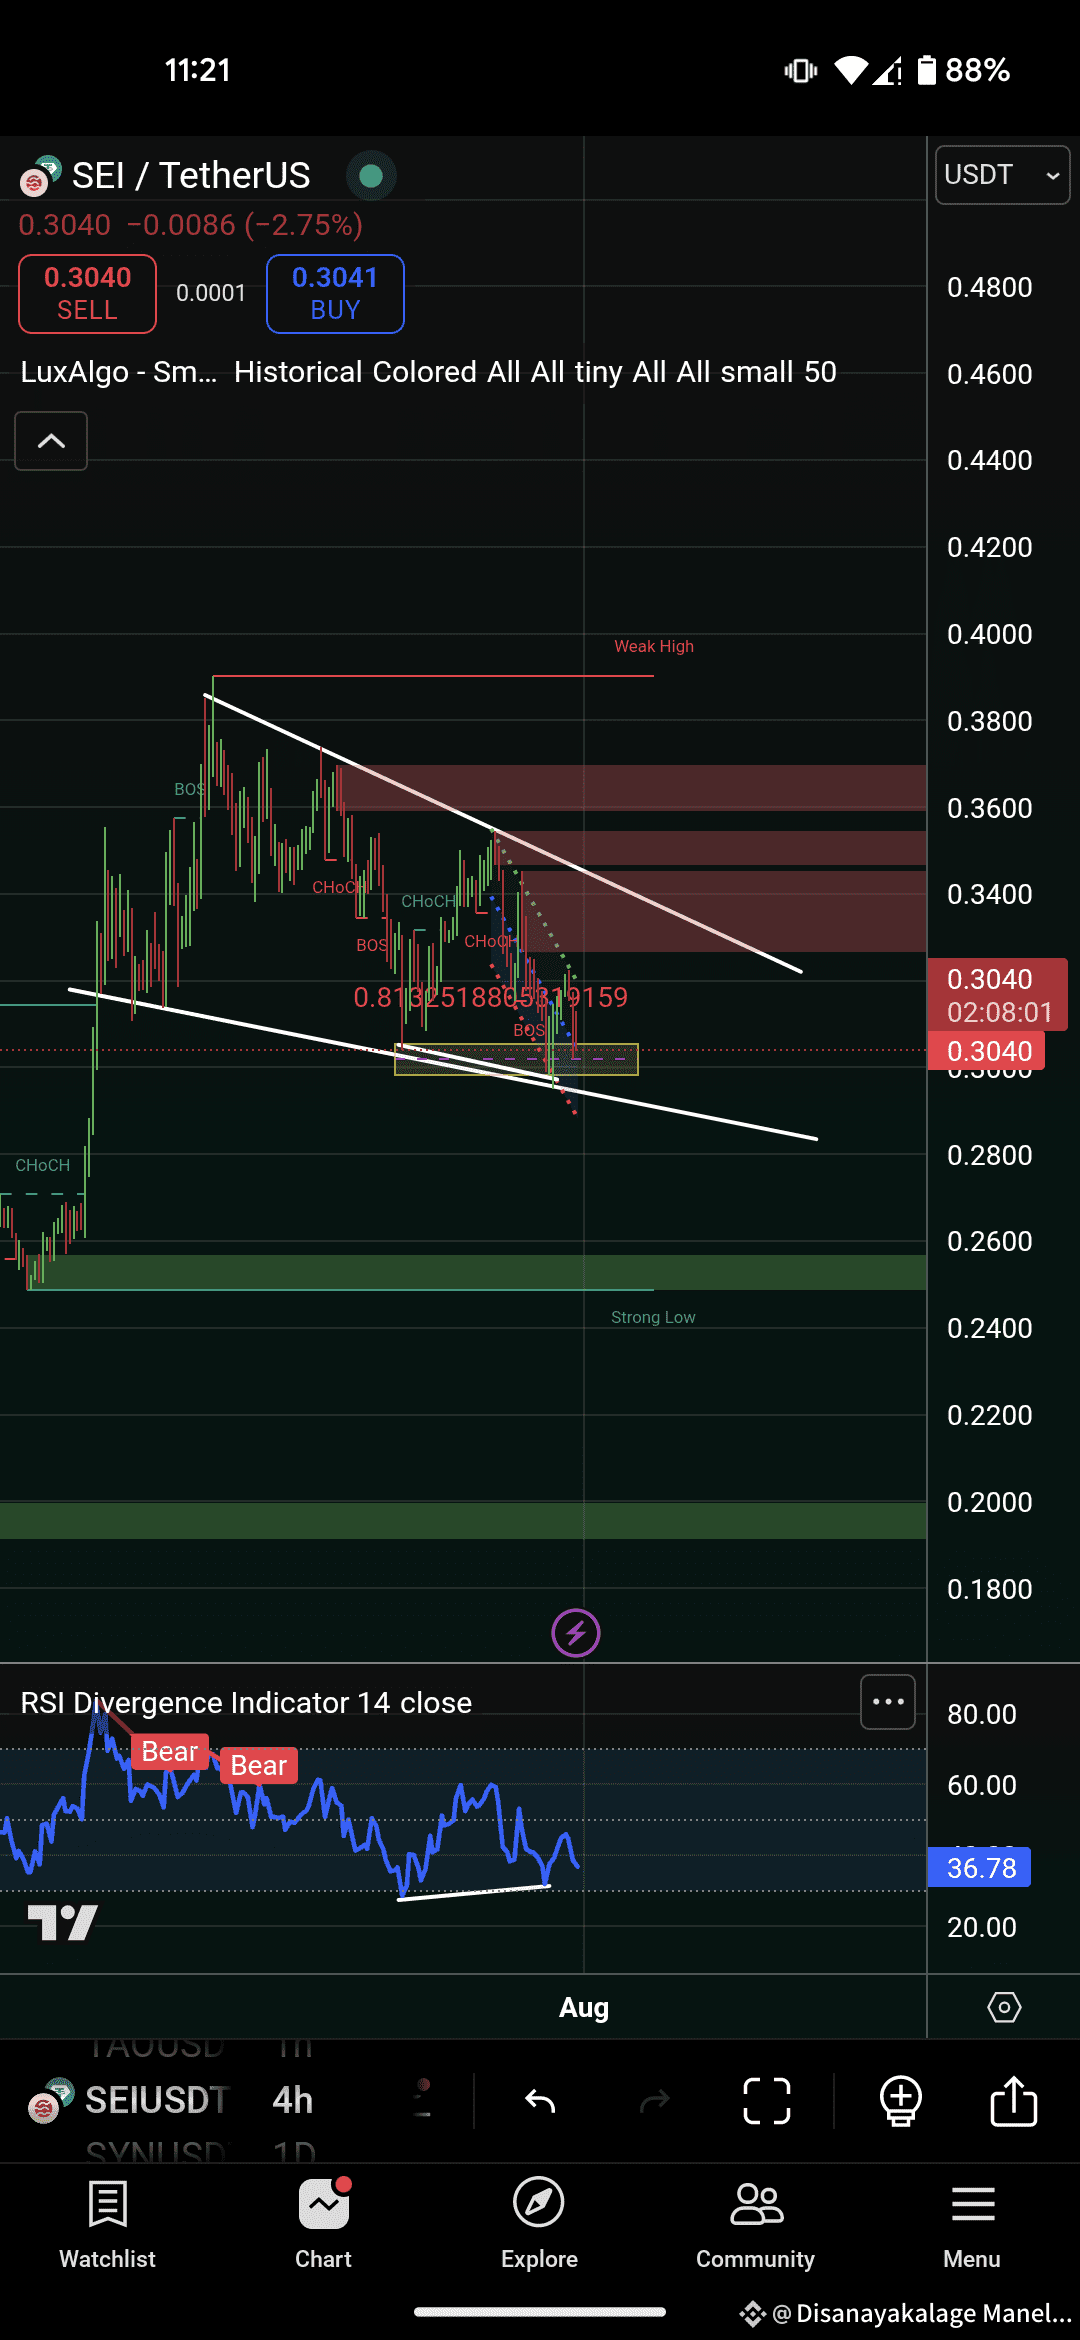
The SEI/USDT pair is currently forming a bullish descending wedge pattern — a structure typically associated with trend reversal. Price is consolidating tightly near the wedge’s lower boundary, with multiple liquidity sweeps and a strong reaction from the 0.813 Fibonacci level.
🔍 Key Observations:
Bullish RSI Divergence at the current low (RSI = 36.84), indicating weakening bearish momentum.
Price tapped a key demand zone (yellow box) with a potential break of structure (BOS) to the upside.
Wedge resistance around $0.32 – $0.34 acting as the next key breakout level.
Significant supply zones marked above $0.34 – $0.36, and major resistance around $0.38 (Weak High).
Published on Binance Square by @chathuwavlog16 – July 31, 2025
---
🧠 Technical Overview (4H Chart)
The SEI/USDT pair is currently forming a bullish descending wedge pattern — a structure typically associated with trend reversal. Price is consolidating tightly near the wedge’s lower boundary, with multiple liquidity sweeps and a strong reaction from the 0.813 Fibonacci level.
🔍 Key Observations:
Bullish RSI Divergence at the current low (RSI = 36.84), indicating weakening bearish momentum.
Price tapped a key demand zone (yellow box) with a potential break of structure (BOS) to the upside.
Wedge resistance around $0.32 – $0.34 acting as the next key breakout level.
Significant supply zones marked above $0.34 – $0.36, and major resistance around $0.38 (Weak High).