What is the diamond pattern
The diamond pattern is a technical formation commonly found in price charts of financial assets during periods of consolidation. This pattern can indicate a possible trend reversal and provide trading opportunities.
The diamond pattern is formed when the price of the asset begins to oscillate in a narrow range, creating a descending triangle. Over time, the range of oscillation begins to expand, forming an opposite ascending triangle within the descending triangle. This creates the shape of a diamond.
How to identify
The diamond pattern can be identified by observing the highs and lows of the asset price and drawing trend lines to connect the highest and lowest points. The trend lines should be parallel, creating a diamond shape. Once the pattern is formed, traders can use the break of the trend line to confirm a trend reversal.
How to operate
There are two ways to trade the diamond pattern: the first is to wait for the break of the trend line, either upwards or downwards, and enter the trade in the direction of the break. The second way is to enter the trade when the asset price reaches the upper or lower trend line, and exit the trade when the price reaches the opposite trend line.
It is important to remember that the diamond pattern is not a guarantee of a trend reversal. It is important to consider the macro context and wait for confirmed breakout before making any decision. It is also common in volatile and manipulated markets for the pattern to break to one side to seek liquidity, deceiving small traders, and then take a definitive direction. So be careful when trading this pattern.
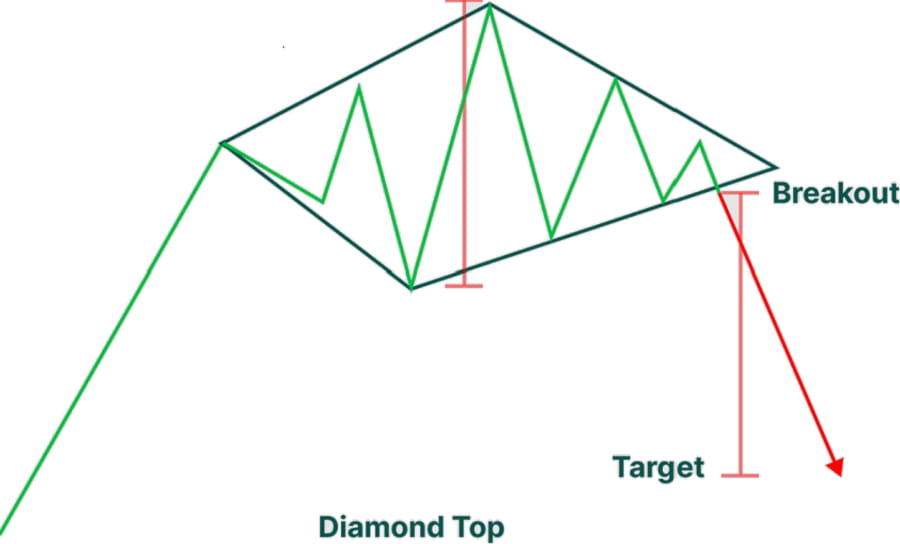
The target is the breadth of the diamond
The personal probability of reversal for this pattern is 70%, so it is worth paying attention to!