#BinanceAlpha$1.7MReward $BTC
Bitcoin is mobe towards 110k now do it don'tmiss
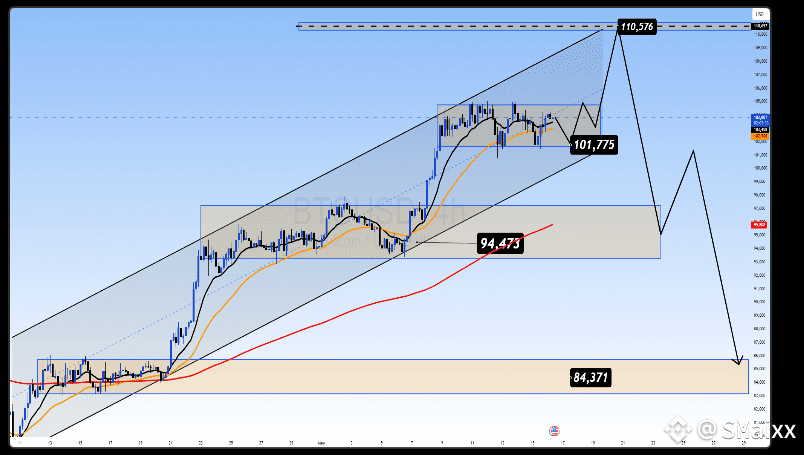
ElThe chart shows BTC going to $110K before a major reversal. The author used Fibonacci and RSI to support the idea📊 Key Analysis (from the post)
• Current Structure:
BTC has made a strong bullish move and is now consolidating between 103K–106K on the 4-hour chart (H4).
• Trend:
The price is still moving within an ascending parallel channel, meaning the uptrend is technically intact.
• Momentum Shift:
The post notes that bullish momentum is fading, which could indicate a potential distribution phase — a classic sign that a reversal might come after one final push higher.
• Target:
A potential move up to $110,576 is projected before any major reversal occurs.
⸻
🧠 Macro Context (Mentioned But Not Fully Visible)
While the full macro context isn’t visible in your screenshot, it appears the author may be discussing recent ETF-related news or broader market factors supporting BTC’s rally.
⸻
📌 Summary in Simple Terms:
BTC had a strong rally and is now stuck between $103K–$106K. The chart shows it might still push higher to around $110K, but signs are emerging that buyers are losing steam. This could mean a bigger correction may follow after that peak.
Bitcoin is mobe towards 110k now do it don'tmiss
ElThe chart shows BTC going to $110K before a major reversal. The author used Fibonacci and RSI to support the idea📊 Key Analysis (from the post)
• Current Structure:
BTC has made a strong bullish move and is now consolidating between 103K–106K on the 4-hour chart (H4).
• Trend:
The price is still moving within an ascending parallel channel, meaning the uptrend is technically intact.
• Momentum Shift:
The post notes that bullish momentum is fading, which could indicate a potential distribution phase — a classic sign that a reversal might come after one final push higher.
• Target:
A potential move up to $110,576 is projected before any major reversal occurs.
⸻
🧠 Macro Context (Mentioned But Not Fully Visible)
While the full macro context isn’t visible in your screenshot, it appears the author may be discussing recent ETF-related news or broader market factors supporting BTC’s rally.
⸻
📌 Summary in Simple Terms:
BTC had a strong rally and is now stuck between $103K–$106K. The chart shows it might still push higher to around $110K, but signs are emerging that buyers are losing steam. This could mean a bigger correction may follow after that peak.