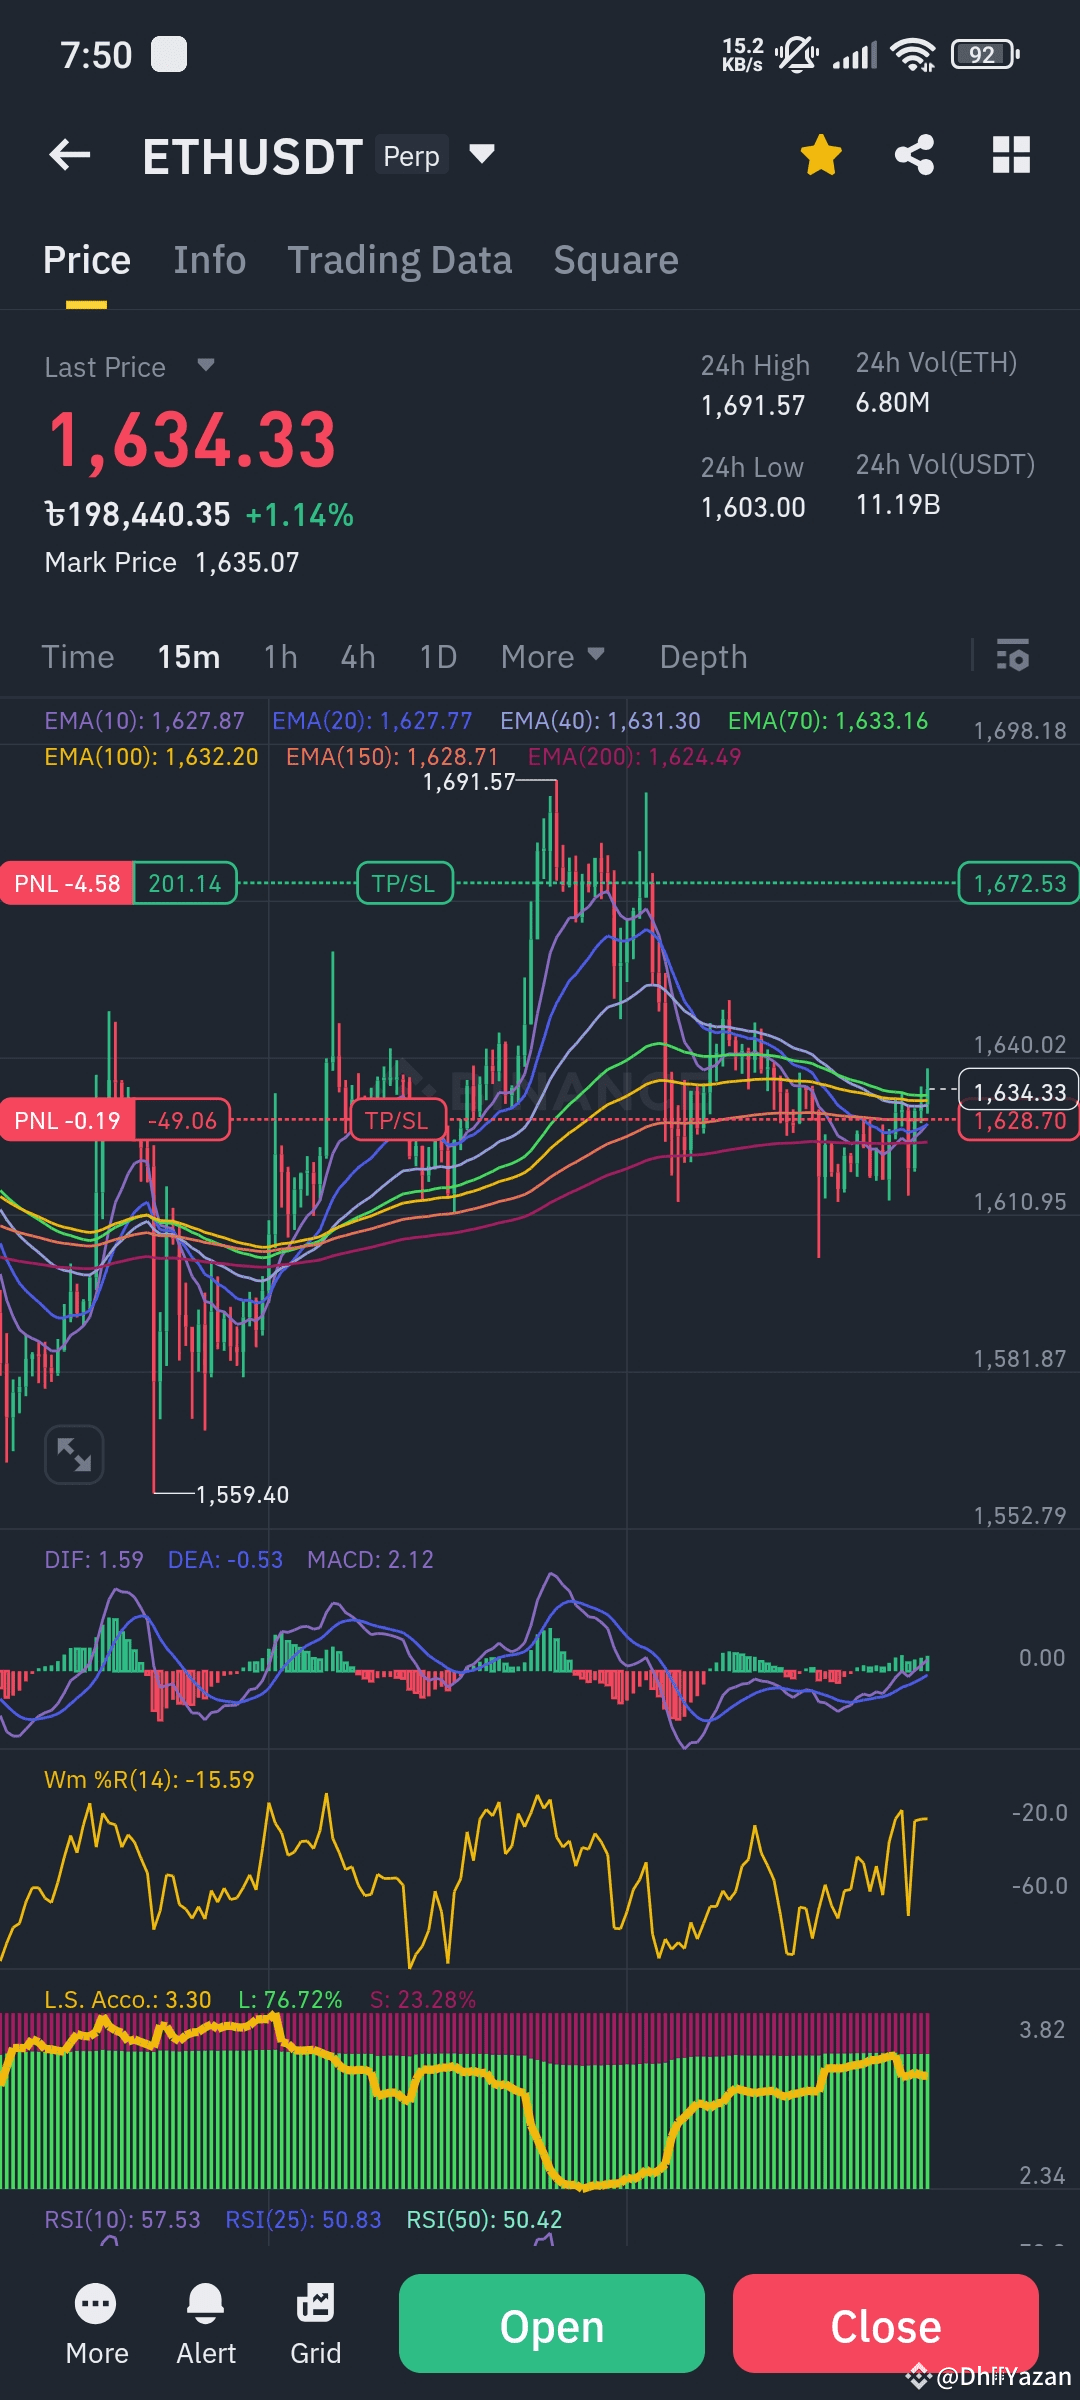
$ETH Okay, let's identify potential support and resistance levels on the 15-minute ETHUSDT chart you provided.
Resistance Levels:
* Around 1,647.50 - 1,648.00: You can see a recent high point where the price reached and then pulled back. This area has acted as resistance in the very short term.
* Around 1,652.50: There's another level slightly higher where the price previously faced rejection.
* Around 1,672.50: Looking further back on the chart, this level appears to be a more significant resistance zone where the price has struggled to break above.
Support Levels:
* Around 1,628.50 - 1,629.00: This area seems to have acted as support recently, where the price dropped to and then bounced upwards.
* Around 1,611.00: There's another potential support level a bit lower, where the price has found buying interest in the past.
* Around 1,581.50: This lower level appears to be a more significant support zone that the price has respected.
Visual Representation (Conceptual):
Imagine horizontal lines drawn at these price levels on the chart. When the price approaches these lines:
* Resistance: It might struggle to go above it and could potentially reverse downwards.
* Support: It might struggle to go below it and could potentially bounce upwards.
Important Considerations:
* These are potential levels: Support and resistance are not exact price points but rather zones. The price might fluctuate slightly above or below these levels.
* Timeframe Specific: These levels are identified on a 15-minute chart and may not be as significant on longer timeframes.
* Market Context: The strength of these levels can be influenced by overall market sentiment, news events, and trading volume.
* Breakouts: If the price decisively breaks above a resistance level, that level can then potentially act as support, and vice versa.
In summary, based on the 15-minute ETHUSDT chart:
* Potential Resistance: ≈ 1647.50 - 1648.00, ≈ 1652.50, ≈ 1672.50
* Potential Support: ≈ 1628.50 - 1629.00, ≈ 1611.00, ≈ 1581.50
Remember to use these levels as part of your broader analysis and consider other indicators and factors when making trading decisions.