

Coin Name: #ADA
Position: Short
This 15-minute chart of Cardano (ADA/USDT) shows a rising wedge pattern, a bearish signal. The price breaks below the wedge support, suggesting a downward move. The red zone marks the stop-loss area. Indicators like MACD and RSI show bearish divergence, supporting a potential downtrend. The yellow arrows indicate expected price movement post-breakdown.
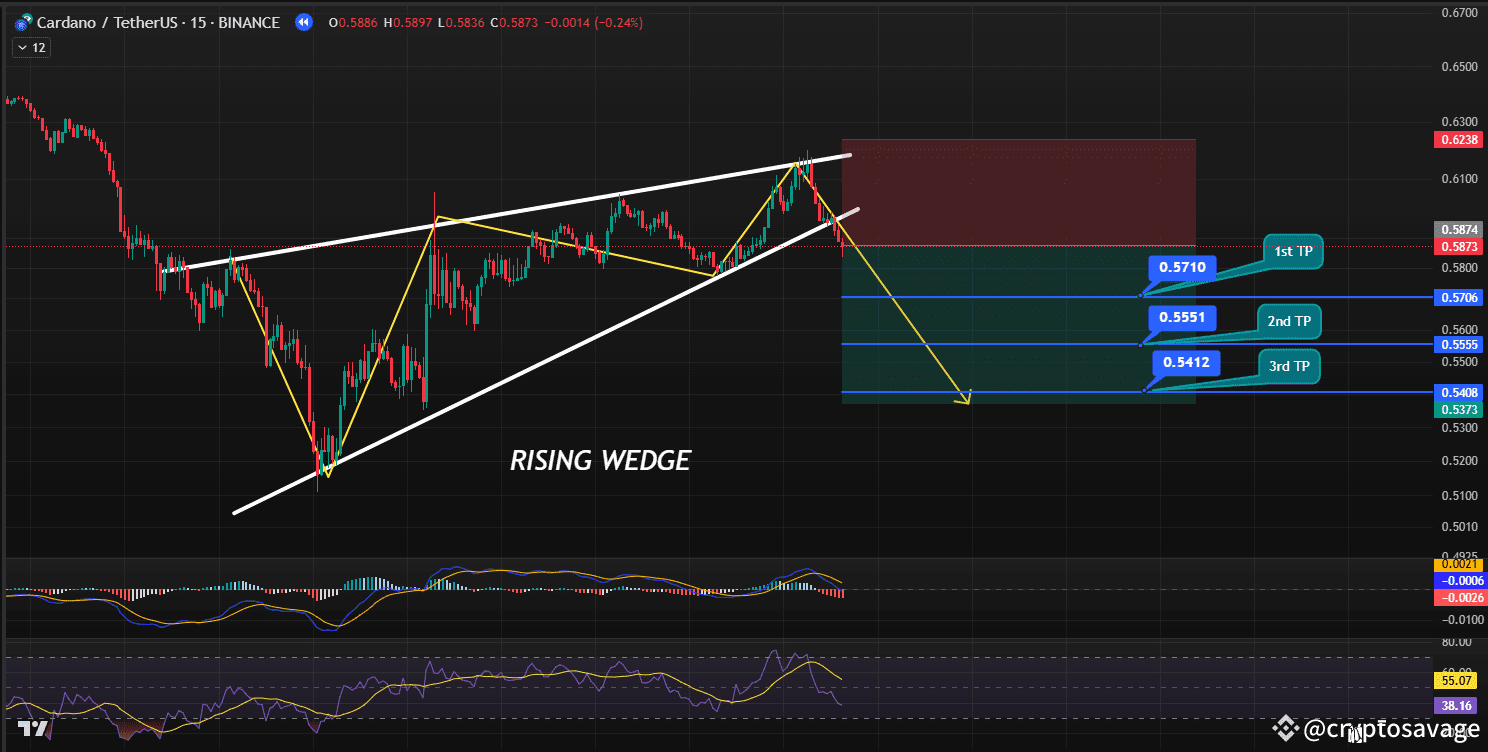
Entry Price: 0.5874
Targets:
1st TP $0.5710
2nd TP $0.5551
3rd TP $0.5412
Leverage: 5X
📌 Special Note:
🔥FUTURE CALL🔥
This is my personal prediction, but as we all know, the crypto market is highly volatile ⚡. Always do your own thorough research before making any decisions 🔍. To manage risk effectively, use only 5% of your portfolio 💼, avoid high leverage 🚫, and proceed with caution ⚠️. Implement the DCA method ✅ and focus on risk management to protect your capital 💰 while navigating market fluctuations 📉📈.

Join my Binance Live for real-time market analysis, or check out my bio for more details.