

Crypto4light
5.6k Публикации

Crypto4light
 Square Verified+
Отправить жалобу
Заблокировать пользователя
Find everywhere - @Crypto4light 🔥 | Daily trading ideas | My custom indicators analysis | Educational content | Crypto News |

Level 1 Creator
Открытая сделка
Трейдер с регулярными сделками
5.8 г
0 подписок(и/а)
68.2K+ подписчиков(а)
40.0K+ понравилось
1 Значки
Посты
Портфель
Все
Цитирования
Видео
Активно
PINNED
·
--

Статья
The best indicators set for tradingCrypto4light Indicators Set
I spent a lot of time with backtesting and coding to create this set. 6 indicators which can cut all noise on your charts and bring more light in your trading strategy.🐳 Trade ON indicator
➡️ Buy/Sell The signal appears when you can open a position for buying or selling. Stop Loss can be set according to your risk management. Entry into the position can be at the appearance of the Buy/Sell signal and the closing of the candle. Stop Loss by the body or wick of this candle. Another entry option is to wait for the closing of 40-50% of the body of the candle on which you saw the Buy/Sell signal. Stop Loss by the body or wick of the candle on which you saw the Buy/Sell signal. On example you can see 35% profit on spot, 4H timeframe trade. Sometimes you can see signal just blinking, so wait until signal confirmed or try go to lower timeframe to see confirmation for entry by your risk management and strategy.
➡️ Red or Green triangles
Once a Buy/Sell signal appears and you enter a position, you have several options. It all depends on your trading style and risk management.
The first option - If, for example, you entered on the Buy signal, you can close the purchase at the appearance of the Take Profit signal, or at the appearance of the Sell signal, and open a position in another direction.The second option, after opening a position when triangles appear, this is a signal to close a certain percentage of the position in the plus. With each new triangle, you can close % of your position and move the Stop Loss to breakeven.The third option, after opening a position at the appearance of triangles, closing a full position and looking for a possible option to open a position in the other direction, closing the position after the triangles should take place at the appearance of the main Buy/Sell signal.
➡️ Take Profit
➡️ Two identical signals in a row
🐳 Direction indicator
Circles will appear from above or below. The circles will signal that the main market makers are starting to reduce or gain their position. Big players always need liquidity, so they can build or reduce a position for quite a long time. Round dots are not the main signal for tradingA red or green triangle signals a final change in the local or global trend, depending on your timeframe. Market Makers or players with large positions have exited the market, or conversely gained enough position to change the direction of price movement.The green and red solid lines are the levels where the trend is most likely to end
The green and red dashed lines are the levels where the big players are more likely to start gradually selling off or gaining a position to change the trend before the momentum. In the style settings, you can change the input positions of each of the lines, for yourself or for a specific asset. But the settings are already set in the most optimal way.
🐳 ADZ (Accumulation/Distribution Zones)
The red solid zone shows the zone where the big players will complete the sale of their position.The solid green area shows where the big players will accumulate their positions.The middle blue zone shows where medium and small players start to accumulate or sell off their positions.The yellow zone inside the blue zone shows a trend change and this means that most likely the big players have already gained a position to start selling or gaining it depending on the timeframe in which you are trading.
🐳 Take Profit indicator
The first lower "Buy" line, when the price drops to this line is a good point to enter a position or gradually build a position.The bottom green line "Fundamental price" is the real value of the asset. Sometimes when the media background about the asset is negative and buyers are not interested in the asset, the price can fall below its fundamental price. Then this is the best time to buy the asset.The first upper Take Profit line is a line where you can lock part of the profit or close the entire position. There is a possibility of opening a short position if you trade on the futures market
The very top Exit line is the line where you need to close 100% of the trade position. If you are an investor, you do not need to close the entire position and exit the asset, because all lines are dynamic and change depending on the cycle in which the asset is located.
🐳 Market Mood Indicator
On different timeframes, you can view the mood that is currently present in the market. Trend, euphoria, position selection, or lack of interest.
Red and orange color - fear and overbought in the market
Green - Accumulation and purchases on the market
Yellow - Gradual set of position
White - purchases and lack of interest from small investors
Blue - Neutral mood in the market
I rename color zones so you can turn on alerts and easier understand notifications. Some colors got 2 alerts because of gradation based on input data, so you can choose any. You should understand on downtrend for example orange zone can be still be a belief sentiment because traders belief price will not drop.
Dark red - Euphoria
Light red - Thrill
Orange (light and dark) - Belief / Strong Belief
Yellow - Optimism
Green - Hope
Light blue - Disbelief
Dark blue - Capitulation
White - Depression
🐳 Money Power Indicator
When the asset reaches one of the zones, it can serve as a good signal to close a part of the position or to start a gradual acquisition of the position according to your trading timeframe.
An almost ideal signal for deciding whether to enter or exit a position would be a divergence on the price chart and the curve on the Money Power indicator. If you are in a long position, for example, and you see that the price on the chart continues to rise, but in the overbought zone, the lines of the Money Power indicator show lower highs, this is a signal that a large player has almost completely sold out his position on this timeframe.
Of course, the price may continue to grow for some time depending on the timeframe, but such indicators usually indicate the outflow of money from large investors and small players will not be able to keep the asset from falling for a long time. Everything is the same but in a different direction in the oversold zone. When a big player gradually gains a position and we see that the money flow curve goes up, and the price on the chart and candles show lower minimums. This will be a great signal to enter a position. You can enter or close a position by analyzing older timeframes W, 3D 1D depending on your trading style.
In new version you also can find a new signals (explanation with default colors, but you can modify it to your theme)
Yellow block - Whales sell or close % of position
Yellow block with arrow down - Whales strong sell
Blue block - Whales buy
Blue block with arrow up - Whales strong buy
Triangle down - Bearish RSI divergency
Triangle Up - Bullish RSI divergency
Red Circle - Bearish MACD divergency
Green Circle - Bullish MACD divergency
I am not a financial advisor. All indicators created with my own personal experience. Do NOT trade or invest based only on indicators. Always do your own research and due diligence before investing.
All indicators can be used on different timeframes. The higher timeframe, the stronger signal. Your entry or exit point should be base on several indicators from the set, your trading strategy and your risk management. Indicators cannot predict or analyze future events in the world, the release of data in economic reports, statements in the media by public figures, so always follow your risk management when you open trades.
☑️ Always follow risk management and this set of indicators will help you. I wish you successful trading.
#trading #crypto
The best indicators set for trading
Crypto4light Indicators Set
I spent a lot of time with backtesting and coding to create this set. 6 indicators which can cut all noise on your charts and bring more light in your trading strategy.🐳 Trade ON indicator
➡️ Buy/Sell The signal appears when you can open a position for buying or selling. Stop Loss can be set according to your risk management. Entry into the position can be at the appearance of the Buy/Sell signal and the closing of the candle. Stop Loss by the body or wick of this candle. Another entry option is to wait for the closing of 40-50% of the body of the candle on which you saw the Buy/Sell signal. Stop Loss by the body or wick of the candle on which you saw the Buy/Sell signal. On example you can see 35% profit on spot, 4H timeframe trade. Sometimes you can see signal just blinking, so wait until signal confirmed or try go to lower timeframe to see confirmation for entry by your risk management and strategy.
➡️ Red or Green triangles
Once a Buy/Sell signal appears and you enter a position, you have several options. It all depends on your trading style and risk management.
The first option - If, for example, you entered on the Buy signal, you can close the purchase at the appearance of the Take Profit signal, or at the appearance of the Sell signal, and open a position in another direction.The second option, after opening a position when triangles appear, this is a signal to close a certain percentage of the position in the plus. With each new triangle, you can close % of your position and move the Stop Loss to breakeven.The third option, after opening a position at the appearance of triangles, closing a full position and looking for a possible option to open a position in the other direction, closing the position after the triangles should take place at the appearance of the main Buy/Sell signal.
➡️ Take Profit
➡️ Two identical signals in a row
🐳 Direction indicator
Circles will appear from above or below. The circles will signal that the main market makers are starting to reduce or gain their position. Big players always need liquidity, so they can build or reduce a position for quite a long time. Round dots are not the main signal for tradingA red or green triangle signals a final change in the local or global trend, depending on your timeframe. Market Makers or players with large positions have exited the market, or conversely gained enough position to change the direction of price movement.The green and red solid lines are the levels where the trend is most likely to end
The green and red dashed lines are the levels where the big players are more likely to start gradually selling off or gaining a position to change the trend before the momentum. In the style settings, you can change the input positions of each of the lines, for yourself or for a specific asset. But the settings are already set in the most optimal way.
🐳 ADZ (Accumulation/Distribution Zones)
The red solid zone shows the zone where the big players will complete the sale of their position.The solid green area shows where the big players will accumulate their positions.The middle blue zone shows where medium and small players start to accumulate or sell off their positions.The yellow zone inside the blue zone shows a trend change and this means that most likely the big players have already gained a position to start selling or gaining it depending on the timeframe in which you are trading.
🐳 Take Profit indicator
The first lower "Buy" line, when the price drops to this line is a good point to enter a position or gradually build a position.The bottom green line "Fundamental price" is the real value of the asset. Sometimes when the media background about the asset is negative and buyers are not interested in the asset, the price can fall below its fundamental price. Then this is the best time to buy the asset.The first upper Take Profit line is a line where you can lock part of the profit or close the entire position. There is a possibility of opening a short position if you trade on the futures market
The very top Exit line is the line where you need to close 100% of the trade position. If you are an investor, you do not need to close the entire position and exit the asset, because all lines are dynamic and change depending on the cycle in which the asset is located.
🐳 Market Mood Indicator
On different timeframes, you can view the mood that is currently present in the market. Trend, euphoria, position selection, or lack of interest.
Red and orange color - fear and overbought in the market
Green - Accumulation and purchases on the market
Yellow - Gradual set of position
White - purchases and lack of interest from small investors
Blue - Neutral mood in the market
I rename color zones so you can turn on alerts and easier understand notifications. Some colors got 2 alerts because of gradation based on input data, so you can choose any. You should understand on downtrend for example orange zone can be still be a belief sentiment because traders belief price will not drop.
Dark red - Euphoria
Light red - Thrill
Orange (light and dark) - Belief / Strong Belief
Yellow - Optimism
Green - Hope
Light blue - Disbelief
Dark blue - Capitulation
White - Depression
🐳 Money Power Indicator
When the asset reaches one of the zones, it can serve as a good signal to close a part of the position or to start a gradual acquisition of the position according to your trading timeframe.
An almost ideal signal for deciding whether to enter or exit a position would be a divergence on the price chart and the curve on the Money Power indicator. If you are in a long position, for example, and you see that the price on the chart continues to rise, but in the overbought zone, the lines of the Money Power indicator show lower highs, this is a signal that a large player has almost completely sold out his position on this timeframe.
Of course, the price may continue to grow for some time depending on the timeframe, but such indicators usually indicate the outflow of money from large investors and small players will not be able to keep the asset from falling for a long time. Everything is the same but in a different direction in the oversold zone. When a big player gradually gains a position and we see that the money flow curve goes up, and the price on the chart and candles show lower minimums. This will be a great signal to enter a position. You can enter or close a position by analyzing older timeframes W, 3D 1D depending on your trading style.
In new version you also can find a new signals (explanation with default colors, but you can modify it to your theme)
Yellow block - Whales sell or close % of position
Yellow block with arrow down - Whales strong sell
Blue block - Whales buy
Blue block with arrow up - Whales strong buy
Triangle down - Bearish RSI divergency
Triangle Up - Bullish RSI divergency
Red Circle - Bearish MACD divergency
Green Circle - Bullish MACD divergency
I am not a financial advisor. All indicators created with my own personal experience. Do NOT trade or invest based only on indicators. Always do your own research and due diligence before investing.
All indicators can be used on different timeframes. The higher timeframe, the stronger signal. Your entry or exit point should be base on several indicators from the set, your trading strategy and your risk management. Indicators cannot predict or analyze future events in the world, the release of data in economic reports, statements in the media by public figures, so always follow your risk management when you open trades.
☑️ Always follow risk management and this set of indicators will help you. I wish you successful trading.
#trading #crypto
I spent a lot of time with backtesting and coding to create this set. 6 indicators which can cut all noise on your charts and bring more light in your trading strategy.🐳 Trade ON indicator
➡️ Buy/Sell The signal appears when you can open a position for buying or selling. Stop Loss can be set according to your risk management. Entry into the position can be at the appearance of the Buy/Sell signal and the closing of the candle. Stop Loss by the body or wick of this candle. Another entry option is to wait for the closing of 40-50% of the body of the candle on which you saw the Buy/Sell signal. Stop Loss by the body or wick of the candle on which you saw the Buy/Sell signal. On example you can see 35% profit on spot, 4H timeframe trade. Sometimes you can see signal just blinking, so wait until signal confirmed or try go to lower timeframe to see confirmation for entry by your risk management and strategy.
➡️ Red or Green triangles
Once a Buy/Sell signal appears and you enter a position, you have several options. It all depends on your trading style and risk management.
The first option - If, for example, you entered on the Buy signal, you can close the purchase at the appearance of the Take Profit signal, or at the appearance of the Sell signal, and open a position in another direction.The second option, after opening a position when triangles appear, this is a signal to close a certain percentage of the position in the plus. With each new triangle, you can close % of your position and move the Stop Loss to breakeven.The third option, after opening a position at the appearance of triangles, closing a full position and looking for a possible option to open a position in the other direction, closing the position after the triangles should take place at the appearance of the main Buy/Sell signal.
➡️ Take Profit
➡️ Two identical signals in a row
🐳 Direction indicator
Circles will appear from above or below. The circles will signal that the main market makers are starting to reduce or gain their position. Big players always need liquidity, so they can build or reduce a position for quite a long time. Round dots are not the main signal for tradingA red or green triangle signals a final change in the local or global trend, depending on your timeframe. Market Makers or players with large positions have exited the market, or conversely gained enough position to change the direction of price movement.The green and red solid lines are the levels where the trend is most likely to end
The green and red dashed lines are the levels where the big players are more likely to start gradually selling off or gaining a position to change the trend before the momentum. In the style settings, you can change the input positions of each of the lines, for yourself or for a specific asset. But the settings are already set in the most optimal way.
🐳 ADZ (Accumulation/Distribution Zones)
The red solid zone shows the zone where the big players will complete the sale of their position.The solid green area shows where the big players will accumulate their positions.The middle blue zone shows where medium and small players start to accumulate or sell off their positions.The yellow zone inside the blue zone shows a trend change and this means that most likely the big players have already gained a position to start selling or gaining it depending on the timeframe in which you are trading.
🐳 Take Profit indicator
The first lower "Buy" line, when the price drops to this line is a good point to enter a position or gradually build a position.The bottom green line "Fundamental price" is the real value of the asset. Sometimes when the media background about the asset is negative and buyers are not interested in the asset, the price can fall below its fundamental price. Then this is the best time to buy the asset.The first upper Take Profit line is a line where you can lock part of the profit or close the entire position. There is a possibility of opening a short position if you trade on the futures market
The very top Exit line is the line where you need to close 100% of the trade position. If you are an investor, you do not need to close the entire position and exit the asset, because all lines are dynamic and change depending on the cycle in which the asset is located.
🐳 Market Mood Indicator
On different timeframes, you can view the mood that is currently present in the market. Trend, euphoria, position selection, or lack of interest.
Red and orange color - fear and overbought in the market
Green - Accumulation and purchases on the market
Yellow - Gradual set of position
White - purchases and lack of interest from small investors
Blue - Neutral mood in the market
I rename color zones so you can turn on alerts and easier understand notifications. Some colors got 2 alerts because of gradation based on input data, so you can choose any. You should understand on downtrend for example orange zone can be still be a belief sentiment because traders belief price will not drop.
Dark red - Euphoria
Light red - Thrill
Orange (light and dark) - Belief / Strong Belief
Yellow - Optimism
Green - Hope
Light blue - Disbelief
Dark blue - Capitulation
White - Depression
🐳 Money Power Indicator
When the asset reaches one of the zones, it can serve as a good signal to close a part of the position or to start a gradual acquisition of the position according to your trading timeframe.
An almost ideal signal for deciding whether to enter or exit a position would be a divergence on the price chart and the curve on the Money Power indicator. If you are in a long position, for example, and you see that the price on the chart continues to rise, but in the overbought zone, the lines of the Money Power indicator show lower highs, this is a signal that a large player has almost completely sold out his position on this timeframe.
Of course, the price may continue to grow for some time depending on the timeframe, but such indicators usually indicate the outflow of money from large investors and small players will not be able to keep the asset from falling for a long time. Everything is the same but in a different direction in the oversold zone. When a big player gradually gains a position and we see that the money flow curve goes up, and the price on the chart and candles show lower minimums. This will be a great signal to enter a position. You can enter or close a position by analyzing older timeframes W, 3D 1D depending on your trading style.
In new version you also can find a new signals (explanation with default colors, but you can modify it to your theme)
Yellow block - Whales sell or close % of position
Yellow block with arrow down - Whales strong sell
Blue block - Whales buy
Blue block with arrow up - Whales strong buy
Triangle down - Bearish RSI divergency
Triangle Up - Bullish RSI divergency
Red Circle - Bearish MACD divergency
Green Circle - Bullish MACD divergency
I am not a financial advisor. All indicators created with my own personal experience. Do NOT trade or invest based only on indicators. Always do your own research and due diligence before investing.
All indicators can be used on different timeframes. The higher timeframe, the stronger signal. Your entry or exit point should be base on several indicators from the set, your trading strategy and your risk management. Indicators cannot predict or analyze future events in the world, the release of data in economic reports, statements in the media by public figures, so always follow your risk management when you open trades.
☑️ Always follow risk management and this set of indicators will help you. I wish you successful trading.
#trading #crypto
37
17
154
3.6k
·
--
$CELR Price Analysis: Celer Network Could Be Undervalued
$CELR Price Analysis: Celer Network Could Be Undervalued
337
·
--
Рост
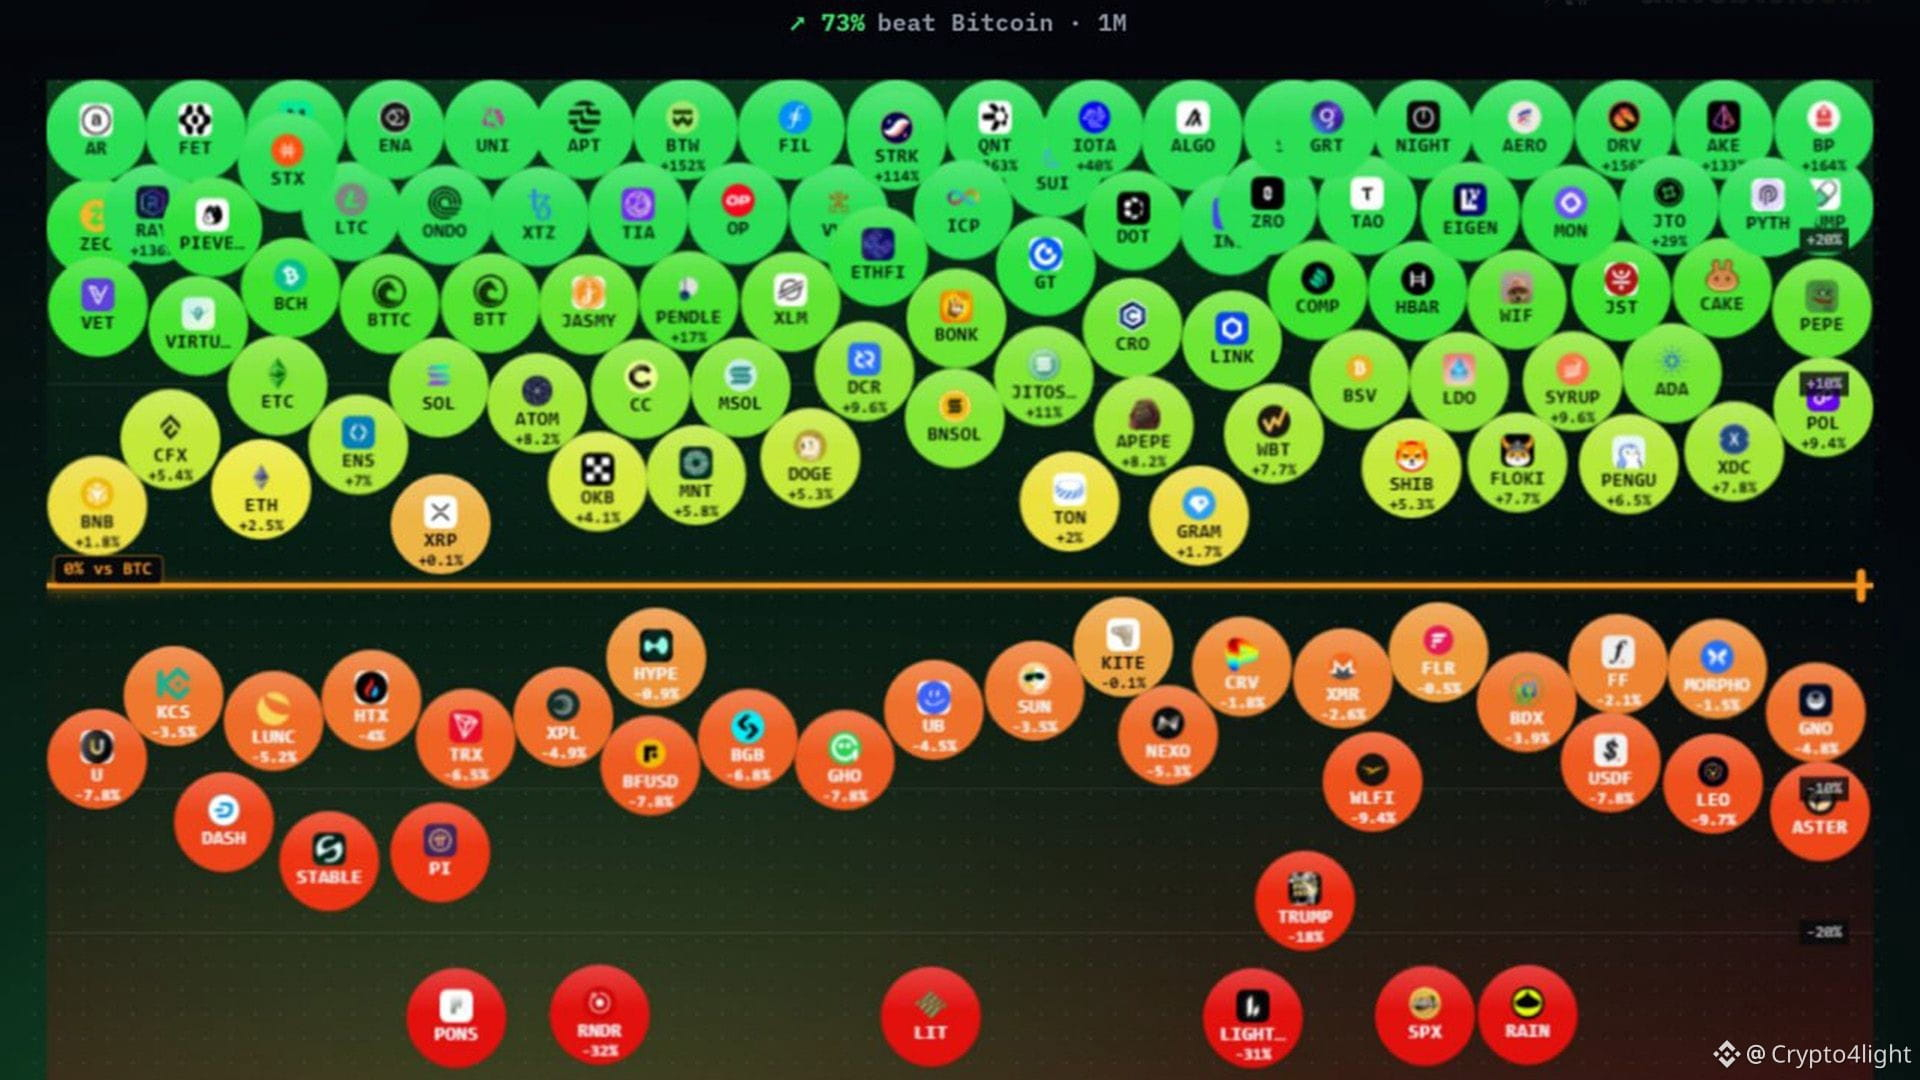
Altcoins are outperforming Bitcoin.
Over the past month, 73% of altcoins with a market cap above $250M have outperformed $BTC .
Is this an early sign that capital is finally rotating into altcoins?
Altcoins are outperforming Bitcoin.
Over the past month, 73% of altcoins with a market cap above $250M have outperformed $BTC .
Is this an early sign that capital is finally rotating into altcoins?
Over the past month, 73% of altcoins with a market cap above $250M have outperformed $BTC .
Is this an early sign that capital is finally rotating into altcoins?
2
1.3k
·
--
Падение
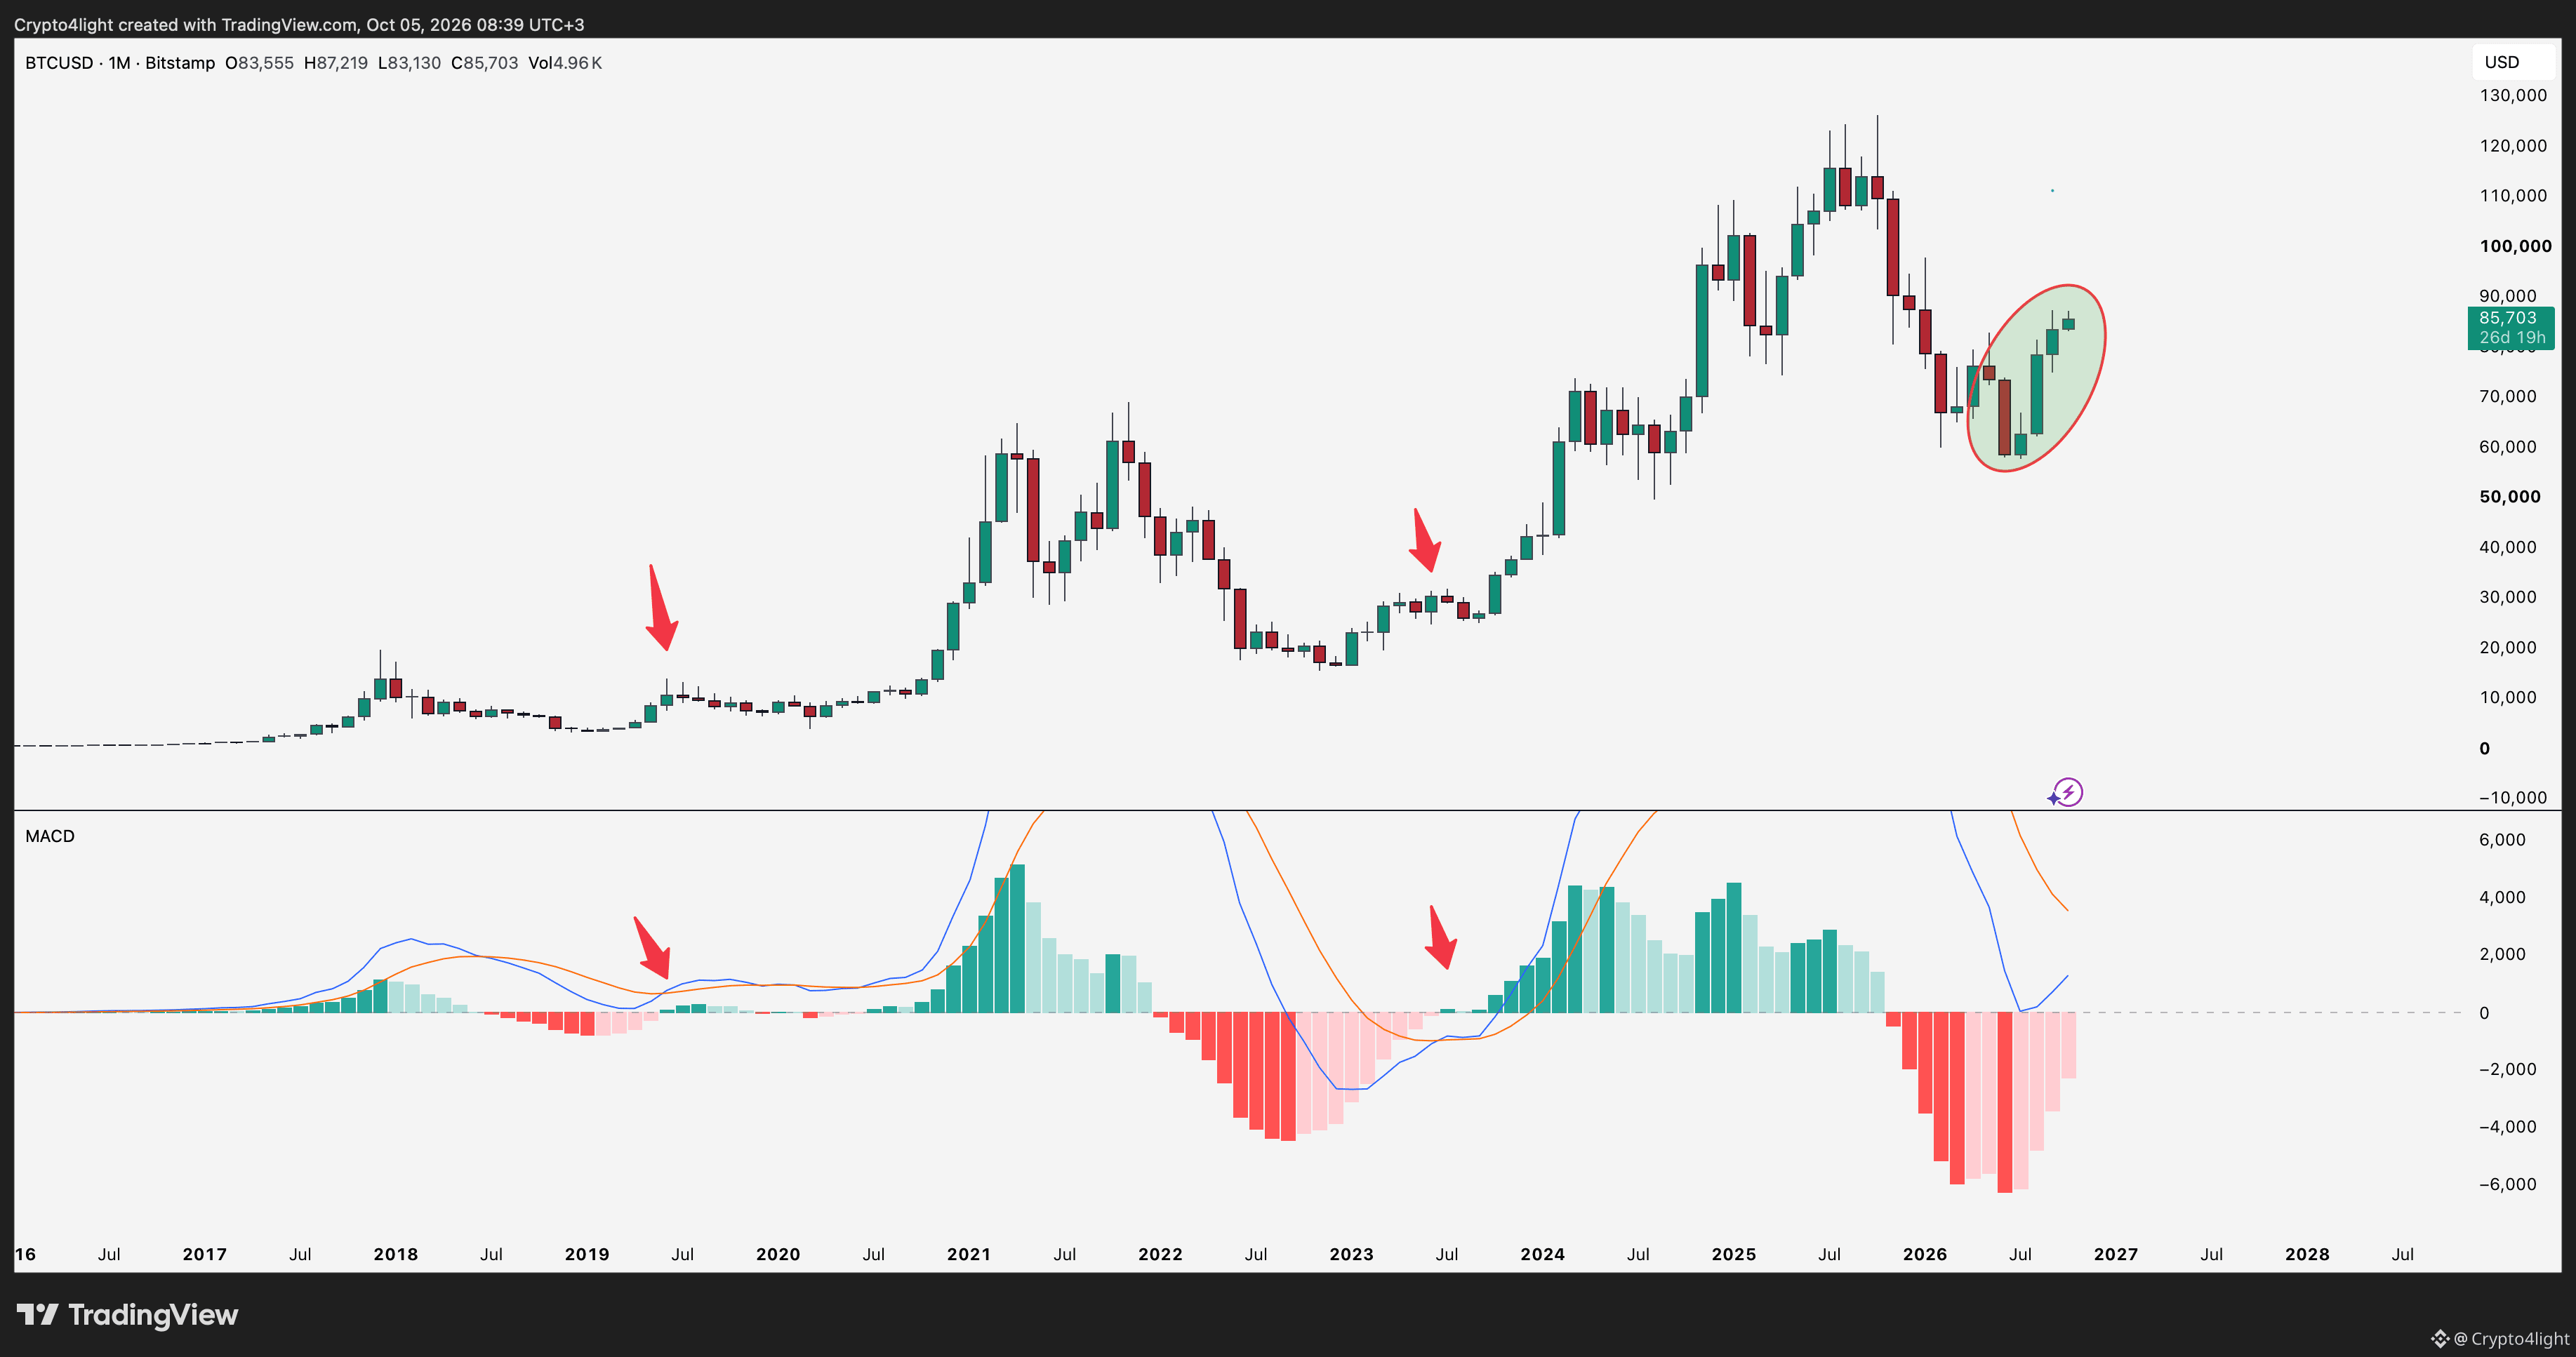
If we look at the classic MACD indicator on the monthly chart, we have several problems! Every time Bitcoin was close to moving into the green zone, we still pulled back afterward, and this raises the question: will this pullback be quick, like in 2023, followed by further growth, or will it be more like 2019, with another six months of downside and sideways movement? Plus, having four consecutive green months for Bitcoin is concerning! Another problem with everyone who uses MACD is that people buy when the indicator moves into the green zone, thinking that this is the bottom! The bottom is not formed in the green zone! It is always formed before that.$BTC
{future}(BTCUSDT)
If we look at the classic MACD indicator on the monthly chart, we have several problems! Every time Bitcoin was close to moving into the green zone, we still pulled back afterward, and this raises the question: will this pullback be quick, like in 2023, followed by further growth, or will it be more like 2019, with another six months of downside and sideways movement? Plus, having four consecutive green months for Bitcoin is concerning! Another problem with everyone who uses MACD is that people buy when the indicator moves into the green zone, thinking that this is the bottom! The bottom is not formed in the green zone! It is always formed before that.$BTC
1
2
1.6k
·
--
Рост
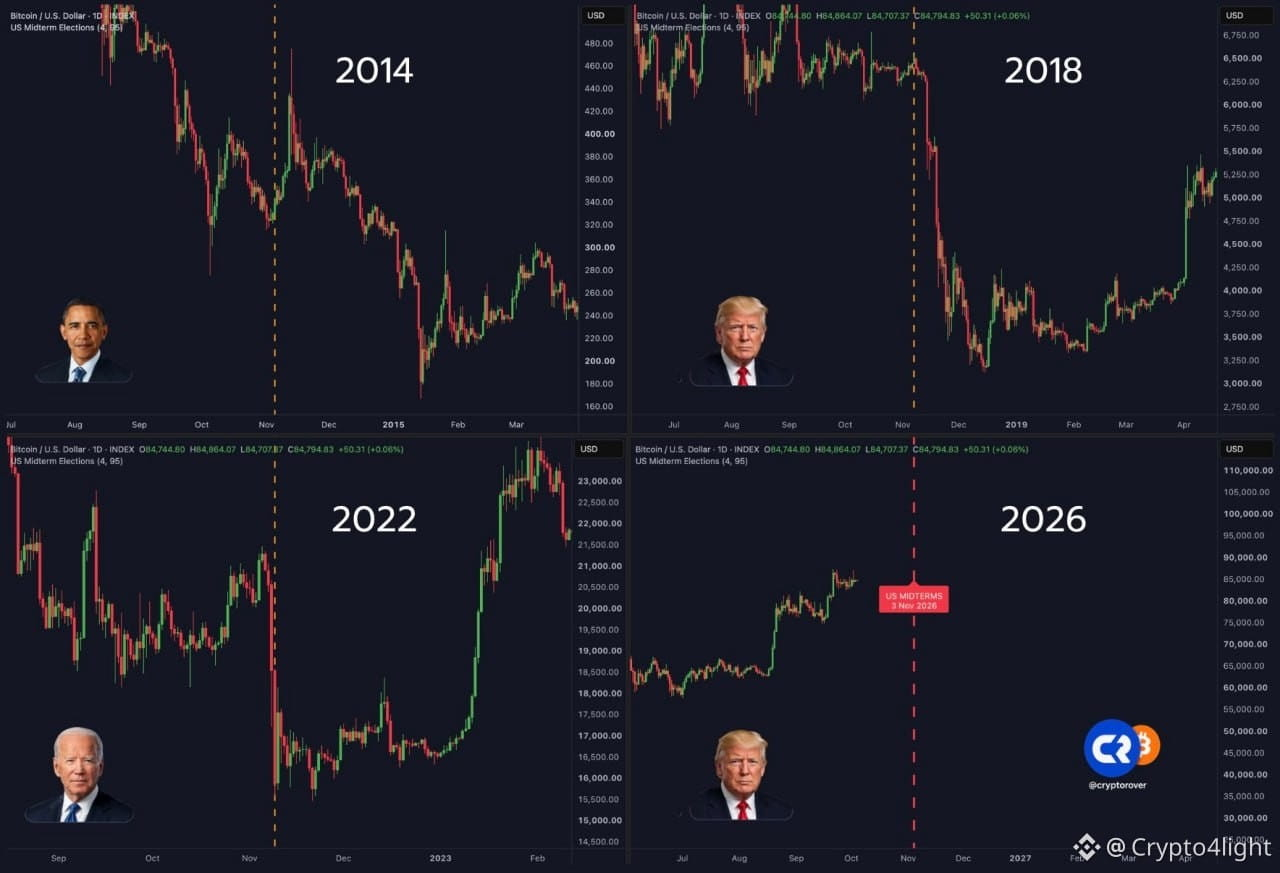
The previous idea about a market move after the U.S. midterm elections in November is still relevant! History doesn’t have to repeat itself, but Bitcoin keeps rising and will continue to rise into the elections as if it were some kind of magic! But all of this is already priced in, and whoever controls the asset can do whatever they want with it — and if they can, they will. Knowing that human psychology, and especially mass psychology, never changes. $BTC
{future}(BTCUSDT)
The previous idea about a market move after the U.S. midterm elections in November is still relevant! History doesn’t have to repeat itself, but Bitcoin keeps rising and will continue to rise into the elections as if it were some kind of magic! But all of this is already priced in, and whoever controls the asset can do whatever they want with it — and if they can, they will. Knowing that human psychology, and especially mass psychology, never changes. $BTC
894
·
--
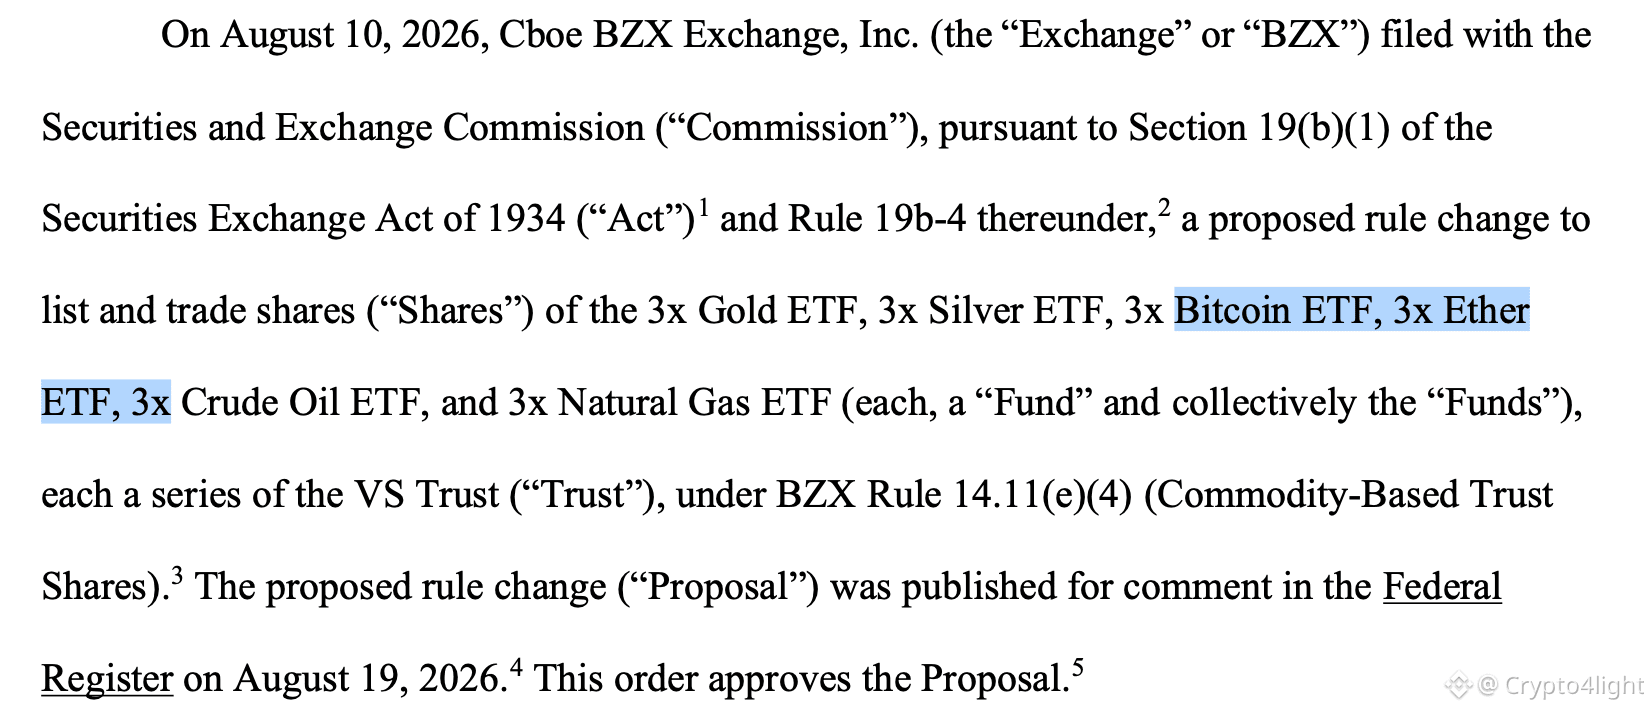
The SEC has approved Bitcoin and Ethereum ETFs with three times leverage. $BTC
{future}(BTCUSDT)
The SEC has approved Bitcoin and Ethereum ETFs with three times leverage. $BTC
1
2k
·
--
The Altcoin Season Is Starting? Are Altcoins Ready to Explode? $STRK $GLMR
The Altcoin Season Is Starting? Are Altcoins Ready to Explode? $STRK $GLMR
4
2.4k
·
--
Aptos Price Analysis. $APT Still Has Massive Potential?
Aptos Price Analysis. $APT Still Has Massive Potential?
1
1
14
9.9k
·
--
Рост
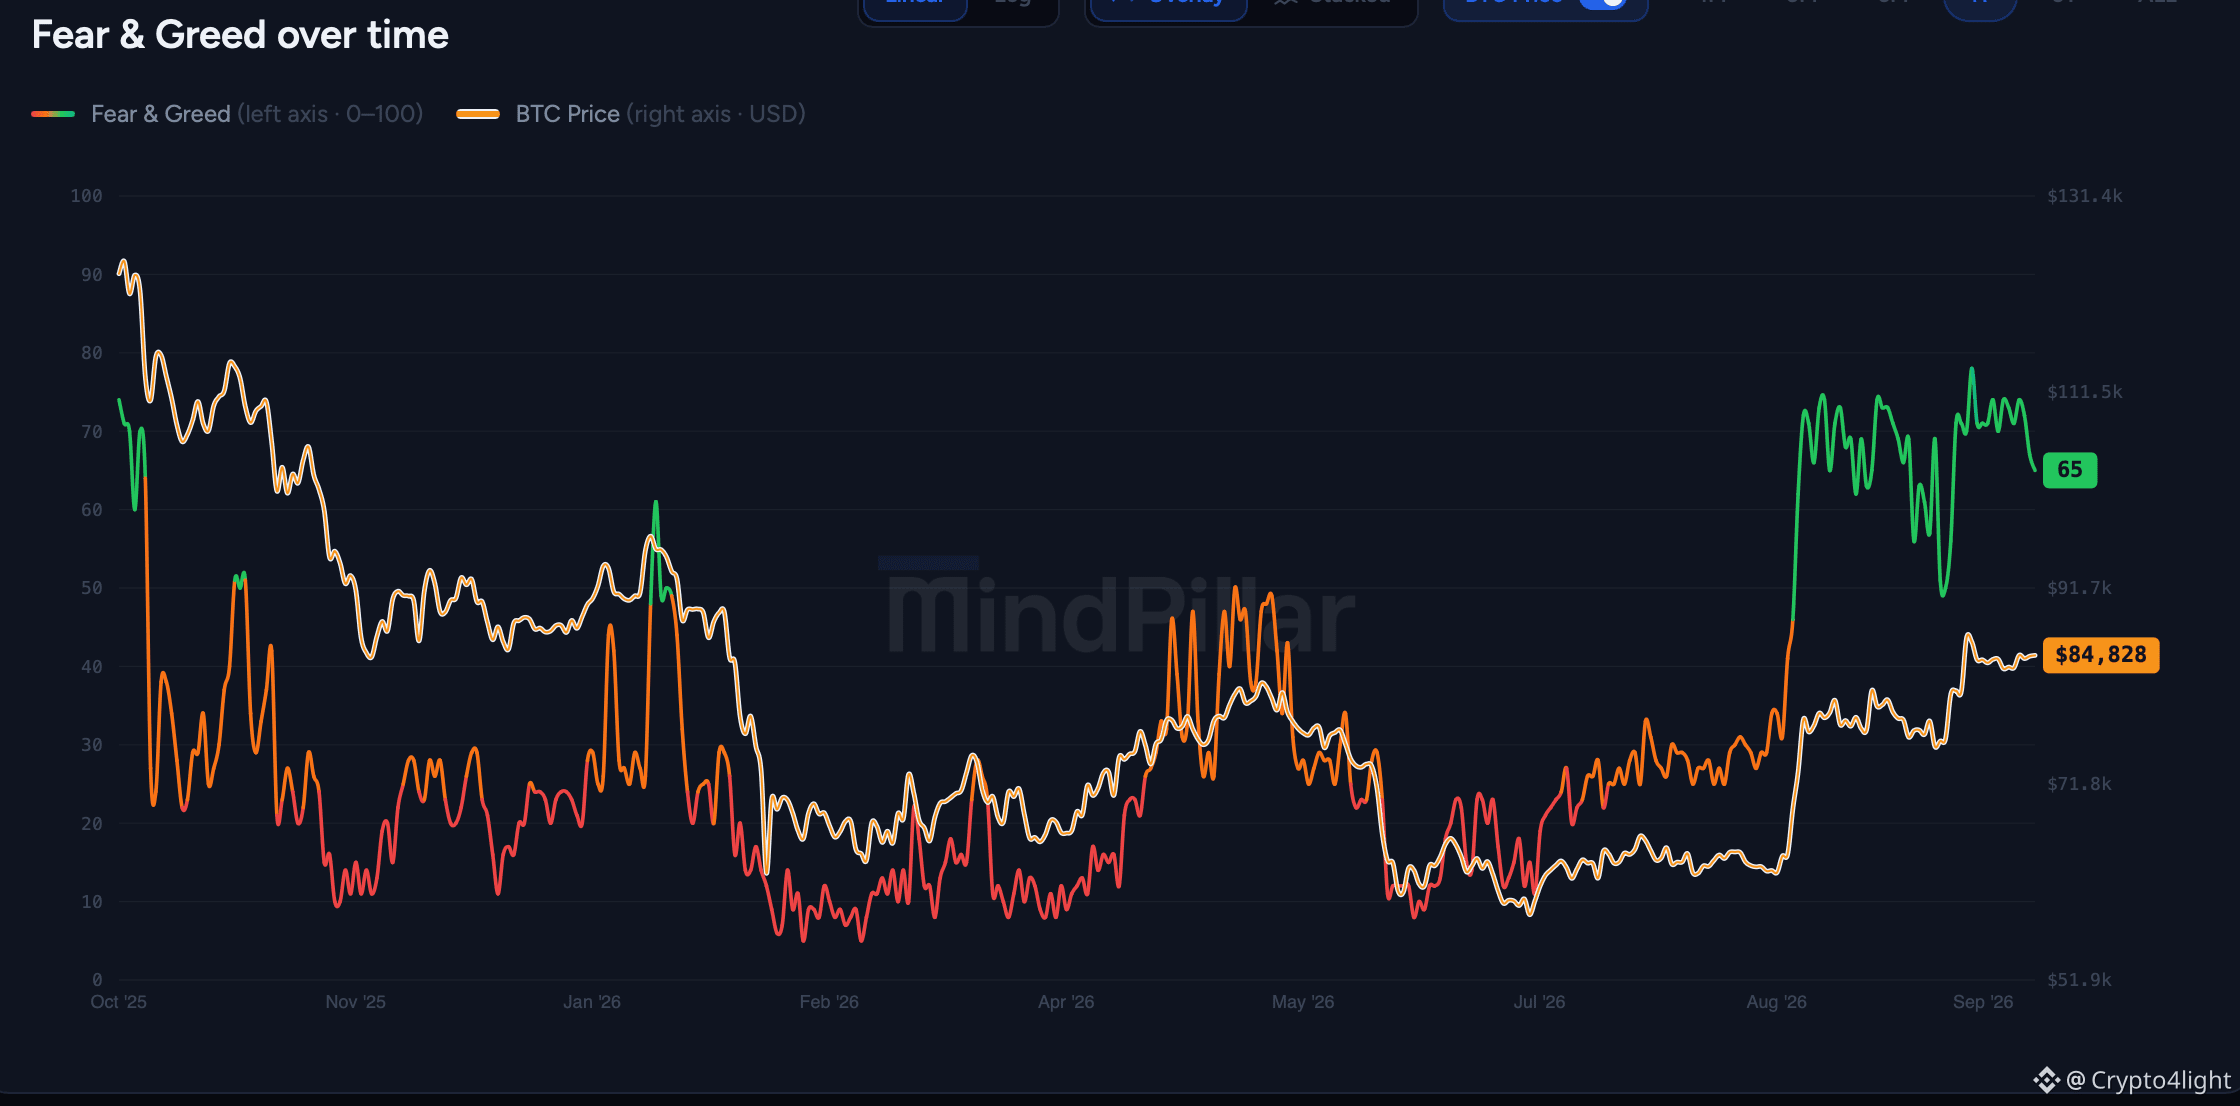
The fact that we’re seeing euphoria in the market right now is obvious, at least when it comes to Bitcoin! I wouldn’t say there’s any kind of madness around altcoins yet, since many altcoins haven’t even done 100% yet. So I recommend analyzing the list of coins that are still below the [Fundamental Value Line](https://www.binance.com/en/square/post/4320785715154) on the weekly charts! $BTC
{future}(BTCUSDT)
The fact that we’re seeing euphoria in the market right now is obvious, at least when it comes to Bitcoin! I wouldn’t say there’s any kind of madness around altcoins yet, since many altcoins haven’t even done 100% yet. So I recommend analyzing the list of coins that are still below the Fundamental Value Line on the weekly charts! $BTC
1
1.6k
·
--
Падение
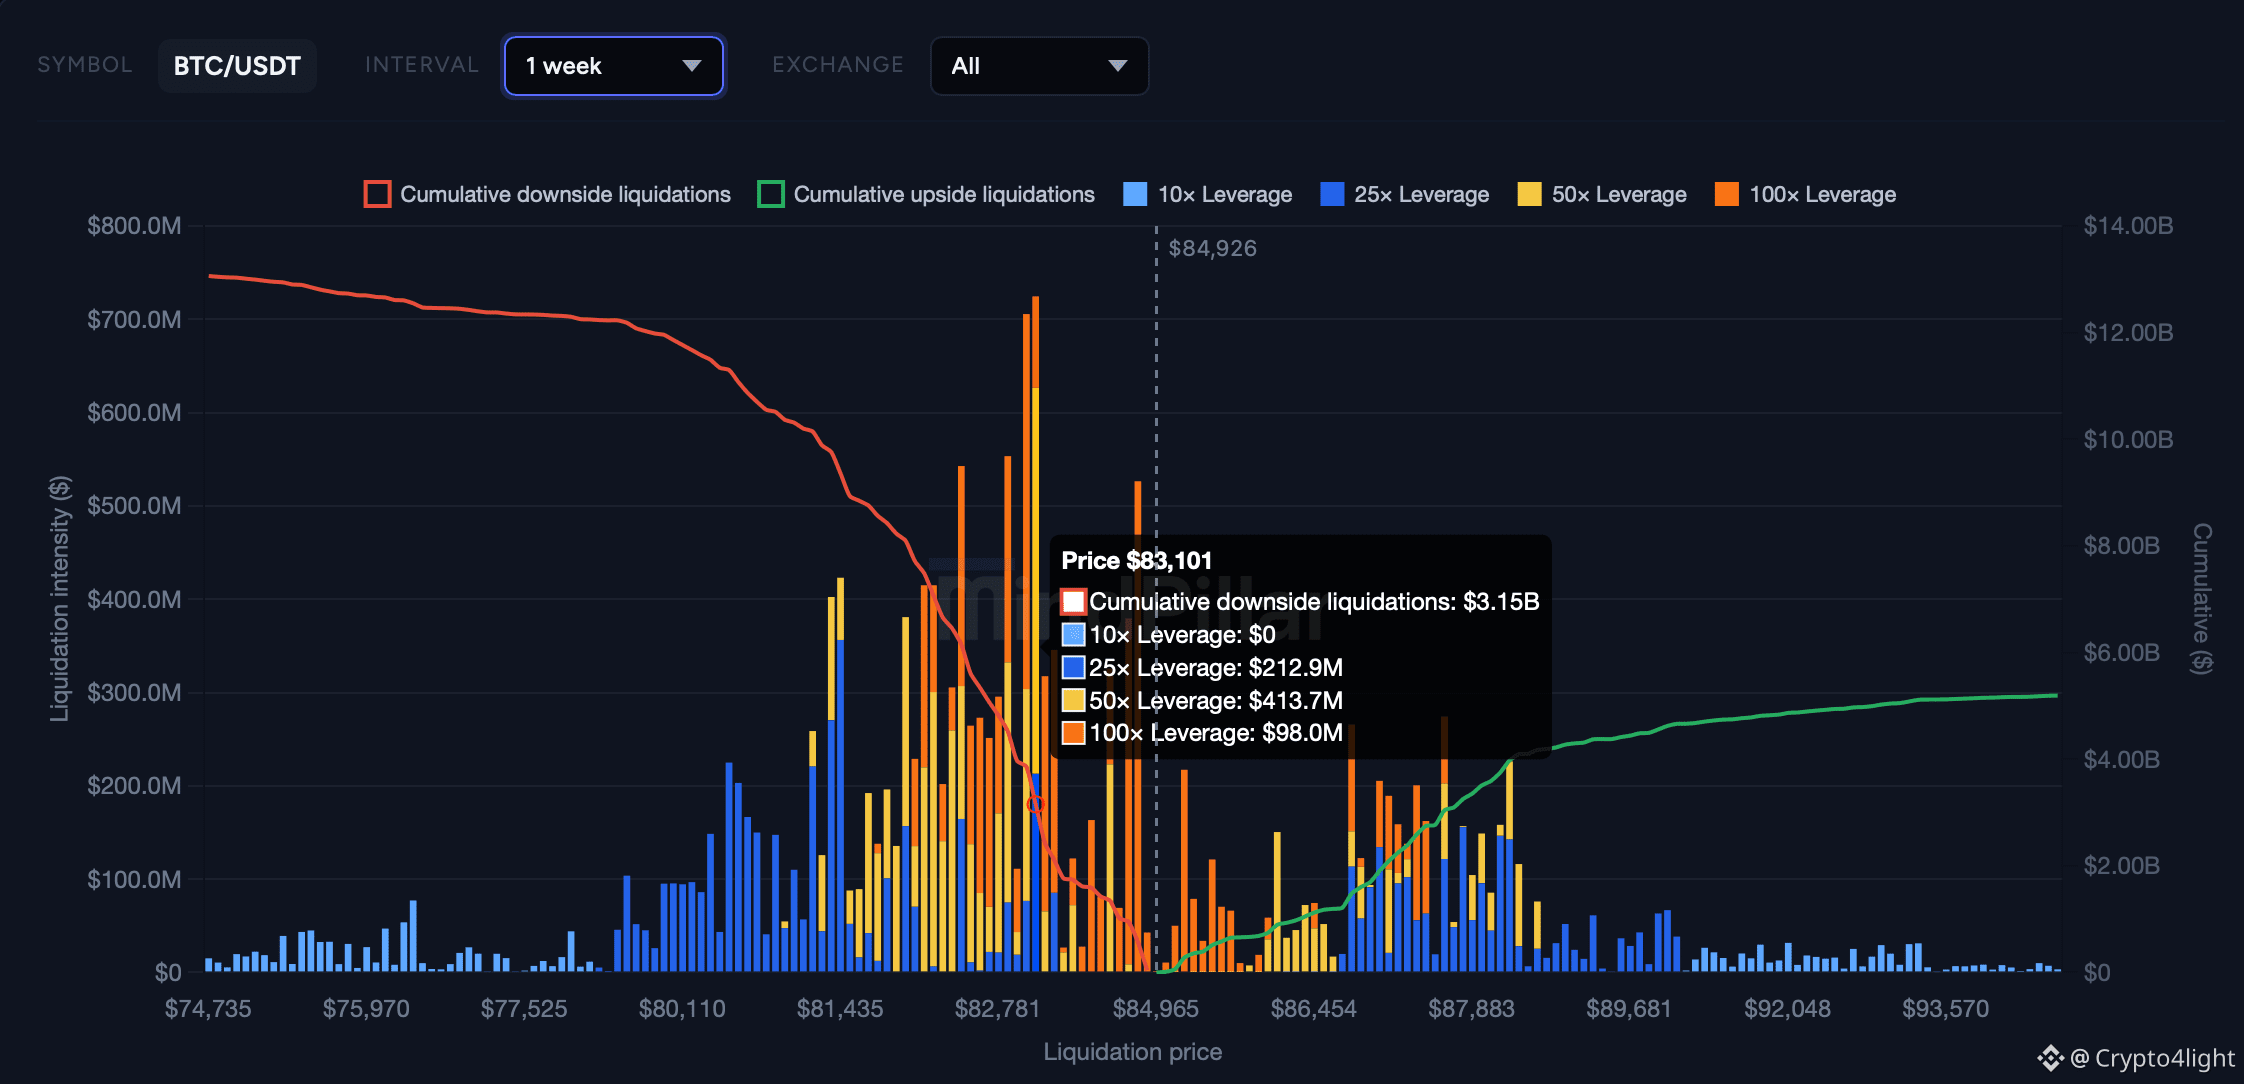
A local pullback to $83K could provide a decent amount of liquidations from late longs! $BTC
{future}(BTCUSDT)
A local pullback to $83K could provide a decent amount of liquidations from late longs! $BTC
1
861
·
--
Рост
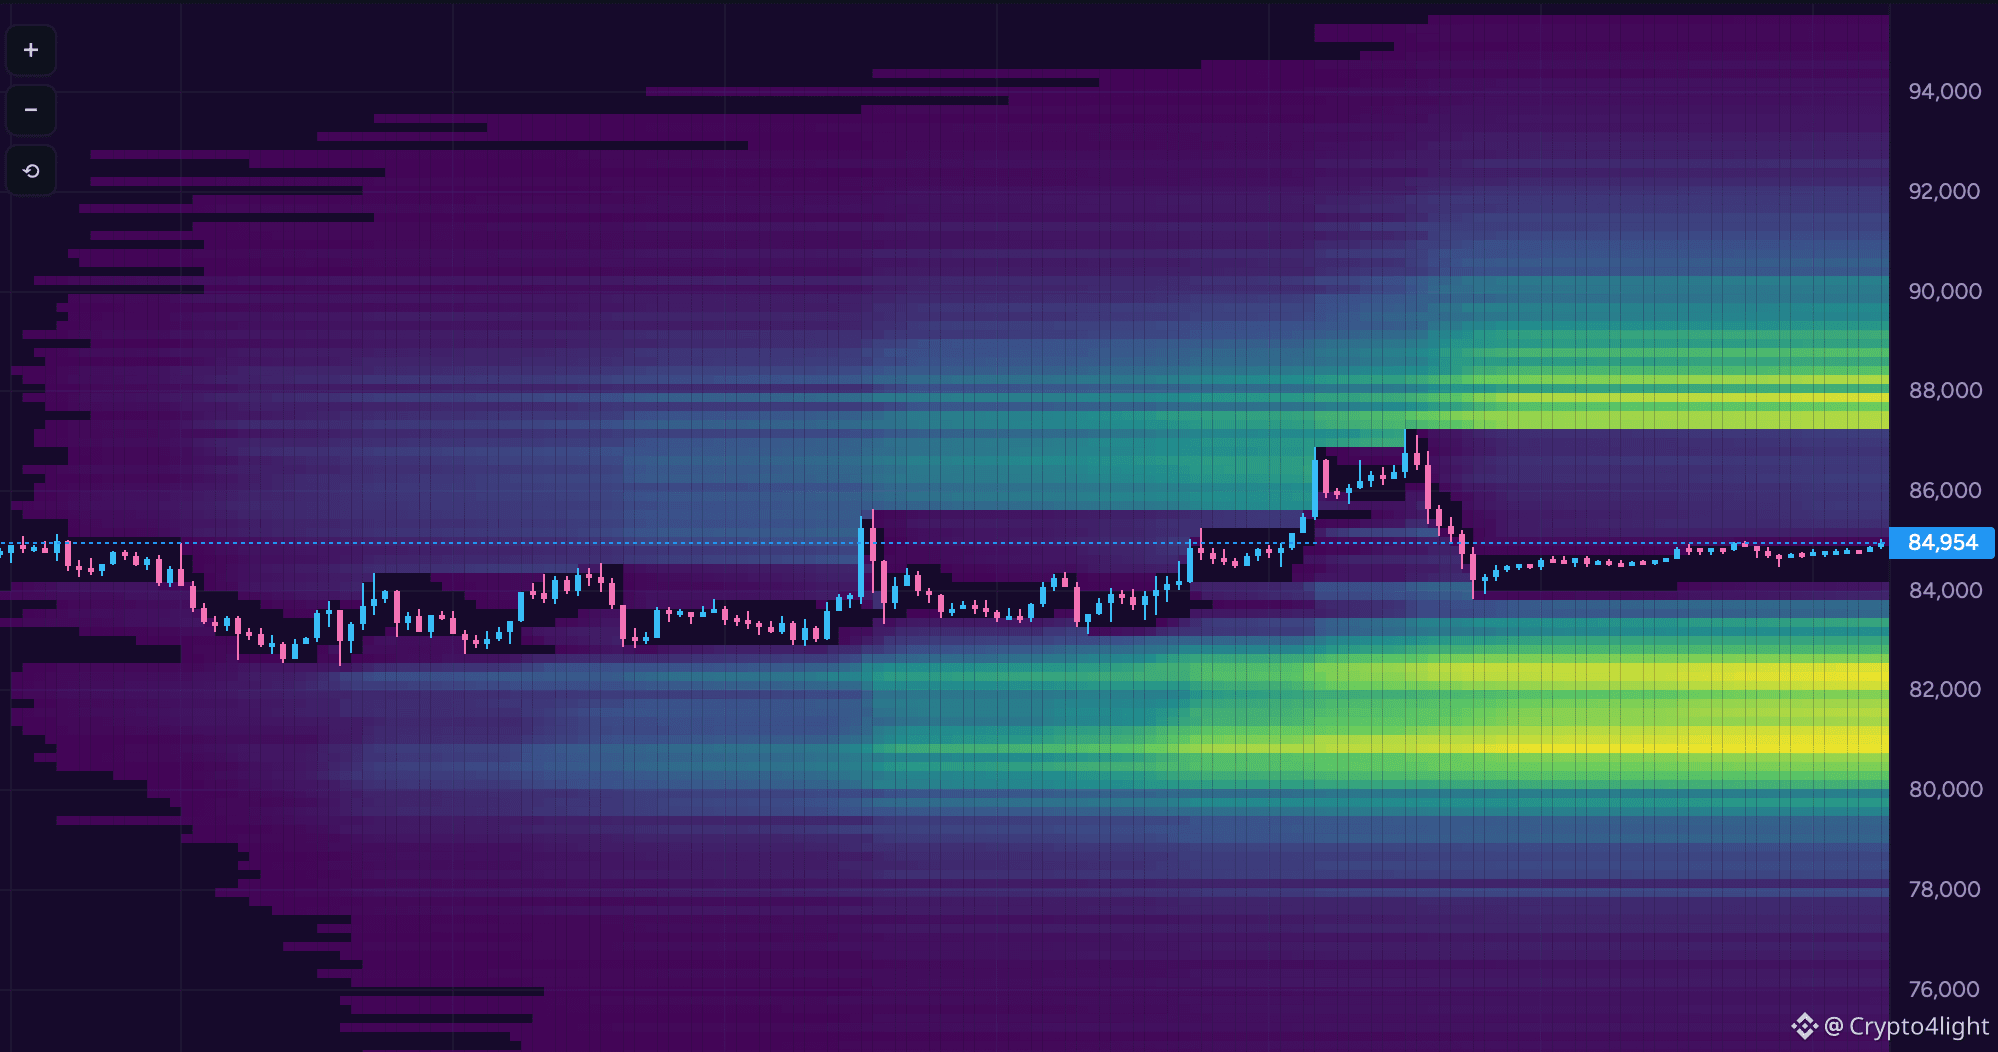
The liquidation map looks pretty much the same from both sides! Personally, I think the ideal scenario would be to push above $90K. Then, as we get closer to the U.S. elections, we could see even more positive sentiment in the market. The idea of giving $5,000 to every adult could also fuel the minds of crypto investors and encourage more people to jump into the market. Then, after the elections in November, we could see a correction. $BTC #BTC
{future}(BTCUSDT)
The liquidation map looks pretty much the same from both sides! Personally, I think the ideal scenario would be to push above $90K. Then, as we get closer to the U.S. elections, we could see even more positive sentiment in the market. The idea of giving $5,000 to every adult could also fuel the minds of crypto investors and encourage more people to jump into the market. Then, after the elections in November, we could see a correction. $BTC #BTC
2
4.1k
·
--
Why This Altseason Will Be Different? #altcoins #Altseason
Why This Altseason Will Be Different? #altcoins #Altseason
1
1.6k
·
--
ICP Price Analysis. Should We Go Higher? $ICP
ICP Price Analysis. Should We Go Higher? $ICP
16
9.6k
·
--
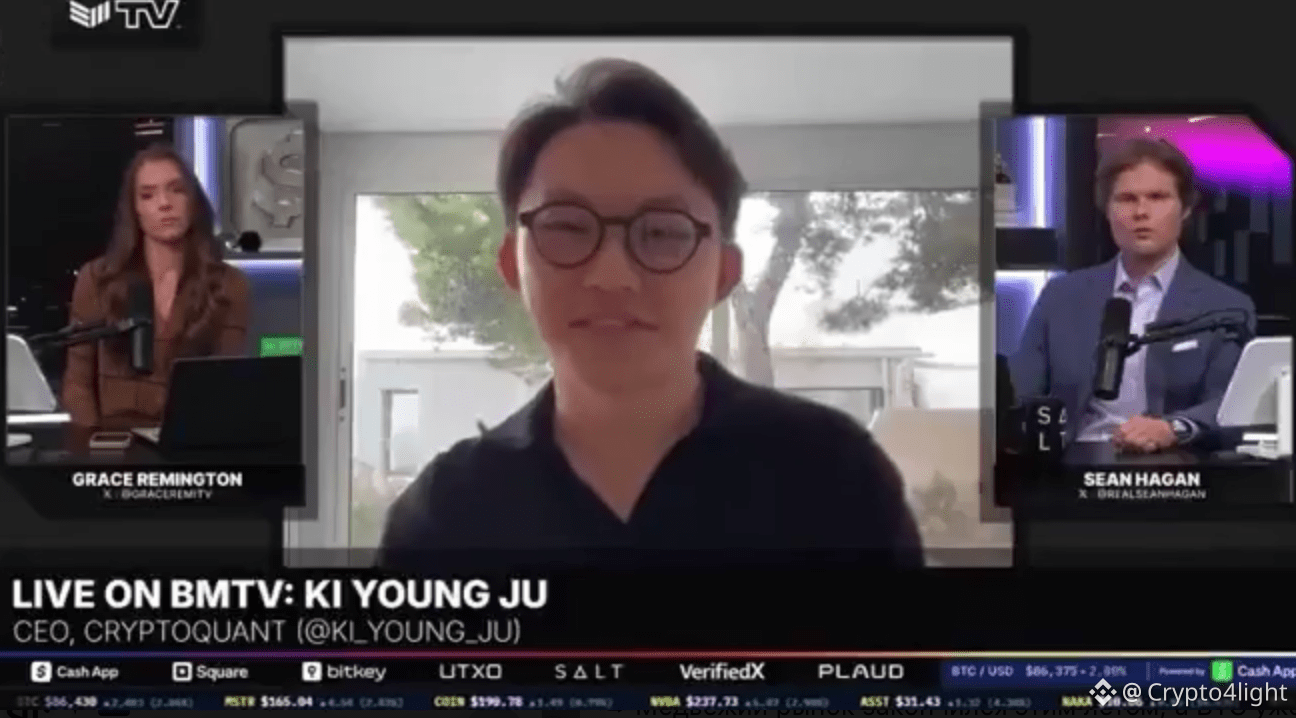
The CEO of CryptoQuant anticipates a $BTC increase of 3-5 times from the lows of the current cycle.
The bear market ended this summer, and BTC is already in the early stages of a new cycle.
They use a million different metrics and kept screaming that the bottom was still far away! What’s the point of using so many tools if they don’t provide the information you actually need?
You don’t need 100 indicators or 100 on-chain metrics! You need the tools that actually work! #BTC
{future}(BTCUSDT)
The CEO of CryptoQuant anticipates a $BTC increase of 3-5 times from the lows of the current cycle.
The bear market ended this summer, and BTC is already in the early stages of a new cycle.
They use a million different metrics and kept screaming that the bottom was still far away! What’s the point of using so many tools if they don’t provide the information you actually need?
You don’t need 100 indicators or 100 on-chain metrics! You need the tools that actually work! #BTC
The bear market ended this summer, and BTC is already in the early stages of a new cycle.
They use a million different metrics and kept screaming that the bottom was still far away! What’s the point of using so many tools if they don’t provide the information you actually need?
You don’t need 100 indicators or 100 on-chain metrics! You need the tools that actually work! #BTC
4
2k
·
--
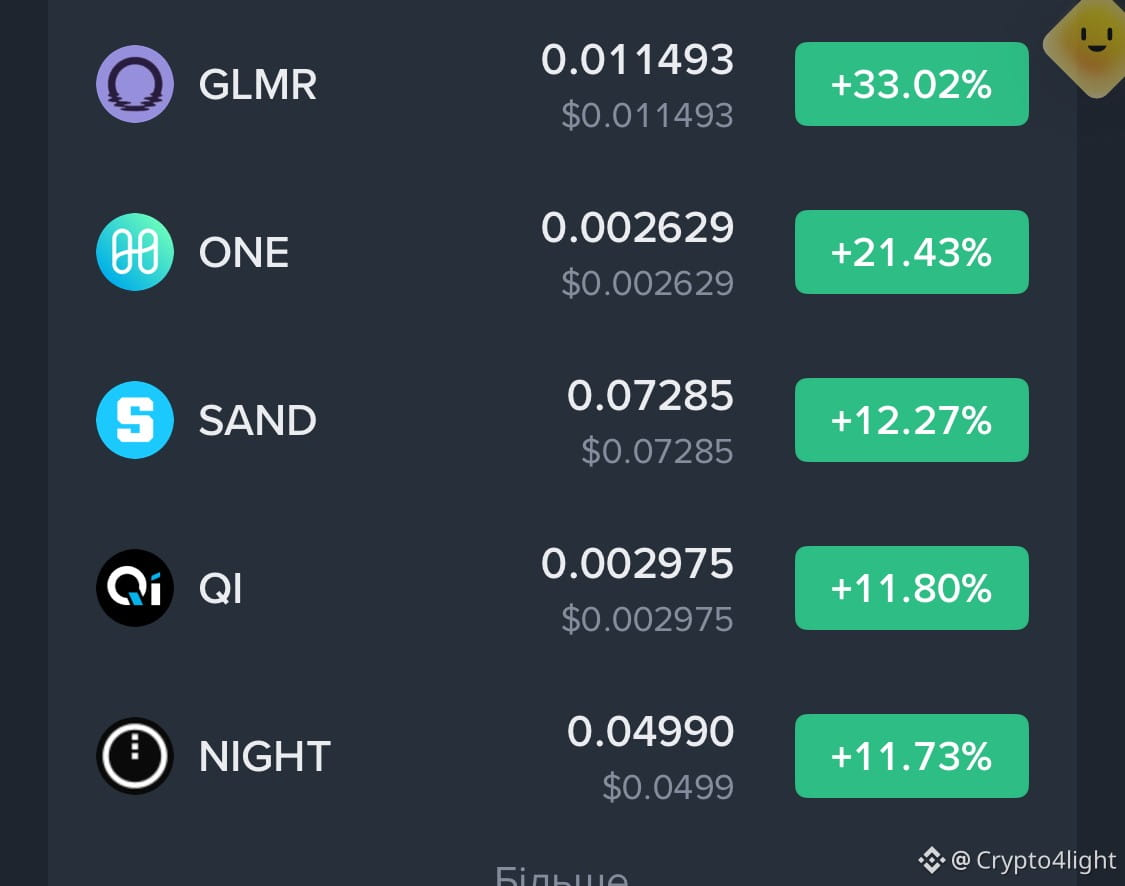
As always, only now that $GLMR
{spot}(GLMRUSDT)
is among the top gainers will people start looking for information about the token! Why did I buy it and show it to you a few days ago? All the alerts are set and waiting for notifications! As the move develops, I’ll take out my initial investment and leave the remaining tokens for free! Work with the tools! There are not that many, but there are still tokens trading below the Fundamental Value Line! Do your homework, don’t be lazy!
As always, only now that $GLMR
is among the top gainers will people start looking for information about the token! Why did I buy it and show it to you a few days ago? All the alerts are set and waiting for notifications! As the move develops, I’ll take out my initial investment and leave the remaining tokens for free! Work with the tools! There are not that many, but there are still tokens trading below the Fundamental Value Line! Do your homework, don’t be lazy!
is among the top gainers will people start looking for information about the token! Why did I buy it and show it to you a few days ago? All the alerts are set and waiting for notifications! As the move develops, I’ll take out my initial investment and leave the remaining tokens for free! Work with the tools! There are not that many, but there are still tokens trading below the Fundamental Value Line! Do your homework, don’t be lazy!
Crypto4light
·
--
$GLMR Price Analysis. I Bought GLMR — Here Are My Targets
2
2k
·
--
Crypto Altcoins to Watch NOW! $ONE and $IMX updates
Crypto Altcoins to Watch NOW! $ONE and $IMX updates
1
15
15.3k
·
--
Cardano Price Analysis. $ADA Quiet Before the Next Big Move?
Cardano Price Analysis. $ADA Quiet Before the Next Big Move?
2
9
10.9k
Войдите, чтобы посмотреть больше материала
Присоединяйтесь к пользователям криптовалют по всему миру на Binance Square
⚡️ Получайте новейшую и полезную информацию о криптоактивах.
💬 Нам доверяет крупнейшая в мире криптобиржа.
👍 Получите достоверные аналитические данные от верифицированных создателей контента.
Эл. почта/номер телефона
В тренде
Nikkei225Jumps2.5%ToThreeMonthHigh
Просмотров: 13,795
300 обсуждают
#Nikkei225Jumps2.5%ToThreeMonthHigh
🚀 Nikkei 225 Jumps 2.45% to Reach a 3-Month High!
Japan’s benchmark Nikkei 225 surged impressively on Monday, closing at 69,946.86 after briefly breaking above the milestone 70,000 level for the first time in three months.
💡 What’s Driving the Surge?
AI & Semiconductor Boom: Major tech leaders like Advantest and Tokyo Electron led the charge with robust gains.
Wall Street Momentum: Positive spillover from U.S. markets boosted overall investor confidence.
Macro Shifts: Cooler-than-expected U.S. jobs data eased fears, reducing expectations of an aggressive October Fed rate hike.
📊 Market Takeaway:
This powerful rally signals a strong resurgence of investor appetite for technology and AI-driven assets. However, traders should keep a close eye on elevated bond yields as an ongoing risk factor.
Do you think the Nikkei can successfully hold above 70,000 and power toward brand-new highs? Let us know your thoughts!
#JapanStocks #StockMarket" #AIStocks #Semiconductors #Investing #Nikkei225
$EWJ
Nurul Hasnat Samir
·Лайков: 0
·Просмотров: 240
DriftHackVictimsBeginClaims
Просмотров: 87,328
973 обсуждают
SolanaTokenizedStockVolumeTops$4.4BInSeptember
Просмотров: 8,488
98 обсуждают