


1. Graph Elements
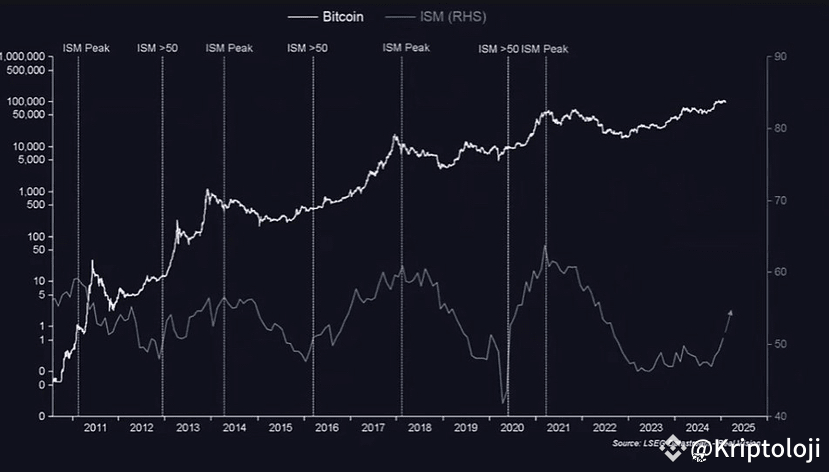
• $BTC (White Line, Left Axis): Represents Bitcoin’s price movements. The left vertical axis is logarithmic (1, 10, 100, 1,000, etc.).
• ISM Index (Blue Line, Right Axis): Represents the ISM Manufacturing Index, a key economic indicator in the US. The right vertical axis ranges from 0 to 90.
• Vertical Dashed Lines: Indicate periods when the ISM Index peaks or rises above 50.
2. What is the ISM Index and Why is it Important?
The ISM Manufacturing Index measures economic expansion or contraction in the US:
• ISM > 50: Signals economic growth, often accompanied by monetary expansion.
• ISM < 50: Signals economic contraction.
• ISM Peak: Marks the highest values of the ISM Index.
3. Relationship Between Bitcoin and ISM #BinanceAlphaAlert
• Bitcoin’s bull markets often align with declines in the ISM Index.
• After an ISM peak, Bitcoin typically enters an uptrend (e.g., in 2013, 2017, 2020).
• When the ISM falls or remains low, Bitcoin consolidates or prepares for a new bull cycle.
4. Current Situation and 2024 Forecast
• In 2024, the ISM Index is showing upward movement from its bottom (blue line rising).
• Historically, when the ISM rises above 50, Bitcoin tends to rise as well.
• Since the ISM hasn’t peaked yet, it’s premature to call a Bitcoin peak, suggesting BTC is still in the middle of its bull cycle.
• If history repeats, Bitcoin could see strong upward movement as the ISM continues to rise.
Conclusion
When the ISM Index rises above 50, it signals monetary expansion and typically triggers a Bitcoin rise. As the ISM hasn’t peaked yet, Bitcoin may still be in the midst of its bull cycle. The ISM recovery in 2024 could signify the start of a new rising phase for Bitcoin.
