

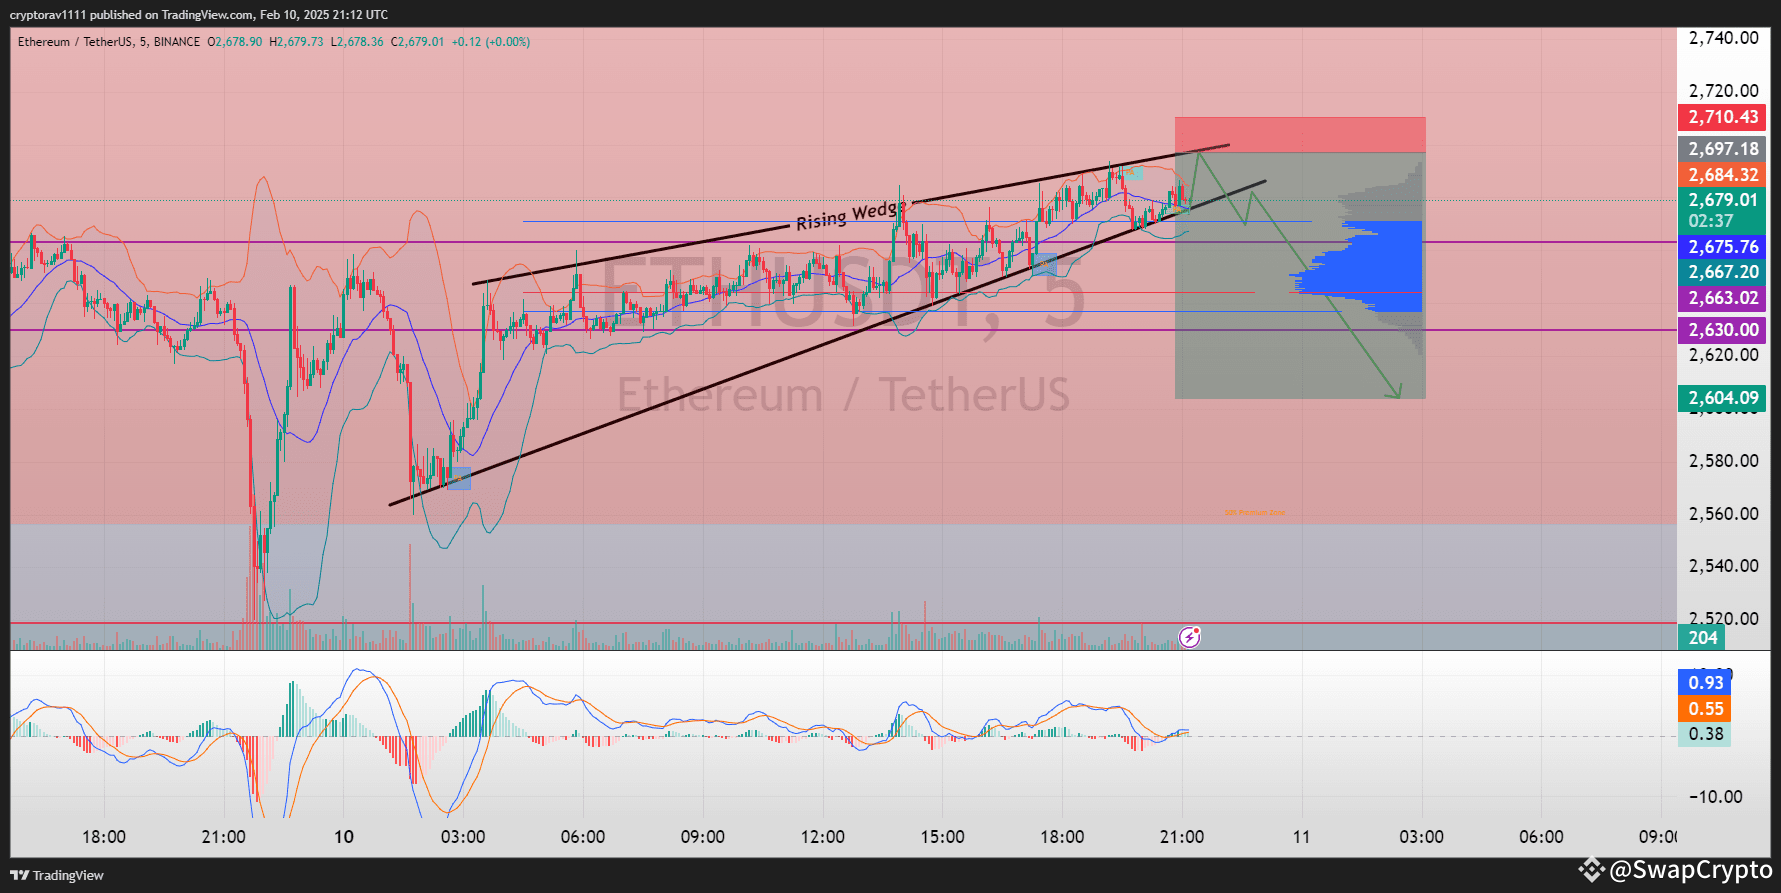
The chart above illustrates a potential rising wedge setup on Ethereum (ETH) against Tether (USDT). The price has been making its way up inside the wedge, which may indicate overextension. There is a resistance zone around 2,710 and 2,740, and the price is currently near the upper boundary of the wedge. The MACD shows some bullish momentum but is flattening out, indicating potential for reversal. The volume histogram indicates consolidation, and the price may retreat if it pierces the wedge's lower boundary around 2,630. Below this, the price may see further declines.
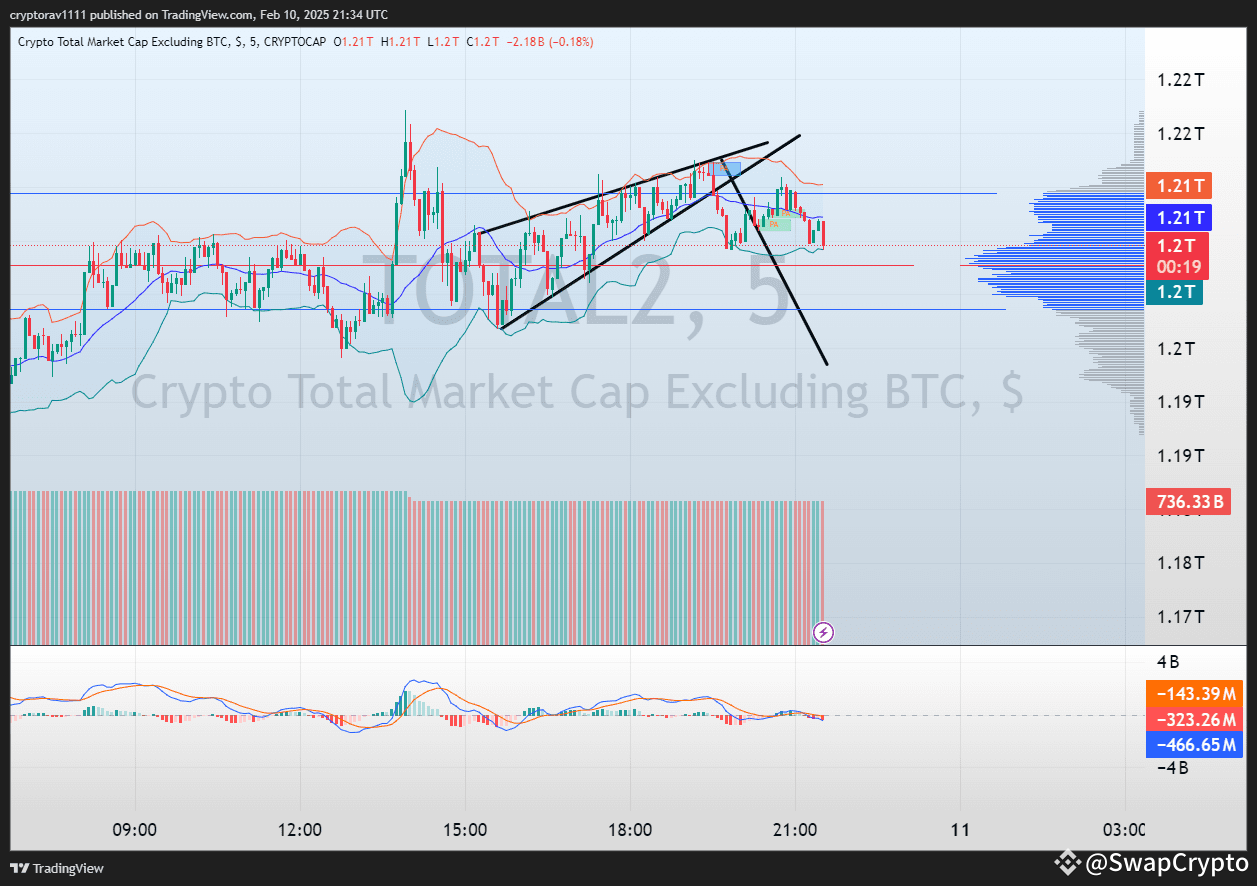
The Crypto Total Market Cap Excluding BTC chart is making what looks like a rising wedge formation, which in most cases results in a bearish reversal. At the moment, the price has broken below the lower boundary of the wedge, and this might suggest a possible short-term bearish trend. The MACD is showing a bearish divergence since momentum is weakening. The volume is low, which also favors the probability of a short pullback. At any break of the support around 1.2T, the price might extend further to the downside in the short run.
Entry: 2678.11
1st Tp: 2644.54
2nd Tp: 2620.50
3rd Tp : 2602.95
This signal is only for spot if you want future signals join my binance live.
Just click on my profile to join my live.