


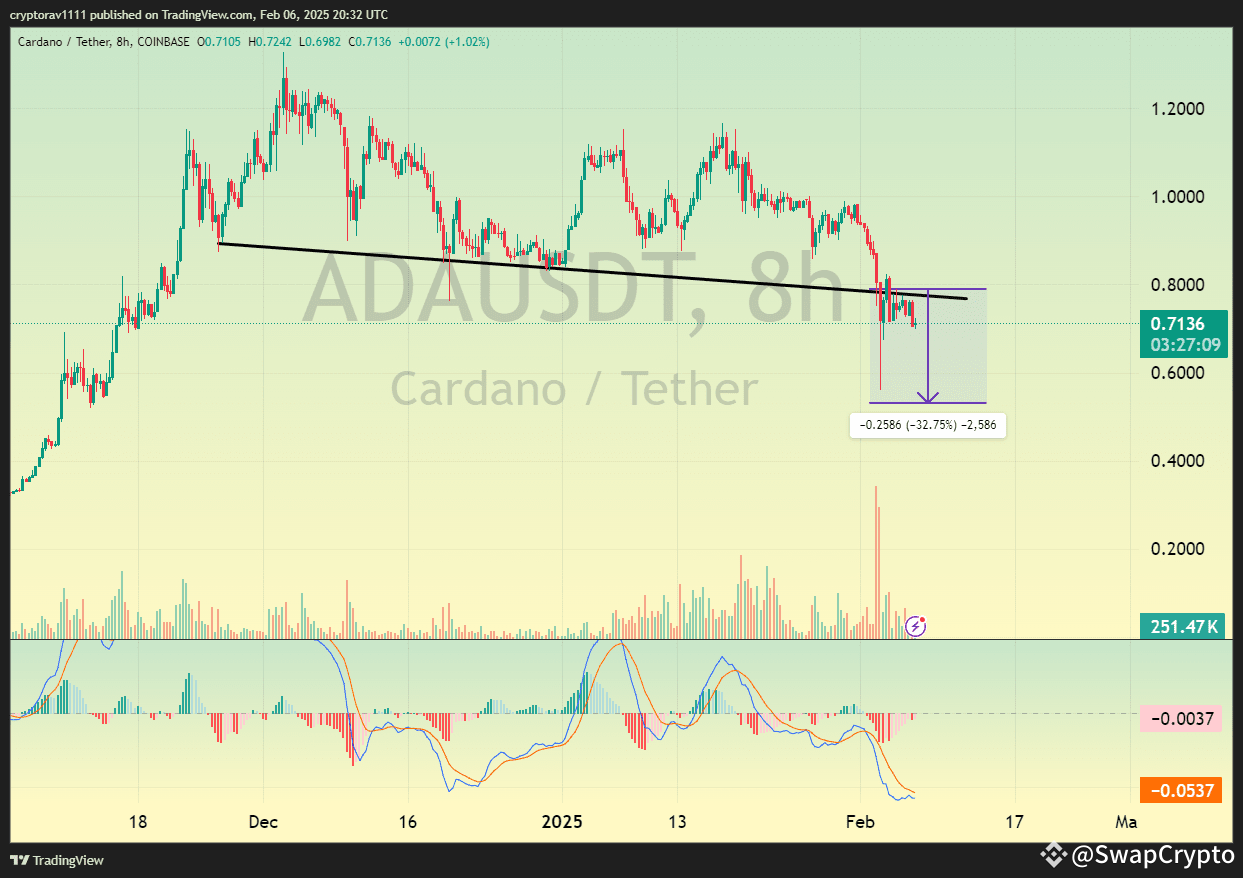
The above chart represents the price action of Cardano on an 8-hour time frame against Tether USDT. Recently, it has broken its key support trend line, which shows that it has bearish momentum. As the chart suggests, it may further drop 32.75% and take the price to around $0.2586. Together with the volume going up, the confirmation of the downward pressure occurs, and also on the MACD, as the blue line crosses below the orange line, the trend will be bearish. That does mean ADA can possibly continue into a downtrend.
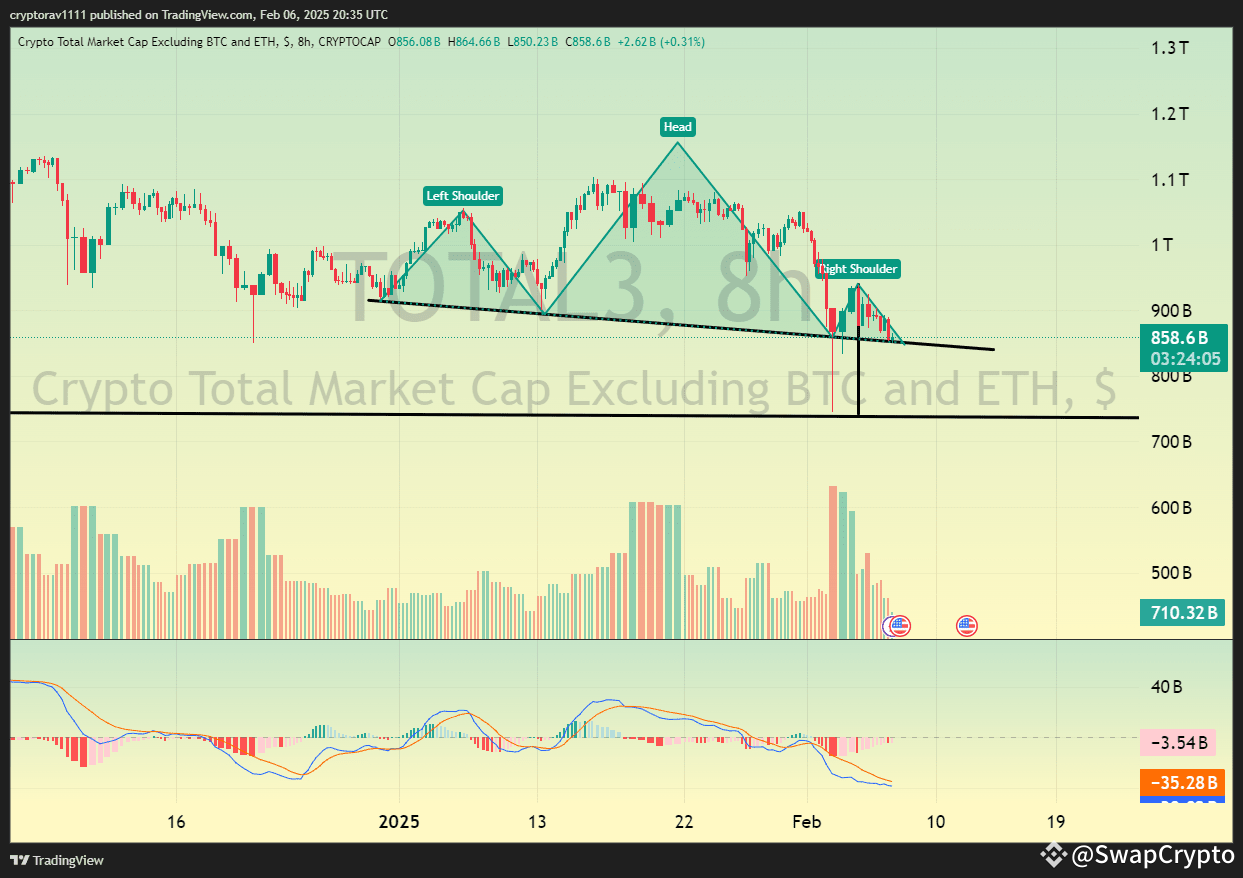
This is the sum of market capitalization of all cryptocurrencies with the exception of Bitcoin and Ethereum. This is starting to create a bearish Head and Shoulders pattern that might lead to its decline. Price has broken below the neckline and the market could continue lower. Volume spiked up to support the bearish move, and at the indicators, the MACD shows negative trending with growing red bars. That now suggests further downward pressure on the market, with the price going even lower than the current level of $858.6 billion.
Trade Details:
Entry: Around 0.7942 ( Join my Binance live for premium crypto signals )
1st Tp: 0.6467
2nd Tp: 0.5356

Important 👇
This signal is only for spot if you want future signals join my binance live.
Click on my profile picture to join my live stream, for 2-3 free signals.
If you want a premium signal you have to follow my live-stream instructions.