

COIN NAME- #TRUMP
SIGNAL TYPE- SHORT
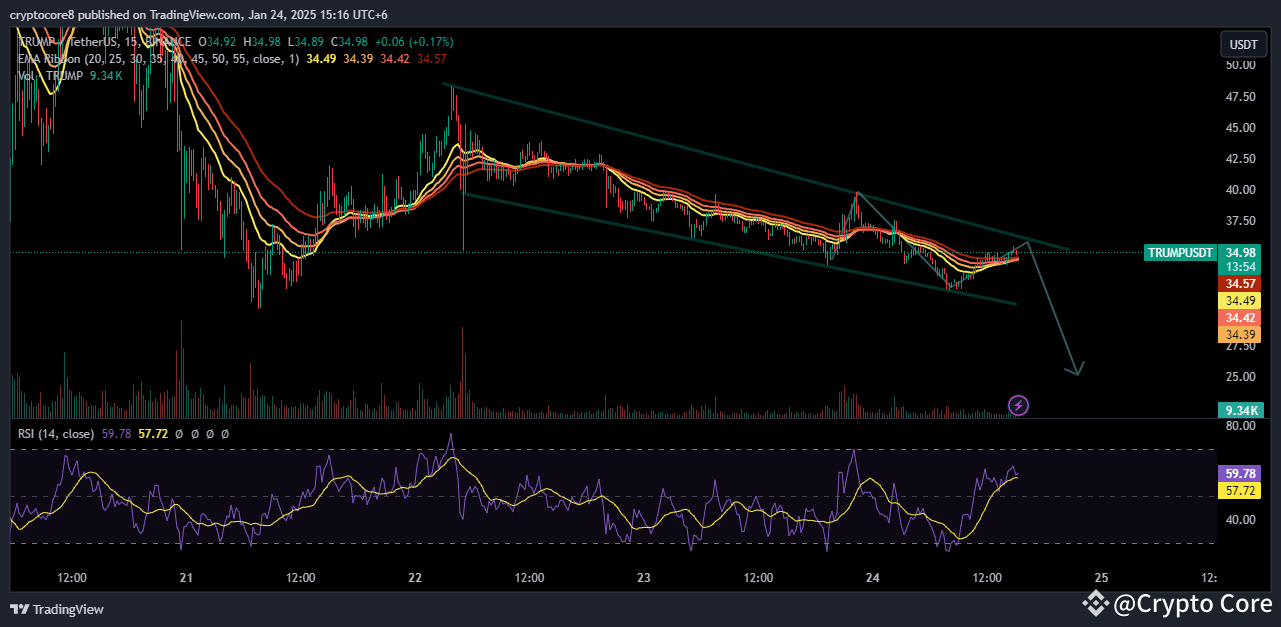
This TRUMP/USDT chart on a 15-minute timeframe displays a descending channel, indicating a bearish trend. The price is moving downward, consistently respecting the upper and lower trendlines. The EMA ribbon is above the price, reinforcing bearish momentum as it acts as a dynamic resistance. The RSI is at 57.72, nearing overbought territory, suggesting limited room for upside and increasing the probability of a downward move. A breakdown below the lower trendline would confirm further bearish continuation, potentially leading to a significant price drop. The overall chart setup highlights sustained selling pressure, suggesting a bearish outlook in the short term.
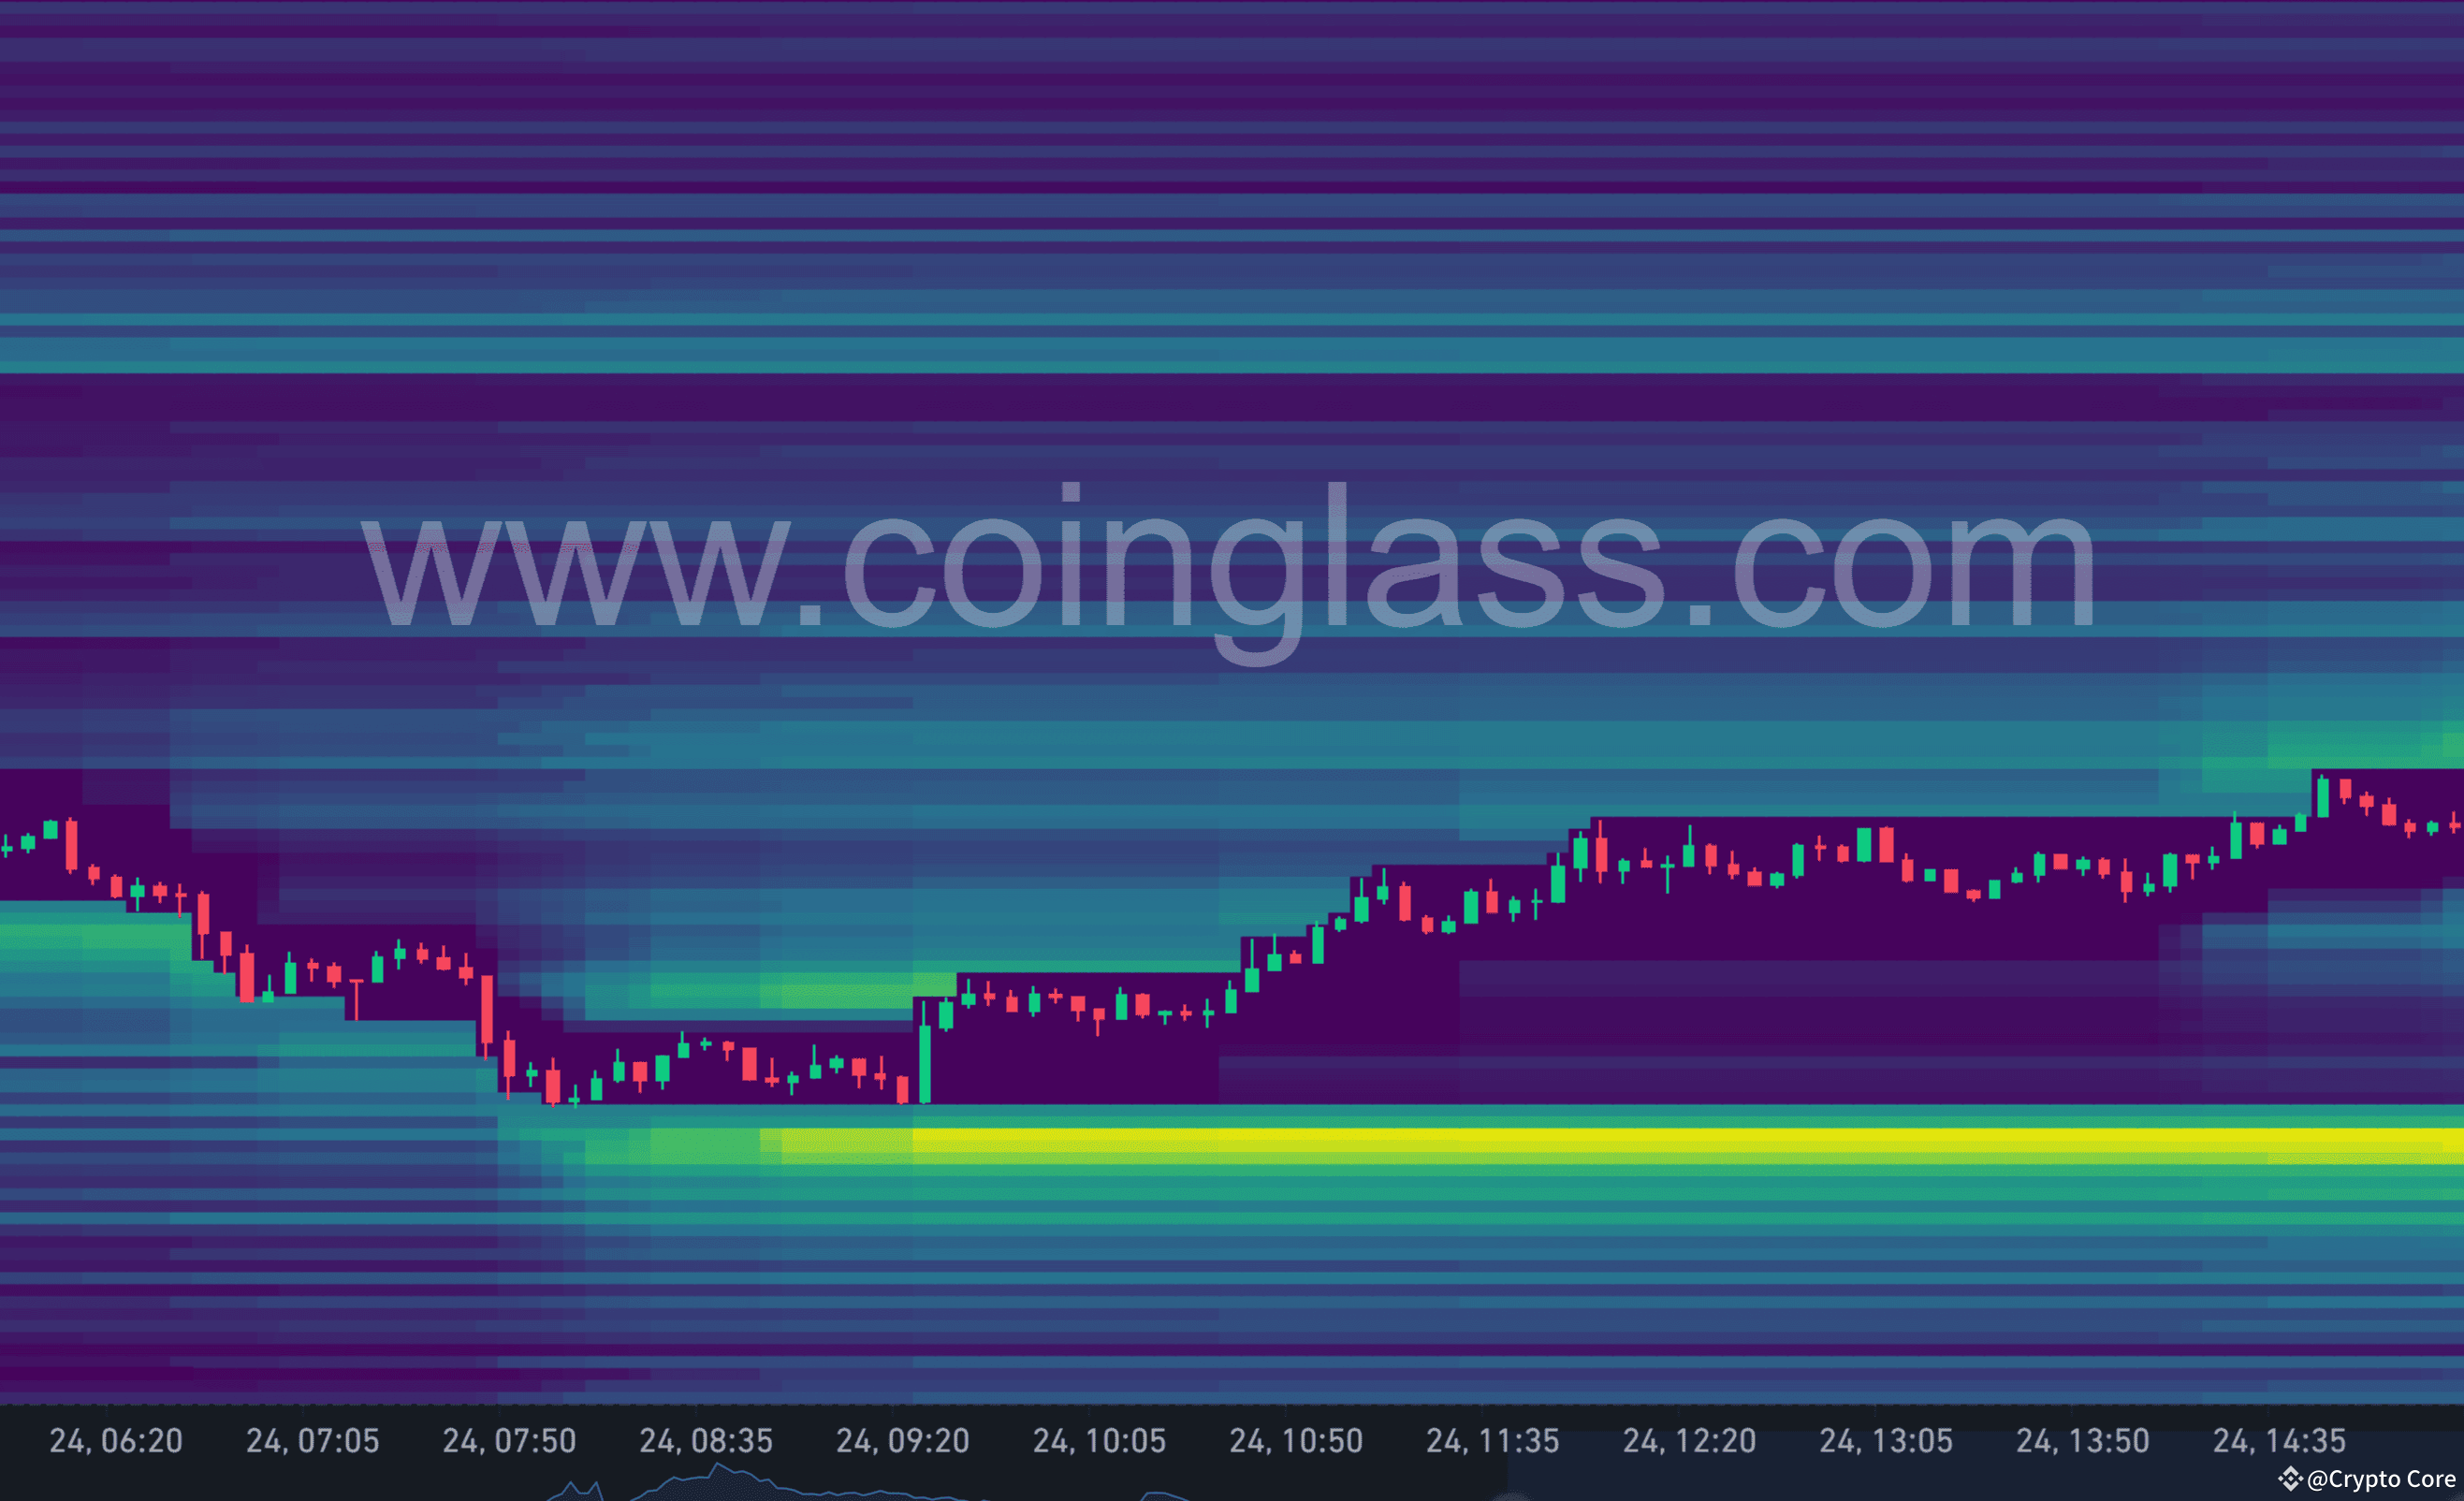
This TRUMP/USDT liquidation heatmap highlights increased liquidation around key resistance levels. Bright yellow zones indicate potential bearish pressure as liquidations may drive the price downward toward support zones.
Trade Details:
Entry: Around 35.00 ( Join my Binance live for premium crypto signals )
TP:25.00
SL: HOLD
$TRUMP
Important 👇
Click on my profile picture to join my live stream, for 2-3 free signals.
If you want a premium signal you have to follow my live-stream instruction.