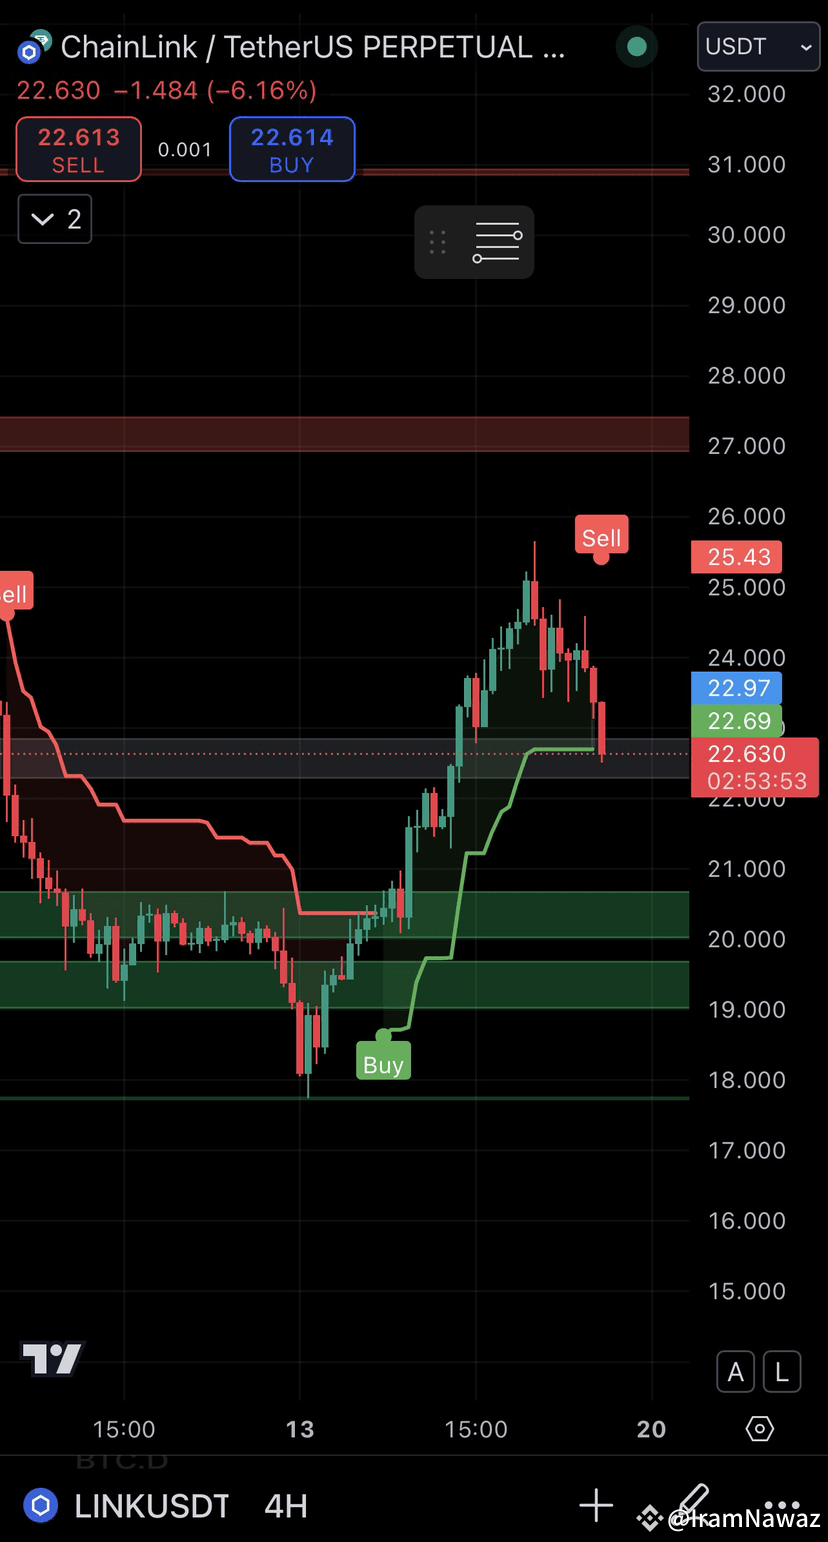
Based on the updated 4-hour chart for LINK/USDT, here is a revised technical analysis and trading strategy:
Technical Analysis:
1. Price Movement:
• The price has dropped to $22.63, showing a 6.16% decline from the previous level.
• It is now testing the key support zone around $22.69, which is critical for determining the next direction.
2. Support and Resistance:
• Immediate Support: $22.69 (current zone). If this holds, the price could bounce back.
• Secondary Support: $20.37 (next major demand zone).
• Resistance Levels: $24.00 (minor resistance) and $25.43 (strong sell zone).
3. Trend and Momentum:
• The overall uptrend has paused, with bearish pressure dominating in the short term.
• The decline suggests possible profit-taking or rejection at higher levels.
4. Indicators:
• The price has moved into a key buy zone, increasing the likelihood of a rebound.
• However, further bearish continuation is possible if $22.69 fails to hold.
Trading Signal:
1. Entry Points:
• Aggressive Buy: Enter near the current price at $22.63, assuming $22.69 holds as support.
• Conservative Buy: Wait for a retest of the $20.37 support zone for a stronger entry.
2. Stop-Loss Placement:
• Aggressive Entry: Place a stop-loss below $22.00.
• Conservative Entry: Place a stop-loss below $19.50 to avoid false breakdowns.
3. Take-Profit Targets:
• Target 1: $24.00 (near-term resistance).
• Target 2: $25.43 (major sell zone).
• Target 3: $27.00 (if bullish momentum resumes).
4. Risk-to-Reward Analysis:
• Aggressive Buy: Moderate R/R with tighter stop-loss and closer targets.
• Conservative Buy: Higher R/R with stronger support and better upside potential.
Intraday Strategy:
• Monitor the price action closely around $22.69. A strong bounce with volume could confirm a buy signal.
• If $22.69 is broken with strong bearish momentum, avoid longs and wait for $20.37 to be tested.
• Avoid holding trades below $22.00, as it could signal a larger downtrend.
Technical Analysis:
1. Price Movement:
• The price has dropped to $22.63, showing a 6.16% decline from the previous level.
• It is now testing the key support zone around $22.69, which is critical for determining the next direction.
2. Support and Resistance:
• Immediate Support: $22.69 (current zone). If this holds, the price could bounce back.
• Secondary Support: $20.37 (next major demand zone).
• Resistance Levels: $24.00 (minor resistance) and $25.43 (strong sell zone).
3. Trend and Momentum:
• The overall uptrend has paused, with bearish pressure dominating in the short term.
• The decline suggests possible profit-taking or rejection at higher levels.
4. Indicators:
• The price has moved into a key buy zone, increasing the likelihood of a rebound.
• However, further bearish continuation is possible if $22.69 fails to hold.
Trading Signal:
1. Entry Points:
• Aggressive Buy: Enter near the current price at $22.63, assuming $22.69 holds as support.
• Conservative Buy: Wait for a retest of the $20.37 support zone for a stronger entry.
2. Stop-Loss Placement:
• Aggressive Entry: Place a stop-loss below $22.00.
• Conservative Entry: Place a stop-loss below $19.50 to avoid false breakdowns.
3. Take-Profit Targets:
• Target 1: $24.00 (near-term resistance).
• Target 2: $25.43 (major sell zone).
• Target 3: $27.00 (if bullish momentum resumes).
4. Risk-to-Reward Analysis:
• Aggressive Buy: Moderate R/R with tighter stop-loss and closer targets.
• Conservative Buy: Higher R/R with stronger support and better upside potential.
Intraday Strategy:
• Monitor the price action closely around $22.69. A strong bounce with volume could confirm a buy signal.
• If $22.69 is broken with strong bearish momentum, avoid longs and wait for $20.37 to be tested.
• Avoid holding trades below $22.00, as it could signal a larger downtrend.