

#scrollonbinance
scrollonbinance
Просмотров: 14.1M
7,058 обсуждают
Scroll (SCR) is live on Binance, and the Scroll airdrop claim is open! How many SCR tokens did you receive? What’s your outlook on SCR’s future price movement? Share your SCR analysis 👀
Популярные
Новые

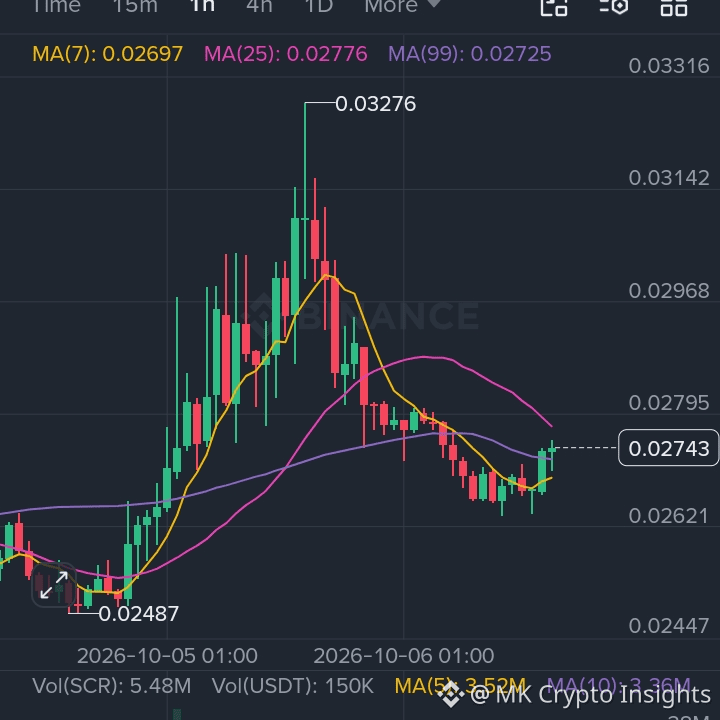
$SCR is down **11%** today, but it's showing signs of life 👀 It dropped from **0.0328** to a low of **0.0264**, and now it's bouncing at **0.02743**.
The latest green candle pushed it back above the MA7 (0.0270) and the MA99 (0.0273), and the dip was bought at the same spot twice. But it's still under the MA25 (0.0278), and volume is thin, so the bounce needs follow-through. It's also tagged "Monitoring" on Binance, so expect sharp swings. ⚠️
**My read: neutral, leaning toward a relief bounce.** Reclaim 0.0278 and 0.0295 opens up. Lose 0.0264 and the 0.0249 low is back in play.
I'm watching for confirmation, not guessing the bottom.
#SCR #ScrollOnBinance #ScrUsdt #SCRUSDTPriceAlert
{spot}(SCRUSDT)
$SCR is down **11%** today, but it's showing signs of life 👀 It dropped from **0.0328** to a low of **0.0264**, and now it's bouncing at **0.02743**.
The latest green candle pushed it back above the MA7 (0.0270) and the MA99 (0.0273), and the dip was bought at the same spot twice. But it's still under the MA25 (0.0278), and volume is thin, so the bounce needs follow-through. It's also tagged "Monitoring" on Binance, so expect sharp swings. ⚠️
**My read: neutral, leaning toward a relief bounce.** Reclaim 0.0278 and 0.0295 opens up. Lose 0.0264 and the 0.0249 low is back in play.
I'm watching for confirmation, not guessing the bottom.
#SCR #ScrollOnBinance #ScrUsdt #SCRUSDTPriceAlert
The latest green candle pushed it back above the MA7 (0.0270) and the MA99 (0.0273), and the dip was bought at the same spot twice. But it's still under the MA25 (0.0278), and volume is thin, so the bounce needs follow-through. It's also tagged "Monitoring" on Binance, so expect sharp swings. ⚠️
**My read: neutral, leaning toward a relief bounce.** Reclaim 0.0278 and 0.0295 opens up. Lose 0.0264 and the 0.0249 low is back in play.
I'm watching for confirmation, not guessing the bottom.
#SCR #ScrollOnBinance #ScrUsdt #SCRUSDTPriceAlert
258


·
--
🚀 Binance Pick — Your Predictions, Your Rewards! 🏆
Complete daily tasks, collect Scores, invite friends, and test your crypto market prediction skills! 🎯
💛 Complete daily check-ins
👥 Invite friends and earn eligible Scores
📈 Make smart market predictions
🏆 Climb the leaderboard and compete for rewards
The Binance Pick Reservation Reward Pool has reached 1,000,000 USDC! Remember, this is the total reward pool, not a guaranteed reward for every participant.
Stay active, do your research, and make every prediction count! 🔥
#EthereumPectraUpgrade #ScrollOnBinance #ETHBTCNewLow #USDC
🚀 Binance Pick — Your Predictions, Your Rewards! 🏆
Complete daily tasks, collect Scores, invite friends, and test your crypto market prediction skills! 🎯
💛 Complete daily check-ins
👥 Invite friends and earn eligible Scores
📈 Make smart market predictions
🏆 Climb the leaderboard and compete for rewards
The Binance Pick Reservation Reward Pool has reached 1,000,000 USDC! Remember, this is the total reward pool, not a guaranteed reward for every participant.
Stay active, do your research, and make every prediction count! 🔥
#EthereumPectraUpgrade #ScrollOnBinance #ETHBTCNewLow #USDC
Complete daily tasks, collect Scores, invite friends, and test your crypto market prediction skills! 🎯
💛 Complete daily check-ins
👥 Invite friends and earn eligible Scores
📈 Make smart market predictions
🏆 Climb the leaderboard and compete for rewards
The Binance Pick Reservation Reward Pool has reached 1,000,000 USDC! Remember, this is the total reward pool, not a guaranteed reward for every participant.
Stay active, do your research, and make every prediction count! 🔥
#EthereumPectraUpgrade #ScrollOnBinance #ETHBTCNewLow #USDC

168


Статья
🚀Unlock 100 USDT on Binance: Boost Your Crypto Trading Adventure!💰Cryptocurrency trading has opened up a world of opportunities for investors and traders alike, with platforms like Binance leading the charge. Binance, one of the largest cryptocurrency exchanges globally, offers a wide array of tools, tokens, and opportunities for both beginners and experienced traders. To make the journey even more rewarding, Binance often runs promotions that can give traders a head start—one such enticing offer is the chance to unlock 100 USDT (Tether) for free. But how can you take advantage of this, and what should you know about it? Let’s dive into it!
What is USDT and Why is it Important?
USDT, or Tether, is a stablecoin pegged to the value of the US dollar. Unlike volatile cryptocurrencies like Bitcoin or Ethereum, USDT is designed to maintain a steady value, making it a perfect choice for traders who want to hedge against market fluctuations. On Binance, USDT is widely used for trading pairs, offering liquidity and stability across hundreds of crypto assets.
When Binance offers users 100 USDT, it essentially provides the ability to start or enhance their trading activities with a significant amount of capital in a stable currency. This means you can take advantage of market opportunities without worrying about the immediate volatility in price.
How to Unlock 100 USDT on Binance
If you’re eager to claim the 100 USDT promotion on Binance, here are the steps you’ll typically need to follow:
1. Register on Binance: If you haven’t already, create an account on Binance. It’s a straightforward process requiring an email address, a strong password, and verification steps to ensure account security.
2. Complete Verification (KYC): To participate in most Binance promotions, you’ll need to complete the Know Your Customer (KYC) process. This involves submitting some personal identification documents to verify your identity, which ensures a safe and secure trading environment.
3. Participate in the Promotion: Binance regularly offers promotions where users can unlock rewards. For example, new users may receive bonuses like 100 USDT for completing certain tasks, such as making a deposit or executing a certain number of trades within a promotional period.
4. Claim Your Reward: Once you’ve met the promotion’s requirements, you’ll be able to claim your reward in your Binance wallet. This 100 USDT can be used immediately to start trading, staking, or even purchasing other cryptocurrencies.
5. Check the Terms and Conditions: It’s always important to read the terms and conditions associated with such offers. Some rewards may have withdrawal or usage restrictions, so be sure to fully understand the limitations before claiming your bonus.
Boosting Your Trading Adventure with USDT
Once you’ve unlocked your 100 USDT, it’s time to use it wisely. Here are a few ways to maximize this reward on Binance:
1. Spot Trading: Use USDT to buy and sell hundreds of cryptocurrencies available on Binance’s spot market. Since USDT is one of the most liquid pairs, it’s easy to find trading opportunities with low spreads.
2. Leverage in Futures Trading: Binance Futures allows you to trade with leverage, potentially multiplying your gains. While this involves more risk, experienced traders can use their USDT to take larger positions than their account balance would otherwise allow.
3. Staking and Savings: Binance offers flexible savings accounts and staking options for certain cryptocurrencies. By using your 100 USDT to buy assets that offer staking rewards, you can earn passive income over time.
4. Diversify Your Portfolio: With 100 USDT, you can begin diversifying into other crypto projects. Spread your holdings across promising altcoins, stablecoins, or decentralized finance (DeFi) tokens to create a balanced portfolio.
Risk Management is Key
While Binance’s 100 USDT reward can help you jumpstart your crypto journey, it’s important to trade carefully. Cryptocurrency markets are highly volatile, and while the stable nature of USDT can provide a buffer against price swings, it’s essential to manage your risks. Use tools like stop-loss orders and only invest in projects after thorough research.
Additionally, if you’re leveraging your USDT in futures trading, be mindful of how much you’re willing to lose. A solid risk management strategy is critical to long-term success in crypto trading.
Why Binance?
Binance’s global reputation as a trusted and feature-rich platform makes it an ideal place for both novice and experienced traders. Beyond the 100 USDT bonus, Binance offers:
• Low Fees: Binance has some of the lowest fees in the crypto industry, making trading more cost-effective.
• Wide Variety of Coins: With hundreds of coins listed, Binance provides unparalleled access to the cryptocurrency market.
• Educational Resources: Binance Academy offers a wealth of educational content, helping traders understand the market and make informed decisions.
• Security: Binance employs top-tier security measures to protect users’ funds and data, from two-factor authentication (2FA) to cold storage solutions.
Conclusion
The opportunity to unlock 100 USDT on Binance can give your crypto trading adventure a powerful start. Whether you’re looking to dive into trading, staking, or diversifying into new assets, this promotion is a fantastic incentive. As with any trading endeavor, approach with caution, stay informed, and make the most out of your 100 USDT reward by trading responsibly and strategically.
This could be the beginning of your next big move in the ever-expanding crypto space!
#Tradingadvancers #ScrollOnBinance #GameFiTokensRally #ScrollOnBinance #crypyoupdates
🚀Unlock 100 USDT on Binance: Boost Your Crypto Trading Adventure!💰
Cryptocurrency trading has opened up a world of opportunities for investors and traders alike, with platforms like Binance leading the charge. Binance, one of the largest cryptocurrency exchanges globally, offers a wide array of tools, tokens, and opportunities for both beginners and experienced traders. To make the journey even more rewarding, Binance often runs promotions that can give traders a head start—one such enticing offer is the chance to unlock 100 USDT (Tether) for free. But how can you take advantage of this, and what should you know about it? Let’s dive into it!
What is USDT and Why is it Important?
USDT, or Tether, is a stablecoin pegged to the value of the US dollar. Unlike volatile cryptocurrencies like Bitcoin or Ethereum, USDT is designed to maintain a steady value, making it a perfect choice for traders who want to hedge against market fluctuations. On Binance, USDT is widely used for trading pairs, offering liquidity and stability across hundreds of crypto assets.
When Binance offers users 100 USDT, it essentially provides the ability to start or enhance their trading activities with a significant amount of capital in a stable currency. This means you can take advantage of market opportunities without worrying about the immediate volatility in price.
How to Unlock 100 USDT on Binance
If you’re eager to claim the 100 USDT promotion on Binance, here are the steps you’ll typically need to follow:
1. Register on Binance: If you haven’t already, create an account on Binance. It’s a straightforward process requiring an email address, a strong password, and verification steps to ensure account security.
2. Complete Verification (KYC): To participate in most Binance promotions, you’ll need to complete the Know Your Customer (KYC) process. This involves submitting some personal identification documents to verify your identity, which ensures a safe and secure trading environment.
3. Participate in the Promotion: Binance regularly offers promotions where users can unlock rewards. For example, new users may receive bonuses like 100 USDT for completing certain tasks, such as making a deposit or executing a certain number of trades within a promotional period.
4. Claim Your Reward: Once you’ve met the promotion’s requirements, you’ll be able to claim your reward in your Binance wallet. This 100 USDT can be used immediately to start trading, staking, or even purchasing other cryptocurrencies.
5. Check the Terms and Conditions: It’s always important to read the terms and conditions associated with such offers. Some rewards may have withdrawal or usage restrictions, so be sure to fully understand the limitations before claiming your bonus.
Boosting Your Trading Adventure with USDT
Once you’ve unlocked your 100 USDT, it’s time to use it wisely. Here are a few ways to maximize this reward on Binance:
1. Spot Trading: Use USDT to buy and sell hundreds of cryptocurrencies available on Binance’s spot market. Since USDT is one of the most liquid pairs, it’s easy to find trading opportunities with low spreads.
2. Leverage in Futures Trading: Binance Futures allows you to trade with leverage, potentially multiplying your gains. While this involves more risk, experienced traders can use their USDT to take larger positions than their account balance would otherwise allow.
3. Staking and Savings: Binance offers flexible savings accounts and staking options for certain cryptocurrencies. By using your 100 USDT to buy assets that offer staking rewards, you can earn passive income over time.
4. Diversify Your Portfolio: With 100 USDT, you can begin diversifying into other crypto projects. Spread your holdings across promising altcoins, stablecoins, or decentralized finance (DeFi) tokens to create a balanced portfolio.
Risk Management is Key
While Binance’s 100 USDT reward can help you jumpstart your crypto journey, it’s important to trade carefully. Cryptocurrency markets are highly volatile, and while the stable nature of USDT can provide a buffer against price swings, it’s essential to manage your risks. Use tools like stop-loss orders and only invest in projects after thorough research.
Additionally, if you’re leveraging your USDT in futures trading, be mindful of how much you’re willing to lose. A solid risk management strategy is critical to long-term success in crypto trading.
Why Binance?
Binance’s global reputation as a trusted and feature-rich platform makes it an ideal place for both novice and experienced traders. Beyond the 100 USDT bonus, Binance offers:
• Low Fees: Binance has some of the lowest fees in the crypto industry, making trading more cost-effective.
• Wide Variety of Coins: With hundreds of coins listed, Binance provides unparalleled access to the cryptocurrency market.
• Educational Resources: Binance Academy offers a wealth of educational content, helping traders understand the market and make informed decisions.
• Security: Binance employs top-tier security measures to protect users’ funds and data, from two-factor authentication (2FA) to cold storage solutions.
Conclusion
The opportunity to unlock 100 USDT on Binance can give your crypto trading adventure a powerful start. Whether you’re looking to dive into trading, staking, or diversifying into new assets, this promotion is a fantastic incentive. As with any trading endeavor, approach with caution, stay informed, and make the most out of your 100 USDT reward by trading responsibly and strategically.
This could be the beginning of your next big move in the ever-expanding crypto space!
#Tradingadvancers #ScrollOnBinance #GameFiTokensRally #ScrollOnBinance #crypyoupdates
What is USDT and Why is it Important?
USDT, or Tether, is a stablecoin pegged to the value of the US dollar. Unlike volatile cryptocurrencies like Bitcoin or Ethereum, USDT is designed to maintain a steady value, making it a perfect choice for traders who want to hedge against market fluctuations. On Binance, USDT is widely used for trading pairs, offering liquidity and stability across hundreds of crypto assets.
When Binance offers users 100 USDT, it essentially provides the ability to start or enhance their trading activities with a significant amount of capital in a stable currency. This means you can take advantage of market opportunities without worrying about the immediate volatility in price.
How to Unlock 100 USDT on Binance
If you’re eager to claim the 100 USDT promotion on Binance, here are the steps you’ll typically need to follow:
1. Register on Binance: If you haven’t already, create an account on Binance. It’s a straightforward process requiring an email address, a strong password, and verification steps to ensure account security.
2. Complete Verification (KYC): To participate in most Binance promotions, you’ll need to complete the Know Your Customer (KYC) process. This involves submitting some personal identification documents to verify your identity, which ensures a safe and secure trading environment.
3. Participate in the Promotion: Binance regularly offers promotions where users can unlock rewards. For example, new users may receive bonuses like 100 USDT for completing certain tasks, such as making a deposit or executing a certain number of trades within a promotional period.
4. Claim Your Reward: Once you’ve met the promotion’s requirements, you’ll be able to claim your reward in your Binance wallet. This 100 USDT can be used immediately to start trading, staking, or even purchasing other cryptocurrencies.
5. Check the Terms and Conditions: It’s always important to read the terms and conditions associated with such offers. Some rewards may have withdrawal or usage restrictions, so be sure to fully understand the limitations before claiming your bonus.
Boosting Your Trading Adventure with USDT
Once you’ve unlocked your 100 USDT, it’s time to use it wisely. Here are a few ways to maximize this reward on Binance:
1. Spot Trading: Use USDT to buy and sell hundreds of cryptocurrencies available on Binance’s spot market. Since USDT is one of the most liquid pairs, it’s easy to find trading opportunities with low spreads.
2. Leverage in Futures Trading: Binance Futures allows you to trade with leverage, potentially multiplying your gains. While this involves more risk, experienced traders can use their USDT to take larger positions than their account balance would otherwise allow.
3. Staking and Savings: Binance offers flexible savings accounts and staking options for certain cryptocurrencies. By using your 100 USDT to buy assets that offer staking rewards, you can earn passive income over time.
4. Diversify Your Portfolio: With 100 USDT, you can begin diversifying into other crypto projects. Spread your holdings across promising altcoins, stablecoins, or decentralized finance (DeFi) tokens to create a balanced portfolio.
Risk Management is Key
While Binance’s 100 USDT reward can help you jumpstart your crypto journey, it’s important to trade carefully. Cryptocurrency markets are highly volatile, and while the stable nature of USDT can provide a buffer against price swings, it’s essential to manage your risks. Use tools like stop-loss orders and only invest in projects after thorough research.
Additionally, if you’re leveraging your USDT in futures trading, be mindful of how much you’re willing to lose. A solid risk management strategy is critical to long-term success in crypto trading.
Why Binance?
Binance’s global reputation as a trusted and feature-rich platform makes it an ideal place for both novice and experienced traders. Beyond the 100 USDT bonus, Binance offers:
• Low Fees: Binance has some of the lowest fees in the crypto industry, making trading more cost-effective.
• Wide Variety of Coins: With hundreds of coins listed, Binance provides unparalleled access to the cryptocurrency market.
• Educational Resources: Binance Academy offers a wealth of educational content, helping traders understand the market and make informed decisions.
• Security: Binance employs top-tier security measures to protect users’ funds and data, from two-factor authentication (2FA) to cold storage solutions.
Conclusion
The opportunity to unlock 100 USDT on Binance can give your crypto trading adventure a powerful start. Whether you’re looking to dive into trading, staking, or diversifying into new assets, this promotion is a fantastic incentive. As with any trading endeavor, approach with caution, stay informed, and make the most out of your 100 USDT reward by trading responsibly and strategically.
This could be the beginning of your next big move in the ever-expanding crypto space!
#Tradingadvancers #ScrollOnBinance #GameFiTokensRally #ScrollOnBinance #crypyoupdates
97
6
402
184.8k

·
--
Рост
Today Free Signal
🟢 Buy $FTM
0.6450-0.6760
Targets
0.6810
0.6855
0.6895
0.6940
0.6980
SL-0.6230
Riski trade
#ScrollOnBinance #Write2Earn! #writetowin #Write&Earn #writtoearn $FTM
Today Free Signal
🟢 Buy $FTM
0.6450-0.6760
Targets
0.6810
0.6855
0.6895
0.6940
0.6980
SL-0.6230
Riski trade
#ScrollOnBinance #Write2Earn! #writetowin #Write&Earn #writtoearn $FTM
🟢 Buy $FTM
0.6450-0.6760
Targets
0.6810
0.6855
0.6895
0.6940
0.6980
SL-0.6230
Riski trade
#ScrollOnBinance #Write2Earn! #writetowin #Write&Earn #writtoearn $FTM
1
2
317

Good day y'all
I Realised some Individuals are actually Confusing TGE for listing, now i to Enlight y'all on this issue
Token Generational Event Known as TGE!
*Think of it as a launched Event* whereby Token are been Distributed to the Community, Supporters, Investors etc..
as a form of Compensation
Whereas Listing Is when The Tokens are publicly made Available for Buying and Selling on Cryptocurrency exchanges ($BTC ) providing liquidity and Market Access
with this little Elaboration made available hope you can Grab 1 or 2 from it and understand as well #ScrollOnBinance #EthereumPectraUpgrade #BTC67KRebound #USJoblessClaimsDip #BTCETFDemandSurge
Good day y'all
I Realised some Individuals are actually Confusing TGE for listing, now i to Enlight y'all on this issue
Token Generational Event Known as TGE!
*Think of it as a launched Event* whereby Token are been Distributed to the Community, Supporters, Investors etc..
as a form of Compensation
Whereas Listing Is when The Tokens are publicly made Available for Buying and Selling on Cryptocurrency exchanges ($BTC ) providing liquidity and Market Access
with this little Elaboration made available hope you can Grab 1 or 2 from it and understand as well #ScrollOnBinance #EthereumPectraUpgrade #BTC67KRebound #USJoblessClaimsDip #BTCETFDemandSurge
I Realised some Individuals are actually Confusing TGE for listing, now i to Enlight y'all on this issue
Token Generational Event Known as TGE!
*Think of it as a launched Event* whereby Token are been Distributed to the Community, Supporters, Investors etc..
as a form of Compensation
Whereas Listing Is when The Tokens are publicly made Available for Buying and Selling on Cryptocurrency exchanges ($BTC ) providing liquidity and Market Access
with this little Elaboration made available hope you can Grab 1 or 2 from it and understand as well #ScrollOnBinance #EthereumPectraUpgrade #BTC67KRebound #USJoblessClaimsDip #BTCETFDemandSurge
1
6
390

·
--
Статья
🚀 Scroll (SCR) Launches at 1.94 USDT: A New Contender in the Crypto Space 🚀🚨🔶 The cryptocurrency landscape is ever-evolving, and one of the latest additions to this dynamic environment is Scroll (SCR). Launched at an initial price of 1.94 USDT, SCR has garnered significant attention in a relatively short period. As of now, it is trading at approximately 1.268 USDT on Binance, highlighting the volatile nature of the crypto market. This article delves into the details surrounding Scroll's launch, its current trading performance, and the potential implications for investors.
🔶 The Launch of Scroll (SCR)
Scroll made its debut in a climate ripe for innovation within the blockchain sector. As decentralized finance (DeFi) projects continue to gain traction, SCR aims to provide unique solutions tailored for the evolving needs of cryptocurrency enthusiasts. The initial launch price of 1.94 USDT positioned Scroll as an accessible entry point for many investors looking to diversify their portfolios.
The project was launched with a clear vision of enhancing transaction speeds and reducing costs in a landscape where scalability remains a significant challenge. Scroll's developers emphasized the importance of creating a user-friendly platform, which is crucial for attracting both seasoned investors and newcomers alike.
🔶 Current Trading Performance
Following its launch, SCR has experienced notable volatility, typical of many new cryptocurrencies. Currently trading at around 1.268 USDT on Binance, the token has seen fluctuations that have raised eyebrows within the trading community. While the price drop from its launch price might cause concern for some investors, it's essential to understand the broader market context.
In the world of cryptocurrencies, initial enthusiasm can lead to rapid price increases, followed by corrections. The 34% decrease from the launch price is a reflection of this trend, compounded by broader market dynamics and investor sentiment. However, many analysts believe that such fluctuations are not uncommon for emerging tokens, and that SCR's technology and vision could support a more stable price in the long run.
🔶 Factors Influencing SCR’s Price
Several factors contribute to the current trading price of Scroll (SCR). Market sentiment plays a critical role; investor confidence can be swayed by news, developments within the project, and the overall state of the cryptocurrency market. Additionally, regulatory news and macroeconomic factors can influence trading volumes and prices.
The project's roadmap is another crucial element. If Scroll can effectively execute its plans for enhancing scalability and usability, it may attract more investors. Transparency in operations and ongoing updates can also bolster investor confidence, encouraging a more stable price trajectory.
🔶 Community and Ecosystem Development
A strong community and robust ecosystem are vital for any cryptocurrency's success. Scroll has been proactive in engaging with its community through social media platforms and forums. Building a dedicated user base can significantly enhance a cryptocurrency's value proposition, as active participants contribute to its growth and stability.
The development of partnerships with other blockchain projects or traditional financial institutions could also enhance SCR’s credibility and reach. As Scroll works towards establishing itself within the broader crypto ecosystem, these relationships will be crucial for driving adoption and usage.
🔶 Looking Ahead: Future Prospects for Scroll (SCR)
While the current trading price of 1.268 USDT represents a decrease from its launch, it also opens up potential opportunities for investors. Those looking to enter the market may find SCR's lower price point appealing, especially if they believe in the project's long-term vision.
As Scroll continues to develop its technology and expand its ecosystem, market conditions may shift in its favor. The next few months will be critical in determining whether SCR can regain momentum and attract a more extensive user base. Continued transparency and effective communication from the development team will be vital in fostering trust and encouraging investor participation.
🔶 Conclusion
Scroll (SCR) has made a notable entrance into the cryptocurrency market, launching at 1.94 USDT and currently trading at 1.268 USDT. While the price fluctuation is a natural aspect of the crypto landscape, the project's commitment to innovation and community engagement could pave the way for future success. As always, potential investors should conduct thorough research and consider market trends before making investment decisions.#ScrollOnBinance
🚀 Scroll (SCR) Launches at 1.94 USDT: A New Contender in the Crypto Space 🚀🚨
🔶 The cryptocurrency landscape is ever-evolving, and one of the latest additions to this dynamic environment is Scroll (SCR). Launched at an initial price of 1.94 USDT, SCR has garnered significant attention in a relatively short period. As of now, it is trading at approximately 1.268 USDT on Binance, highlighting the volatile nature of the crypto market. This article delves into the details surrounding Scroll's launch, its current trading performance, and the potential implications for investors.
🔶 The Launch of Scroll (SCR)
Scroll made its debut in a climate ripe for innovation within the blockchain sector. As decentralized finance (DeFi) projects continue to gain traction, SCR aims to provide unique solutions tailored for the evolving needs of cryptocurrency enthusiasts. The initial launch price of 1.94 USDT positioned Scroll as an accessible entry point for many investors looking to diversify their portfolios.
The project was launched with a clear vision of enhancing transaction speeds and reducing costs in a landscape where scalability remains a significant challenge. Scroll's developers emphasized the importance of creating a user-friendly platform, which is crucial for attracting both seasoned investors and newcomers alike.
🔶 Current Trading Performance
Following its launch, SCR has experienced notable volatility, typical of many new cryptocurrencies. Currently trading at around 1.268 USDT on Binance, the token has seen fluctuations that have raised eyebrows within the trading community. While the price drop from its launch price might cause concern for some investors, it's essential to understand the broader market context.
In the world of cryptocurrencies, initial enthusiasm can lead to rapid price increases, followed by corrections. The 34% decrease from the launch price is a reflection of this trend, compounded by broader market dynamics and investor sentiment. However, many analysts believe that such fluctuations are not uncommon for emerging tokens, and that SCR's technology and vision could support a more stable price in the long run.
🔶 Factors Influencing SCR’s Price
Several factors contribute to the current trading price of Scroll (SCR). Market sentiment plays a critical role; investor confidence can be swayed by news, developments within the project, and the overall state of the cryptocurrency market. Additionally, regulatory news and macroeconomic factors can influence trading volumes and prices.
The project's roadmap is another crucial element. If Scroll can effectively execute its plans for enhancing scalability and usability, it may attract more investors. Transparency in operations and ongoing updates can also bolster investor confidence, encouraging a more stable price trajectory.
🔶 Community and Ecosystem Development
A strong community and robust ecosystem are vital for any cryptocurrency's success. Scroll has been proactive in engaging with its community through social media platforms and forums. Building a dedicated user base can significantly enhance a cryptocurrency's value proposition, as active participants contribute to its growth and stability.
The development of partnerships with other blockchain projects or traditional financial institutions could also enhance SCR’s credibility and reach. As Scroll works towards establishing itself within the broader crypto ecosystem, these relationships will be crucial for driving adoption and usage.
🔶 Looking Ahead: Future Prospects for Scroll (SCR)
While the current trading price of 1.268 USDT represents a decrease from its launch, it also opens up potential opportunities for investors. Those looking to enter the market may find SCR's lower price point appealing, especially if they believe in the project's long-term vision.
As Scroll continues to develop its technology and expand its ecosystem, market conditions may shift in its favor. The next few months will be critical in determining whether SCR can regain momentum and attract a more extensive user base. Continued transparency and effective communication from the development team will be vital in fostering trust and encouraging investor participation.
🔶 Conclusion
Scroll (SCR) has made a notable entrance into the cryptocurrency market, launching at 1.94 USDT and currently trading at 1.268 USDT. While the price fluctuation is a natural aspect of the crypto landscape, the project's commitment to innovation and community engagement could pave the way for future success. As always, potential investors should conduct thorough research and consider market trends before making investment decisions.#ScrollOnBinance
🔶 The Launch of Scroll (SCR)
Scroll made its debut in a climate ripe for innovation within the blockchain sector. As decentralized finance (DeFi) projects continue to gain traction, SCR aims to provide unique solutions tailored for the evolving needs of cryptocurrency enthusiasts. The initial launch price of 1.94 USDT positioned Scroll as an accessible entry point for many investors looking to diversify their portfolios.
The project was launched with a clear vision of enhancing transaction speeds and reducing costs in a landscape where scalability remains a significant challenge. Scroll's developers emphasized the importance of creating a user-friendly platform, which is crucial for attracting both seasoned investors and newcomers alike.
🔶 Current Trading Performance
Following its launch, SCR has experienced notable volatility, typical of many new cryptocurrencies. Currently trading at around 1.268 USDT on Binance, the token has seen fluctuations that have raised eyebrows within the trading community. While the price drop from its launch price might cause concern for some investors, it's essential to understand the broader market context.
In the world of cryptocurrencies, initial enthusiasm can lead to rapid price increases, followed by corrections. The 34% decrease from the launch price is a reflection of this trend, compounded by broader market dynamics and investor sentiment. However, many analysts believe that such fluctuations are not uncommon for emerging tokens, and that SCR's technology and vision could support a more stable price in the long run.
🔶 Factors Influencing SCR’s Price
Several factors contribute to the current trading price of Scroll (SCR). Market sentiment plays a critical role; investor confidence can be swayed by news, developments within the project, and the overall state of the cryptocurrency market. Additionally, regulatory news and macroeconomic factors can influence trading volumes and prices.
The project's roadmap is another crucial element. If Scroll can effectively execute its plans for enhancing scalability and usability, it may attract more investors. Transparency in operations and ongoing updates can also bolster investor confidence, encouraging a more stable price trajectory.
🔶 Community and Ecosystem Development
A strong community and robust ecosystem are vital for any cryptocurrency's success. Scroll has been proactive in engaging with its community through social media platforms and forums. Building a dedicated user base can significantly enhance a cryptocurrency's value proposition, as active participants contribute to its growth and stability.
The development of partnerships with other blockchain projects or traditional financial institutions could also enhance SCR’s credibility and reach. As Scroll works towards establishing itself within the broader crypto ecosystem, these relationships will be crucial for driving adoption and usage.
🔶 Looking Ahead: Future Prospects for Scroll (SCR)
While the current trading price of 1.268 USDT represents a decrease from its launch, it also opens up potential opportunities for investors. Those looking to enter the market may find SCR's lower price point appealing, especially if they believe in the project's long-term vision.
As Scroll continues to develop its technology and expand its ecosystem, market conditions may shift in its favor. The next few months will be critical in determining whether SCR can regain momentum and attract a more extensive user base. Continued transparency and effective communication from the development team will be vital in fostering trust and encouraging investor participation.
🔶 Conclusion
Scroll (SCR) has made a notable entrance into the cryptocurrency market, launching at 1.94 USDT and currently trading at 1.268 USDT. While the price fluctuation is a natural aspect of the crypto landscape, the project's commitment to innovation and community engagement could pave the way for future success. As always, potential investors should conduct thorough research and consider market trends before making investment decisions.#ScrollOnBinance
4
895

·
--
Статья
Decode Binance Chart Colour Lines: How These Colour Codes Inform Long and Short TradingIn the fast-paced world of cryptocurrency trading, having a clear understanding of market trends is crucial for making informed decisions. Binance, one of the leading cryptocurrency exchanges, uses color-coded lines in its charts to help traders analyze price movements effectively. This article will break down what the yellow, pink, and blue lines represent and how you can leverage this information for both long and short trading strategies.
Color Code Breakdown
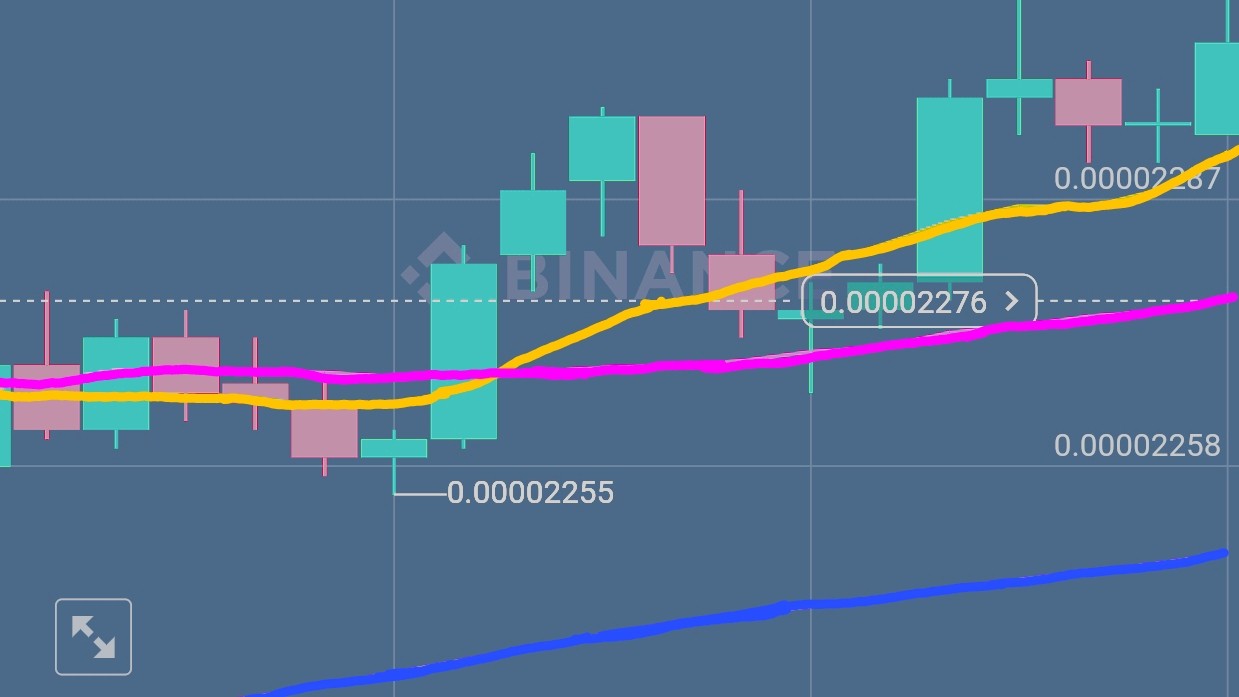
1. Yellow Line (50-Day Moving Average)
The yellow line typically represents the 50-day moving average (MA). This indicator smooths out price fluctuations over the last 50 days, helping traders identify the prevailing trend. A price above the yellow line often indicates bullish sentiment, while a price below it may signal bearish conditions.
2. Pink Line (20-Day Moving Average)
The pink line generally indicates the 20-day moving average. This short-term moving average provides insight into recent price trends and can help traders identify potential reversals. A common strategy is to buy when the price crosses above this line and sell when it crosses below.
3. Blue Line (200-Day Moving Average)
The blue line often represents the 200-day moving average, tracking price movements over a longer timeframe. This line helps traders understand the long-term market direction. Crossovers between the blue line and the yellow or pink lines can signal significant market shifts, aiding traders in their decisions.
Trading Strategies: Long and Short Positions
For Long Positions:
Identify Bullish Signals:
Look for the pink line to cross above the yellow line while the price is above the blue line. This indicates a strong uptrend, suggesting a buying opportunity.
Entry Points:
Consider entering a long position when these conditions are met, especially if the overall market sentiment is positive.
Risk Management:
Use stop-loss orders just below the yellow line to protect against sudden downturns.
For Short Positions:
Identify Bearish Signals:
Watch for the pink line to cross below the yellow line while the price is below the blue line. This may signal a strong downtrend, indicating a selling opportunity.
Entry Points:
Enter a short position when these conditions align, particularly if the broader market is showing signs of weakness.
Risk Management:
Implement stop-loss orders just above the pink line to limit potential losses.
Conclusion
By understanding the significance of the color codes in Binance charts, traders can gain valuable insights into market trends and make informed decisions for both long and short trading strategies. The yellow, pink, and blue lines not only provide a clear picture of market dynamics but also serve as essential tools for navigating the often volatile cryptocurrency landscape. Whether you're just starting or looking to refine your trading skills, mastering these indicators can enhance your trading effectiveness.
#ColourLinesMeaning
#TradingTips
#CryptoPreUSElection
#USJoblessClaimsDip
#ScrollOnBinance
$SOL $XRP $ETH
Decode Binance Chart Colour Lines: How These Colour Codes Inform Long and Short Trading
In the fast-paced world of cryptocurrency trading, having a clear understanding of market trends is crucial for making informed decisions. Binance, one of the leading cryptocurrency exchanges, uses color-coded lines in its charts to help traders analyze price movements effectively. This article will break down what the yellow, pink, and blue lines represent and how you can leverage this information for both long and short trading strategies.
Color Code Breakdown
1. Yellow Line (50-Day Moving Average)
The yellow line typically represents the 50-day moving average (MA). This indicator smooths out price fluctuations over the last 50 days, helping traders identify the prevailing trend. A price above the yellow line often indicates bullish sentiment, while a price below it may signal bearish conditions.
2. Pink Line (20-Day Moving Average)
The pink line generally indicates the 20-day moving average. This short-term moving average provides insight into recent price trends and can help traders identify potential reversals. A common strategy is to buy when the price crosses above this line and sell when it crosses below.
3. Blue Line (200-Day Moving Average)
The blue line often represents the 200-day moving average, tracking price movements over a longer timeframe. This line helps traders understand the long-term market direction. Crossovers between the blue line and the yellow or pink lines can signal significant market shifts, aiding traders in their decisions.
Trading Strategies: Long and Short Positions
For Long Positions:
Identify Bullish Signals:
Look for the pink line to cross above the yellow line while the price is above the blue line. This indicates a strong uptrend, suggesting a buying opportunity.
Entry Points:
Consider entering a long position when these conditions are met, especially if the overall market sentiment is positive.
Risk Management:
Use stop-loss orders just below the yellow line to protect against sudden downturns.
For Short Positions:
Identify Bearish Signals:
Watch for the pink line to cross below the yellow line while the price is below the blue line. This may signal a strong downtrend, indicating a selling opportunity.
Entry Points:
Enter a short position when these conditions align, particularly if the broader market is showing signs of weakness.
Risk Management:
Implement stop-loss orders just above the pink line to limit potential losses.
Conclusion
By understanding the significance of the color codes in Binance charts, traders can gain valuable insights into market trends and make informed decisions for both long and short trading strategies. The yellow, pink, and blue lines not only provide a clear picture of market dynamics but also serve as essential tools for navigating the often volatile cryptocurrency landscape. Whether you're just starting or looking to refine your trading skills, mastering these indicators can enhance your trading effectiveness.
#ColourLinesMeaning
#TradingTips
#CryptoPreUSElection
#USJoblessClaimsDip
#ScrollOnBinance
$SOL $XRP $ETH
Color Code Breakdown
1. Yellow Line (50-Day Moving Average)
The yellow line typically represents the 50-day moving average (MA). This indicator smooths out price fluctuations over the last 50 days, helping traders identify the prevailing trend. A price above the yellow line often indicates bullish sentiment, while a price below it may signal bearish conditions.
2. Pink Line (20-Day Moving Average)
The pink line generally indicates the 20-day moving average. This short-term moving average provides insight into recent price trends and can help traders identify potential reversals. A common strategy is to buy when the price crosses above this line and sell when it crosses below.
3. Blue Line (200-Day Moving Average)
The blue line often represents the 200-day moving average, tracking price movements over a longer timeframe. This line helps traders understand the long-term market direction. Crossovers between the blue line and the yellow or pink lines can signal significant market shifts, aiding traders in their decisions.
Trading Strategies: Long and Short Positions
For Long Positions:
Identify Bullish Signals:
Look for the pink line to cross above the yellow line while the price is above the blue line. This indicates a strong uptrend, suggesting a buying opportunity.
Entry Points:
Consider entering a long position when these conditions are met, especially if the overall market sentiment is positive.
Risk Management:
Use stop-loss orders just below the yellow line to protect against sudden downturns.
For Short Positions:
Identify Bearish Signals:
Watch for the pink line to cross below the yellow line while the price is below the blue line. This may signal a strong downtrend, indicating a selling opportunity.
Entry Points:
Enter a short position when these conditions align, particularly if the broader market is showing signs of weakness.
Risk Management:
Implement stop-loss orders just above the pink line to limit potential losses.
Conclusion
By understanding the significance of the color codes in Binance charts, traders can gain valuable insights into market trends and make informed decisions for both long and short trading strategies. The yellow, pink, and blue lines not only provide a clear picture of market dynamics but also serve as essential tools for navigating the often volatile cryptocurrency landscape. Whether you're just starting or looking to refine your trading skills, mastering these indicators can enhance your trading effectiveness.
#ColourLinesMeaning
#TradingTips
#CryptoPreUSElection
#USJoblessClaimsDip
#ScrollOnBinance
$SOL $XRP $ETH
2
5
6.8k
Войдите, чтобы посмотреть больше материала
Присоединяйтесь к пользователям криптовалют по всему миру на Binance Square
⚡️ Получайте новейшую и полезную информацию о криптоактивах.
💬 Нам доверяет крупнейшая в мире криптобиржа.
👍 Получите достоверные аналитические данные от верифицированных создателей контента.
Эл. почта/номер телефона
Связанные монеты
В тренде
1
#BinancePick
Просмотров: 2.9M
149,233 обсуждают
2
#EarningsSeason
Просмотров: 5.2M
25,482 обсуждают
3
#AnthropicTTMRevenueGrewAbout1200%
Просмотров: 7,725
218 обсуждают
4
#AnthropicS1ExpectedToday
Просмотров: 11,068
209 обсуждают
5
#SouthKoreaReportedlyWeighsFourthCryptoTaxDelay
Просмотров: 19,230
347 обсуждают
6
#FranklinTempletonFilesForTwoDividendToBitcoinETFs
Просмотров: 26,176
454 обсуждают
7
#StrategyMSTRSurpassesNasdaqInMarketCap
Просмотров: 20,051
339 обсуждают
8
#CanadaProposesStablecoinRedemptionWithin3BusinessDays
Просмотров: 920
33 обсуждают
9
#ElectrumWalletBugLetRogueServersStealFunds
Просмотров: 23,465
424 обсуждают
10
#ArgentineCourtDismissesLIBRACaseAgainstMilei
Просмотров: 35,444
521 обсуждают