

#meanreversionplay
meanreversionplay
Просмотров: 459
5 обсуждают
Популярные
Новые

$SQQQB : Up nearly 16% in a few sessions — is a pullback next?
I’m watching a SHORT setup on SQQQB after its sharp upside acceleration.
SQQQB is a tokenized bStock linked to ProShares UltraPro Short QQQ. The underlying ETF targets −3x the Nasdaq-100’s daily performance. That means shorting SQQQB is effectively a bet on a Nasdaq rebound after the recent technology sell-off.
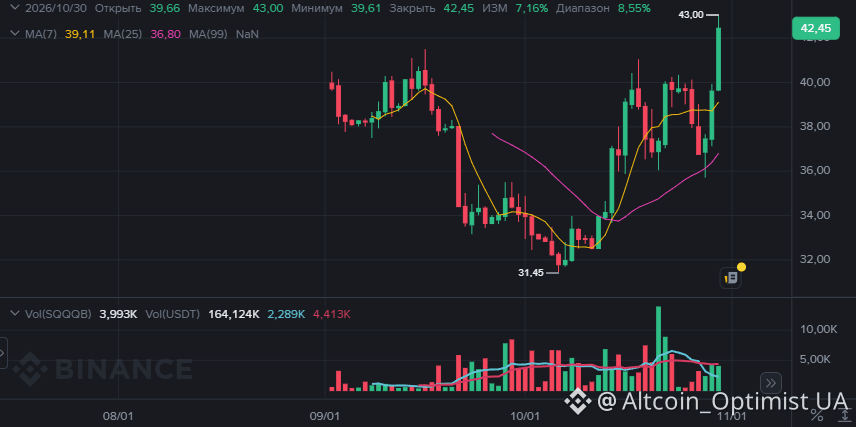
Following the market reaction to major tech earnings, SQQQB moved sharply higher. Based on the daily candles, it gained around 7% on October 30 and reached 43.00. From 36.60 to 42.45, the move has approached 16% in just a few sessions.
I’m not chasing that momentum. I’m looking for a mean-reversion move: price has stretched well above its short-term averages, RSI is approaching 70, and 36.50 sits near a previous support area.
My trade setup:
SHORT entry: 42.00
Take profit: 36.50
Stop loss: 43.375
Reward/Risk: 4:1
The potential gain is approximately 13.1%, against 3.27% risk. With this payoff structure, only about 20% winning TP/SL outcomes are needed to break even before fees: one successful target can offset four stopped trades.
I estimate the probability of hitting TP before SL at around 40% over the next 10 trading sessions.
This is a defined-risk pullback setup, not a prediction that every market move will reverse.
Open $SQQQB and watch the 43.00 level: another breakout, or the start of a cooldown?
#MeanReversionPlay #swingtrading #RiskManagement
65

Trading Strategy - Mean Reversion SetupMean Reversion Strategy - A Proven Trading Method
One of the most reliable trading strategies in crypto is mean reversion. If you can master this approach, you'll catch some of the best trading opportunities with defined risk.
**What is Mean Reversion?**
Mean reversion is based on a simple principle: When an asset moves too far from its average, it tends to revert back toward that average. This happens in crypto constantly.
Example: If Bitcoin's 20-day average is $45,000 and BTC drops to $40,000 (excessive pullback), mean reversion traders expect a bounce back toward $45,000.
**How Mean Reversion Works in 3 Steps:**
**Step 1: Identify Extremes**
Use these indicators to spot extreme moves:
- RSI below 30 = Oversold (potential bounce)
- Bollinger Band lower band touch = Price compression release
- Standard deviation 2.5x from mean = Likely reversal point
- Volume spike on downside = Capitulation/bottom signal
**Step 2: Find Support**
Once you've identified an extreme, find where price might reverse:
- Previous swing lows
- Moving averages (50-day, 100-day)
- Fibonacci support levels
- Volume profile support
**Step 3: Enter & Exit**
Entry: When RSI bounces off 30, or price touches support on high volume
Target: Previous 20-day average (mean)
Stop-Loss: 5-10% below entry (if support breaks decisively)
**Real Bitcoin Example:**
Let's say BTC is averaging $45,000. It crashes to $40,500 (extreme oversold, RSI 22).
- Entry: $40,800 on the bounce
- Target: $45,000 (the mean)
- Stop: $39,000
- Risk/Reward: Risk $1,800, make $4,200 = 2.3:1
That's a HIGH probability trade because you're betting on the market REVERTING to normal, not predicting new highs.
**When Mean Reversion Works Best:**
✅ In sideways/consolidation markets (like Bitcoin $42k-$48k)
✅ After extreme news sell-offs (panic selling creates oversold conditions)
✅ During range-bound trading (when there's a clear upper/lower band)
✅ On daily timeframes (more reliable than intraday noise)
**When Mean Reversion FAILS:**
❌ In strong trending markets (trend is your friend, don't fight it)
❌ During breakouts (that's trend trading, not reversion)
❌ On coins with weak fundamentals (bad news can keep driving lower)
❌ Without proper stops (one bad trade can kill your account)
**3 Mean Reversion Setups to Use:**
**Setup #1: RSI + Bollinger Bands**
When RSI < 30 AND price touches lower Bollinger Band:
- This is an extreme oversold condition
- High probability mean reversion bounce
- Use the middle Bollinger Band as initial target
**Setup #2: MACD Divergence**
When price makes a lower low but MACD doesn't:
- This shows weakening sell pressure
- Setup for reversal is ready
- Target: Previous support level + 50% extension
**Setup #3: Volume Exhaust**
When volume spikes on down move then contracts:
- Selling pressure is exhausted
- Price reverting to mean next
- Most reliable setup of the three
**Common Mistakes to Avoid:**
1. **Catching Falling Knives** - Don't buy a downtrend in the middle. Wait for a bounce signal.
2. **Ignoring the Trend** - If it's a strong downtrend, the "mean" keeps moving lower. Don't force it.
3. **Overleveraging** - Reversion trades work but need proper position sizing for the risk.
4. **No Stop Losses** - If your bounce signal fails, you need an exit. Period.
**Your Action Plan:**
1. Look at $BTC daily chart right now
2. Find where it's trading relative to the 20-day moving average
3. If it's 5%+ below, you have a reversion setup
4. Wait for RSI bounce or volume to dry up on downside
5. Enter with defined stop-loss
**The Bottom Line:**
Mean reversion isn't flashy, but it's consistent. You won't 10x your account, but you'll win trades with high probability and good risk/reward. That's how real traders make consistent money.
Which would you rather have: 1 lucky 10x, or 10 consistent 2:1 winners? 🎯
$BTC $ETH #tradingStrategy #MeanReversionPlay #cryptotrading
Trading Strategy - Mean Reversion Setup
Mean Reversion Strategy - A Proven Trading Method
One of the most reliable trading strategies in crypto is mean reversion. If you can master this approach, you'll catch some of the best trading opportunities with defined risk.
**What is Mean Reversion?**
Mean reversion is based on a simple principle: When an asset moves too far from its average, it tends to revert back toward that average. This happens in crypto constantly.
Example: If Bitcoin's 20-day average is $45,000 and BTC drops to $40,000 (excessive pullback), mean reversion traders expect a bounce back toward $45,000.
**How Mean Reversion Works in 3 Steps:**
**Step 1: Identify Extremes**
Use these indicators to spot extreme moves:
- RSI below 30 = Oversold (potential bounce)
- Bollinger Band lower band touch = Price compression release
- Standard deviation 2.5x from mean = Likely reversal point
- Volume spike on downside = Capitulation/bottom signal
**Step 2: Find Support**
Once you've identified an extreme, find where price might reverse:
- Previous swing lows
- Moving averages (50-day, 100-day)
- Fibonacci support levels
- Volume profile support
**Step 3: Enter & Exit**
Entry: When RSI bounces off 30, or price touches support on high volume
Target: Previous 20-day average (mean)
Stop-Loss: 5-10% below entry (if support breaks decisively)
**Real Bitcoin Example:**
Let's say BTC is averaging $45,000. It crashes to $40,500 (extreme oversold, RSI 22).
- Entry: $40,800 on the bounce
- Target: $45,000 (the mean)
- Stop: $39,000
- Risk/Reward: Risk $1,800, make $4,200 = 2.3:1
That's a HIGH probability trade because you're betting on the market REVERTING to normal, not predicting new highs.
**When Mean Reversion Works Best:**
✅ In sideways/consolidation markets (like Bitcoin $42k-$48k)
✅ After extreme news sell-offs (panic selling creates oversold conditions)
✅ During range-bound trading (when there's a clear upper/lower band)
✅ On daily timeframes (more reliable than intraday noise)
**When Mean Reversion FAILS:**
❌ In strong trending markets (trend is your friend, don't fight it)
❌ During breakouts (that's trend trading, not reversion)
❌ On coins with weak fundamentals (bad news can keep driving lower)
❌ Without proper stops (one bad trade can kill your account)
**3 Mean Reversion Setups to Use:**
**Setup #1: RSI + Bollinger Bands**
When RSI < 30 AND price touches lower Bollinger Band:
- This is an extreme oversold condition
- High probability mean reversion bounce
- Use the middle Bollinger Band as initial target
**Setup #2: MACD Divergence**
When price makes a lower low but MACD doesn't:
- This shows weakening sell pressure
- Setup for reversal is ready
- Target: Previous support level + 50% extension
**Setup #3: Volume Exhaust**
When volume spikes on down move then contracts:
- Selling pressure is exhausted
- Price reverting to mean next
- Most reliable setup of the three
**Common Mistakes to Avoid:**
1. **Catching Falling Knives** - Don't buy a downtrend in the middle. Wait for a bounce signal.
2. **Ignoring the Trend** - If it's a strong downtrend, the "mean" keeps moving lower. Don't force it.
3. **Overleveraging** - Reversion trades work but need proper position sizing for the risk.
4. **No Stop Losses** - If your bounce signal fails, you need an exit. Period.
**Your Action Plan:**
1. Look at $BTC daily chart right now
2. Find where it's trading relative to the 20-day moving average
3. If it's 5%+ below, you have a reversion setup
4. Wait for RSI bounce or volume to dry up on downside
5. Enter with defined stop-loss
**The Bottom Line:**
Mean reversion isn't flashy, but it's consistent. You won't 10x your account, but you'll win trades with high probability and good risk/reward. That's how real traders make consistent money.
Which would you rather have: 1 lucky 10x, or 10 consistent 2:1 winners? 🎯
$BTC $ETH #tradingStrategy #MeanReversionPlay #cryptotrading
1
91
Войдите, чтобы посмотреть больше материала
Присоединяйтесь к пользователям криптовалют по всему миру на Binance Square
⚡️ Получайте новейшую и полезную информацию о криптоактивах.
💬 Нам доверяет крупнейшая в мире криптобиржа.
👍 Получите достоверные аналитические данные от верифицированных создателей контента.
Эл. почта/номер телефона
В тренде
1
#BinanceRecovery90% of stolen assets
Просмотров: 19,277
77 обсуждают
2
#YiHe:ProofOfReserves:10TokensAt100%Backing
Просмотров: 49,687
213 обсуждают
3
#BackedNotBroken:RichardTengSaysUsersBearNoLoss
Просмотров: 2,448
116 обсуждают
4
#CZSaysCompensationIsinPlaceUsersAreProtected
Просмотров: 66,188
924 обсуждают
5
#IntelHasItsWorstDaySince1974
Просмотров: 15,756
403 обсуждают
6
#TRMCambodianCasinosReceived$1.07BInCrypto
Просмотров: 3,905
56 обсуждают
7
#USDCCirculationFallsAbout800MInSevenDays
Просмотров: 36,716
563 обсуждают
8
#SuspectedNorthKoreaAttacksAccountForNearly89%OfCryptoHackLosses
Просмотров: 10,012
79 обсуждают
9
#OpenAICutsFundraisingTargetBy$10B
Просмотров: 2,408
65 обсуждают
10
#ASICHasReceivedNoPredictionMarketApplications
Просмотров: 47,331
946 обсуждают