
#etherreum
etherreum
Просмотров: 5.8M
5,590 обсуждают
Популярные
Новые

·
--
$ETH fell from $2,449 to $1,892 — red after red. 📉
Most people panic here. Smart traders watch.
Fear is high. And that’s where opportunity is born.
Are you buying, waiting, or staying out?
Comment: BUY / WAIT / SHORT 👇
#ETH #etherreum #crypto
{spot}(ETHUSDT)
$ETH fell from $2,449 to $1,892 — red after red. 📉
Most people panic here. Smart traders watch.
Fear is high. And that’s where opportunity is born.
Are you buying, waiting, or staying out?
Comment: BUY / WAIT / SHORT 👇
#ETH #etherreum #crypto
Most people panic here. Smart traders watch.
Fear is high. And that’s where opportunity is born.
Are you buying, waiting, or staying out?
Comment: BUY / WAIT / SHORT 👇
#ETH #etherreum #crypto
24

A sophisticated, multi-layered 3D infographic and data visualization set within a futuristic digital financial nexus, presented as an analysis of the historic six-week outflow streak for U.S. spot Ethereum ETFs (November 2026). The central element is a large, flowing, recursive structure made of polished obsidian, crystal, and glowing energy, labeled 'USDT SPOT ETHEREUM ETFs' and '6-WEEK NET OUTFLOW STREAK'. It shows a segmented timeline of six weeks (labeled W1 to W6, 'NOV 2-6' as W6), each with a downward-pointing crimson data stream. Integrated holographic panels detail the information: 'W6 (NOV 2-6) NET FLOWS' with a large, central, glowing value: '-$365M' (Crimson, 'Confirmed'). Below it, 'DAILY BREAKDOWN' with small, interacting bar charts: 'MON: -$139.7M', 'TUE: -$85.3M', 'WED: +$53.0M', 'THU: -$99.9M', 'FRI: -$93.3M'. To the right, 'FUND PERFORMANCE (W6)' with key fund details: 'BLACKROCK ETHA' (-$90.8M on Fri), 'GRAYSCALE ETHE' (Significant Outflows), 'FIDELITY FETH' (Moderate Inflows). An intersecting analysis, 'MARKET IMPACT & SENTIMENT', with smaller panels: 'ETH PRICE PRESSURE' (Line graph showing a drop near $2,245), 'INSTITUTIONAL CAUTION' (Sentiment dial pointing to 'Fear'), 'BROADER MARKET CON consolidation' (Interacting data from other chains). The entire environment is filled with flowing data streams, geometric grids, binary code (0s, 1s), and complex network pipelines in a palette of cyan, blue, amber, and deep red. Receding server racks and data visualizations create infinite depth. Floating icons of Ethereum and different financial symbols interact with the data. The composition is dynamic, pulling the eye in. The image has a textured, polished feel, combining physical-looking 3D forms with ethereal data. All text is sharp, clear, and in English. Shot from a medium distance, capturing the full scope.}
#etherreum #BinanceSquareFamily #BinanceSquareTalks
A sophisticated, multi-layered 3D infographic and data visualization set within a futuristic digital financial nexus, presented as an analysis of the historic six-week outflow streak for U.S. spot Ethereum ETFs (November 2026). The central element is a large, flowing, recursive structure made of polished obsidian, crystal, and glowing energy, labeled 'USDT SPOT ETHEREUM ETFs' and '6-WEEK NET OUTFLOW STREAK'. It shows a segmented timeline of six weeks (labeled W1 to W6, 'NOV 2-6' as W6), each with a downward-pointing crimson data stream. Integrated holographic panels detail the information: 'W6 (NOV 2-6) NET FLOWS' with a large, central, glowing value: '-$365M' (Crimson, 'Confirmed'). Below it, 'DAILY BREAKDOWN' with small, interacting bar charts: 'MON: -$139.7M', 'TUE: -$85.3M', 'WED: +$53.0M', 'THU: -$99.9M', 'FRI: -$93.3M'. To the right, 'FUND PERFORMANCE (W6)' with key fund details: 'BLACKROCK ETHA' (-$90.8M on Fri), 'GRAYSCALE ETHE' (Significant Outflows), 'FIDELITY FETH' (Moderate Inflows). An intersecting analysis, 'MARKET IMPACT & SENTIMENT', with smaller panels: 'ETH PRICE PRESSURE' (Line graph showing a drop near $2,245), 'INSTITUTIONAL CAUTION' (Sentiment dial pointing to 'Fear'), 'BROADER MARKET CON consolidation' (Interacting data from other chains). The entire environment is filled with flowing data streams, geometric grids, binary code (0s, 1s), and complex network pipelines in a palette of cyan, blue, amber, and deep red. Receding server racks and data visualizations create infinite depth. Floating icons of Ethereum and different financial symbols interact with the data. The composition is dynamic, pulling the eye in. The image has a textured, polished feel, combining physical-looking 3D forms with ethereal data. All text is sharp, clear, and in English. Shot from a medium distance, capturing the full scope.}
#etherreum #BinanceSquareFamily #BinanceSquareTalks
#etherreum #BinanceSquareFamily #BinanceSquareTalks
16

·
--
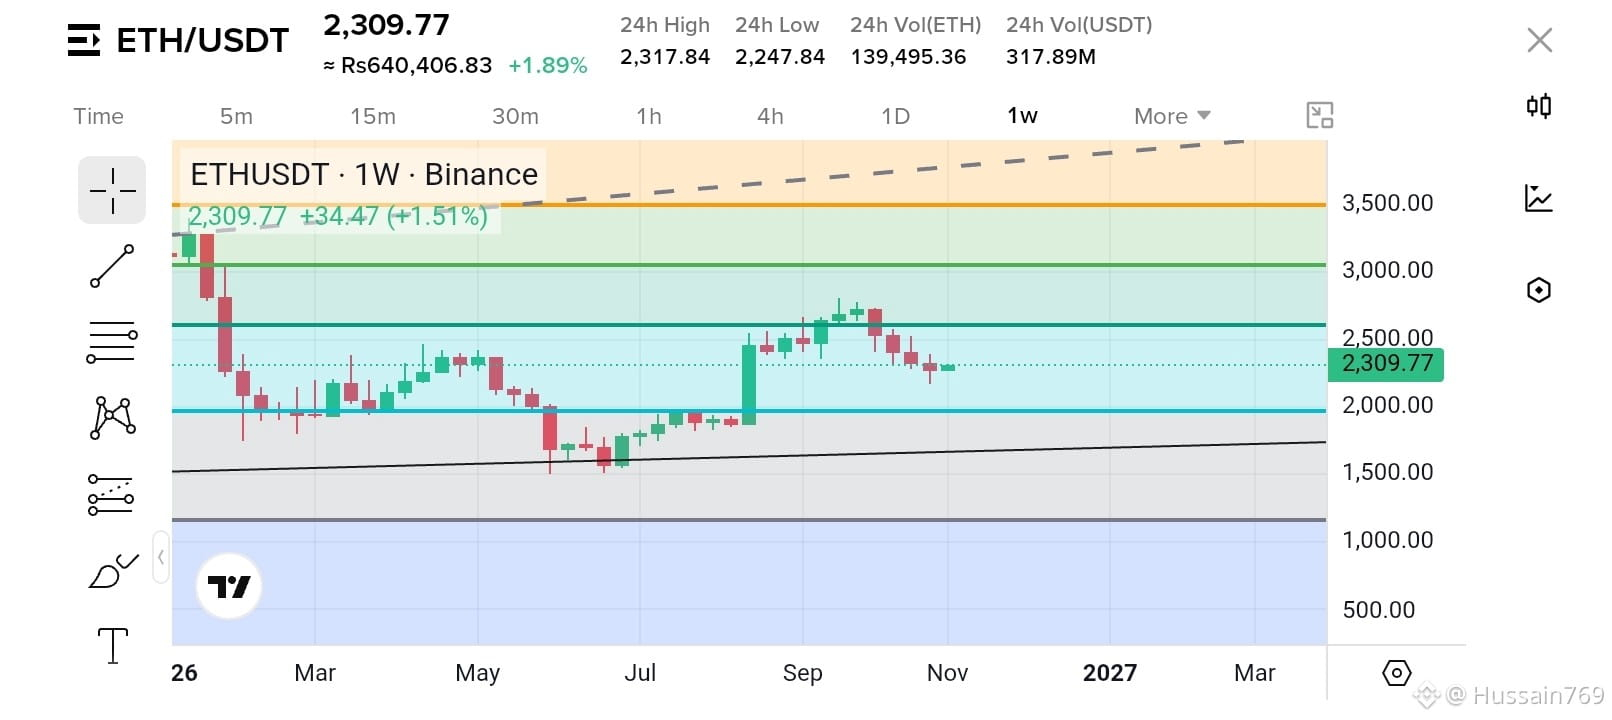
#etherreum Ethereum has support at 2k.And based on my analysis, it is expected to turn back from there.#Eth #Write2Earn! #Ethereum
#etherreum Ethereum has support at 2k.And based on my analysis, it is expected to turn back from there.#Eth #Write2Earn! #Ethereum
1
125

·
--
$ETH
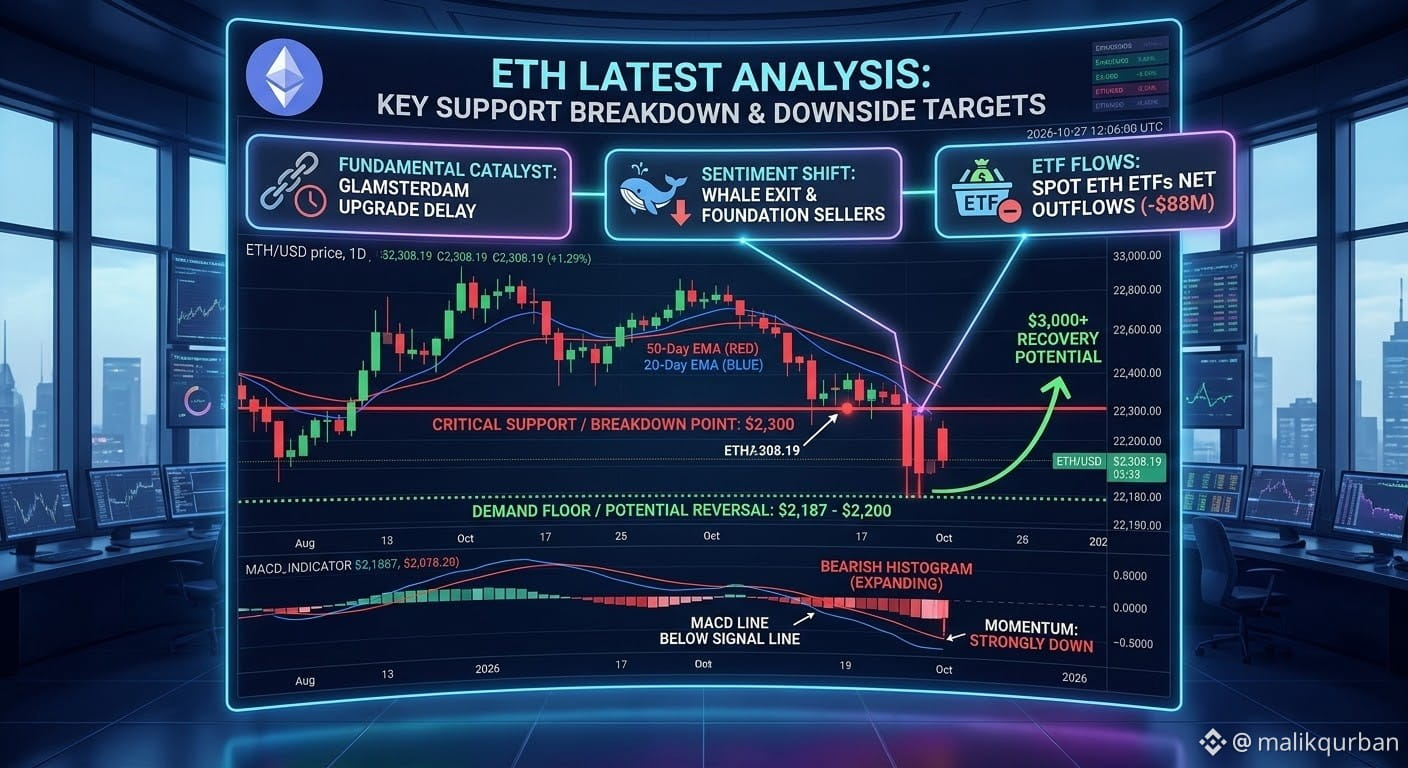
KEY SUPPORT BREAKDOWN & DOWNSIDE TARGETS
Following a period of consolidation, Ethereum (ETH) has experienced a significant technical breakdown, dropping below the psychological and historical support level of $2,300. This move confirms the bearish momentum visualised in our chart.
The included visualization, 'ETH/USD Latest Analysis,' highlights the breakdown at $2,300 with several large red candles, leading to the current price near $2,308. This is a strong sell signal and suggests further potential for a retest of lower levels before any substantial recovery can occur.
Key technical and fundamental factors driving this current weakness include:
Technical Indicators: The 20-Day EMA has crossed below the 50-Day EMA, and the MACD histogram is expanding to the downside, illustrating a clear increase in bearish momentum.
Fundamental Headwinds:
Glamsterdam Delay: The postponement of a crucial testnet for the upcoming 'Glamsterdam' network upgrade has injected uncertainty into the market.
Whale Exit: Noted sales by prominent market figures, including a high-profile 6,400 ETH divestment, have dampened sentiment.
ETF Outflows: The U.S. spot Ethereum ETFs are experiencing persistent net outflows, with a recent session seeing a withdrawal of approximately $88M, led by major funds.
ds.
Outlook and Key Levels to Watch
While a definitive bottom has not been confirmed, a strong 'Demand Floor' is anticipated between $2,187 and $2,200, where significant buying interest could emerge. If this zone holds, it may set the stage for a reversal, with a long-term potential for a recovery to $3,000+. Investors should closely monitor price action around this potential reversal zone.
{spot}(ETHUSDT)
#etherreum #Crypto_Jobs🎯
$ETH
KEY SUPPORT BREAKDOWN & DOWNSIDE TARGETS
Following a period of consolidation, Ethereum (ETH) has experienced a significant technical breakdown, dropping below the psychological and historical support level of $2,300. This move confirms the bearish momentum visualised in our chart.
The included visualization, 'ETH/USD Latest Analysis,' highlights the breakdown at $2,300 with several large red candles, leading to the current price near $2,308. This is a strong sell signal and suggests further potential for a retest of lower levels before any substantial recovery can occur.
Key technical and fundamental factors driving this current weakness include:
Technical Indicators: The 20-Day EMA has crossed below the 50-Day EMA, and the MACD histogram is expanding to the downside, illustrating a clear increase in bearish momentum.
Fundamental Headwinds:
Glamsterdam Delay: The postponement of a crucial testnet for the upcoming 'Glamsterdam' network upgrade has injected uncertainty into the market.
Whale Exit: Noted sales by prominent market figures, including a high-profile 6,400 ETH divestment, have dampened sentiment.
ETF Outflows: The U.S. spot Ethereum ETFs are experiencing persistent net outflows, with a recent session seeing a withdrawal of approximately $88M, led by major funds.
ds.
Outlook and Key Levels to Watch
While a definitive bottom has not been confirmed, a strong 'Demand Floor' is anticipated between $2,187 and $2,200, where significant buying interest could emerge. If this zone holds, it may set the stage for a reversal, with a long-term potential for a recovery to $3,000+. Investors should closely monitor price action around this potential reversal zone.
#etherreum #Crypto_Jobs🎯
KEY SUPPORT BREAKDOWN & DOWNSIDE TARGETS
Following a period of consolidation, Ethereum (ETH) has experienced a significant technical breakdown, dropping below the psychological and historical support level of $2,300. This move confirms the bearish momentum visualised in our chart.
The included visualization, 'ETH/USD Latest Analysis,' highlights the breakdown at $2,300 with several large red candles, leading to the current price near $2,308. This is a strong sell signal and suggests further potential for a retest of lower levels before any substantial recovery can occur.
Key technical and fundamental factors driving this current weakness include:
Technical Indicators: The 20-Day EMA has crossed below the 50-Day EMA, and the MACD histogram is expanding to the downside, illustrating a clear increase in bearish momentum.
Fundamental Headwinds:
Glamsterdam Delay: The postponement of a crucial testnet for the upcoming 'Glamsterdam' network upgrade has injected uncertainty into the market.
Whale Exit: Noted sales by prominent market figures, including a high-profile 6,400 ETH divestment, have dampened sentiment.
ETF Outflows: The U.S. spot Ethereum ETFs are experiencing persistent net outflows, with a recent session seeing a withdrawal of approximately $88M, led by major funds.
ds.
Outlook and Key Levels to Watch
While a definitive bottom has not been confirmed, a strong 'Demand Floor' is anticipated between $2,187 and $2,200, where significant buying interest could emerge. If this zone holds, it may set the stage for a reversal, with a long-term potential for a recovery to $3,000+. Investors should closely monitor price action around this potential reversal zone.
#etherreum #Crypto_Jobs🎯
88

Por qué estoy buscando una posición en LARGO en $ETH 👇
Lo que me gusta aquí no es solo el soporte, sino cómo reacciona el precio después de cada caída.
Los vendedores siguen empujando $ETH más abajo, pero cada vez que el precio se acerca a la zona de soporte de $2,308–$2,310, los compradores vuelven a entrar y absorben la presión vendedora.
Eso me indica que los bajistas no están logrando la continuación bajista clara que buscan. 👀
Mientras tanto, hay una zona de liquidez por encima, alrededor de $2,330–$2,335, que podría ser el próximo objetivo si los compradores mantienen el control.
📊 Mi plan de trading:
- 🟢 Soporte: $2,308–$2,310
- 🎯 Objetivo: $2,335
- 🛑 Stop loss: $2,302📈 Busca una confirmación alcista y volumen comprador.
Si los vendedores realmente tuvieran el control, este soporte quizá ya se habría roto. Hasta ahora, la reacción mantiene vigente el escenario alcista.
Estoy atento a un nuevo impulso al alza, pero si se rompe el soporte, la configuración queda invalidada.
⚠️ No persigas las velas verdes. Gestiona el riesgo.
$ETH operar desde aqui y me ayuda ⛑️
{future}(ETHUSDT)
#ETH🔥🔥🔥🔥🔥🔥 #etherreum #AkashSelectsSolanaAsMigrationTarget
Por qué estoy buscando una posición en LARGO en $ETH 👇
Lo que me gusta aquí no es solo el soporte, sino cómo reacciona el precio después de cada caída.
Los vendedores siguen empujando $ETH más abajo, pero cada vez que el precio se acerca a la zona de soporte de $2,308–$2,310, los compradores vuelven a entrar y absorben la presión vendedora.
Eso me indica que los bajistas no están logrando la continuación bajista clara que buscan. 👀
Mientras tanto, hay una zona de liquidez por encima, alrededor de $2,330–$2,335, que podría ser el próximo objetivo si los compradores mantienen el control.
📊 Mi plan de trading:
- 🟢 Soporte: $2,308–$2,310
- 🎯 Objetivo: $2,335
- 🛑 Stop loss: $2,302📈 Busca una confirmación alcista y volumen comprador.
Si los vendedores realmente tuvieran el control, este soporte quizá ya se habría roto. Hasta ahora, la reacción mantiene vigente el escenario alcista.
Estoy atento a un nuevo impulso al alza, pero si se rompe el soporte, la configuración queda invalidada.
⚠️ No persigas las velas verdes. Gestiona el riesgo.
$ETH operar desde aqui y me ayuda ⛑️
#ETH🔥🔥🔥🔥🔥🔥 #etherreum #AkashSelectsSolanaAsMigrationTarget
Lo que me gusta aquí no es solo el soporte, sino cómo reacciona el precio después de cada caída.
Los vendedores siguen empujando $ETH más abajo, pero cada vez que el precio se acerca a la zona de soporte de $2,308–$2,310, los compradores vuelven a entrar y absorben la presión vendedora.
Eso me indica que los bajistas no están logrando la continuación bajista clara que buscan. 👀
Mientras tanto, hay una zona de liquidez por encima, alrededor de $2,330–$2,335, que podría ser el próximo objetivo si los compradores mantienen el control.
📊 Mi plan de trading:
- 🟢 Soporte: $2,308–$2,310
- 🎯 Objetivo: $2,335
- 🛑 Stop loss: $2,302📈 Busca una confirmación alcista y volumen comprador.
Si los vendedores realmente tuvieran el control, este soporte quizá ya se habría roto. Hasta ahora, la reacción mantiene vigente el escenario alcista.
Estoy atento a un nuevo impulso al alza, pero si se rompe el soporte, la configuración queda invalidada.
⚠️ No persigas las velas verdes. Gestiona el riesgo.
$ETH operar desde aqui y me ayuda ⛑️
#ETH🔥🔥🔥🔥🔥🔥 #etherreum #AkashSelectsSolanaAsMigrationTarget
1
369

·
--
$ETH ⚡ Ethereum (ETH): The Engine of Web3 Under Pressure
As the backbone of decentralized finance (DeFi), smart contracts, and Web3 infrastructure, Ethereum (ETH) continues to sit at the center of the cryptocurrency universe. However, recent market dynamics present a classic tug-of-war between technical innovation and short-term headwinds.
📉 The Short-Term Picture: Consolidation & Headwinds
Price Dynamics: Trading around $2,300 – $2,400 (approx. €2,080), ETH has experienced short-term downward pressure, dropping around 12–15% over the past few weeks along with broader altcoin market weakness.
ETF Outflows: Institutional sentiment through spot ETFs has seen cooling periods with temporary net outflows, dragging key technical indicators below the 20-day moving average (~$2,490).
Upgrade Timeline: Anticipation around upcoming network scaling upgrades (such as Glamsterdam) remains high, though minor schedule adjustments have shifted short-term speculative timelines.
🚀 The Long-Term Bullish Catalysts
The AI & Agent Economy: With new standards emerging like ERC-8004 for tracking AI agent identity and reputation, tens of thousands of autonomous AI agents are anchoring their economic activity directly onto Ethereum.
Layer-2 Expansion: Layer-2 networks (Arbitrum, Optimism, Base, etc.) continue to scale transaction capacity while burning ETH base fees, reinforcing Ethereum's moat as the settlement layer of Web3.
Institutional Liquidity & Staking Yields: Despite short-term ETF flow fluctuations, Ethereum remains the premier yield-bearing digital asset, appealing strongly to institutional treasuries seeking native staking rewards.
📊 Key Technical Levels to Watch
Support: Strong buyer defense sits around $2,300 - $2,313. A breakdown below could retest lower liquidity zones, while a firm hold acts as a launchpad for recovery.
Resistance: The primary short-term ceiling is at $2,490 – $2,550 (50-day EMA). Breaking above this level reopens pathing toward the $2,800 - $3,000 psychological targets.
#ETH🔥🔥🔥🔥🔥🔥 #etherreum #EarningsSeason
$ETH ⚡ Ethereum (ETH): The Engine of Web3 Under Pressure
As the backbone of decentralized finance (DeFi), smart contracts, and Web3 infrastructure, Ethereum (ETH) continues to sit at the center of the cryptocurrency universe. However, recent market dynamics present a classic tug-of-war between technical innovation and short-term headwinds.
📉 The Short-Term Picture: Consolidation & Headwinds
Price Dynamics: Trading around $2,300 – $2,400 (approx. €2,080), ETH has experienced short-term downward pressure, dropping around 12–15% over the past few weeks along with broader altcoin market weakness.
ETF Outflows: Institutional sentiment through spot ETFs has seen cooling periods with temporary net outflows, dragging key technical indicators below the 20-day moving average (~$2,490).
Upgrade Timeline: Anticipation around upcoming network scaling upgrades (such as Glamsterdam) remains high, though minor schedule adjustments have shifted short-term speculative timelines.
🚀 The Long-Term Bullish Catalysts
The AI & Agent Economy: With new standards emerging like ERC-8004 for tracking AI agent identity and reputation, tens of thousands of autonomous AI agents are anchoring their economic activity directly onto Ethereum.
Layer-2 Expansion: Layer-2 networks (Arbitrum, Optimism, Base, etc.) continue to scale transaction capacity while burning ETH base fees, reinforcing Ethereum's moat as the settlement layer of Web3.
Institutional Liquidity & Staking Yields: Despite short-term ETF flow fluctuations, Ethereum remains the premier yield-bearing digital asset, appealing strongly to institutional treasuries seeking native staking rewards.
📊 Key Technical Levels to Watch
Support: Strong buyer defense sits around $2,300 - $2,313. A breakdown below could retest lower liquidity zones, while a firm hold acts as a launchpad for recovery.
Resistance: The primary short-term ceiling is at $2,490 – $2,550 (50-day EMA). Breaking above this level reopens pathing toward the $2,800 - $3,000 psychological targets.
#ETH🔥🔥🔥🔥🔥🔥 #etherreum #EarningsSeason
As the backbone of decentralized finance (DeFi), smart contracts, and Web3 infrastructure, Ethereum (ETH) continues to sit at the center of the cryptocurrency universe. However, recent market dynamics present a classic tug-of-war between technical innovation and short-term headwinds.
📉 The Short-Term Picture: Consolidation & Headwinds
Price Dynamics: Trading around $2,300 – $2,400 (approx. €2,080), ETH has experienced short-term downward pressure, dropping around 12–15% over the past few weeks along with broader altcoin market weakness.
ETF Outflows: Institutional sentiment through spot ETFs has seen cooling periods with temporary net outflows, dragging key technical indicators below the 20-day moving average (~$2,490).
Upgrade Timeline: Anticipation around upcoming network scaling upgrades (such as Glamsterdam) remains high, though minor schedule adjustments have shifted short-term speculative timelines.
🚀 The Long-Term Bullish Catalysts
The AI & Agent Economy: With new standards emerging like ERC-8004 for tracking AI agent identity and reputation, tens of thousands of autonomous AI agents are anchoring their economic activity directly onto Ethereum.
Layer-2 Expansion: Layer-2 networks (Arbitrum, Optimism, Base, etc.) continue to scale transaction capacity while burning ETH base fees, reinforcing Ethereum's moat as the settlement layer of Web3.
Institutional Liquidity & Staking Yields: Despite short-term ETF flow fluctuations, Ethereum remains the premier yield-bearing digital asset, appealing strongly to institutional treasuries seeking native staking rewards.
📊 Key Technical Levels to Watch
Support: Strong buyer defense sits around $2,300 - $2,313. A breakdown below could retest lower liquidity zones, while a firm hold acts as a launchpad for recovery.
Resistance: The primary short-term ceiling is at $2,490 – $2,550 (50-day EMA). Breaking above this level reopens pathing toward the $2,800 - $3,000 psychological targets.
#ETH🔥🔥🔥🔥🔥🔥 #etherreum #EarningsSeason

105

·
--
Падение
Торговля за 30 дней $ETH 27.2 USDT
$ETH
{future}(ETHUSDT)
ETHUSDT — Short Watch
• Live Price: 2,365.08
• Margin: Cross
• Setup: Liquidity Sweep & Breakdown
• Entry Zone: 2,385 – 2,410
• Invalidation: 2,450
• Targets: 2,310 / 2,260 / 2,200
#ETH🔥🔥🔥🔥🔥🔥 #Ethereum #ETHFI #ETHFI #etherreum
$ETH
ETHUSDT — Short Watch
• Live Price: 2,365.08
• Margin: Cross
• Setup: Liquidity Sweep & Breakdown
• Entry Zone: 2,385 – 2,410
• Invalidation: 2,450
• Targets: 2,310 / 2,260 / 2,200
#ETH🔥🔥🔥🔥🔥🔥 #Ethereum #ETHFI #ETHFI #etherreum
ETHUSDT — Short Watch
• Live Price: 2,365.08
• Margin: Cross
• Setup: Liquidity Sweep & Breakdown
• Entry Zone: 2,385 – 2,410
• Invalidation: 2,450
• Targets: 2,310 / 2,260 / 2,200
#ETH🔥🔥🔥🔥🔥🔥 #Ethereum #ETHFI #ETHFI #etherreum
42

🚨 ¿ETHEREUM AGUANTA LOS $2.350 O SE VA MÁS ABAJO?
Ethereum cayó a $2.350 y ahora ronda los $2.376, con una caída de alrededor de 1,1% en el día, en la misma sesión en que Bitcoin perdió su media de 50 días y los ETF spot volvieron a sangrar.
Implicación directa para cripto: si ETH pierde la zona de $2.350 que defendió hoy, el mercado entero siente el golpe, porque ETH marca el ritmo de las altcoins. Si la aguanta, es la primera señal de que la venta se está agotando.
Mi lectura: la zona de hoy es la línea en la arena antes de la Fed del 28 de octubre. ¿Tú qué ves: rebote desde $2.350 o caída a buscar soporte más abajo? Vota 1 para rebote, 2 para más caída, y argumenta abajo.
#etherreum
$ETH
{future}(ETHUSDT)
$BTC
{future}(BTCUSDT)
$USDC
{future}(USDCUSDT)
🚨 ¿ETHEREUM AGUANTA LOS $2.350 O SE VA MÁS ABAJO?
Ethereum cayó a $2.350 y ahora ronda los $2.376, con una caída de alrededor de 1,1% en el día, en la misma sesión en que Bitcoin perdió su media de 50 días y los ETF spot volvieron a sangrar.
Implicación directa para cripto: si ETH pierde la zona de $2.350 que defendió hoy, el mercado entero siente el golpe, porque ETH marca el ritmo de las altcoins. Si la aguanta, es la primera señal de que la venta se está agotando.
Mi lectura: la zona de hoy es la línea en la arena antes de la Fed del 28 de octubre. ¿Tú qué ves: rebote desde $2.350 o caída a buscar soporte más abajo? Vota 1 para rebote, 2 para más caída, y argumenta abajo.
#etherreum
$ETH
$BTC
$USDC
Ethereum cayó a $2.350 y ahora ronda los $2.376, con una caída de alrededor de 1,1% en el día, en la misma sesión en que Bitcoin perdió su media de 50 días y los ETF spot volvieron a sangrar.
Implicación directa para cripto: si ETH pierde la zona de $2.350 que defendió hoy, el mercado entero siente el golpe, porque ETH marca el ritmo de las altcoins. Si la aguanta, es la primera señal de que la venta se está agotando.
Mi lectura: la zona de hoy es la línea en la arena antes de la Fed del 28 de octubre. ¿Tú qué ves: rebote desde $2.350 o caída a buscar soporte más abajo? Vota 1 para rebote, 2 para más caída, y argumenta abajo.
#etherreum
$ETH
$BTC
$USDC


1
111

Ethereum Staking Reaches Record 44M ETH
Total staked Ethereum has hit a new all-time high of 43.8 million ETH, reflecting sustained and growing demand for network participation.
BitMine contributed to the milestone by staking an additional $ETH 390 million in ETH, bringing its total staked holdings to $ETH 12.78 billion.
The record staking level signals deepening commitment from institutional players and reinforces Ethereum's proof-of-stake network as a major destination for large-scale capital deployment.
Source
Trade on #Binance #etherreum #hold
Ethereum Staking Reaches Record 44M ETH
Total staked Ethereum has hit a new all-time high of 43.8 million ETH, reflecting sustained and growing demand for network participation.
BitMine contributed to the milestone by staking an additional $ETH 390 million in ETH, bringing its total staked holdings to $ETH 12.78 billion.
The record staking level signals deepening commitment from institutional players and reinforces Ethereum's proof-of-stake network as a major destination for large-scale capital deployment.
Source
Trade on #Binance #etherreum #hold
Total staked Ethereum has hit a new all-time high of 43.8 million ETH, reflecting sustained and growing demand for network participation.
BitMine contributed to the milestone by staking an additional $ETH 390 million in ETH, bringing its total staked holdings to $ETH 12.78 billion.
The record staking level signals deepening commitment from institutional players and reinforces Ethereum's proof-of-stake network as a major destination for large-scale capital deployment.
Source
Trade on #Binance #etherreum #hold

81

·
--
Рост
Ethereum Price Analysis!!
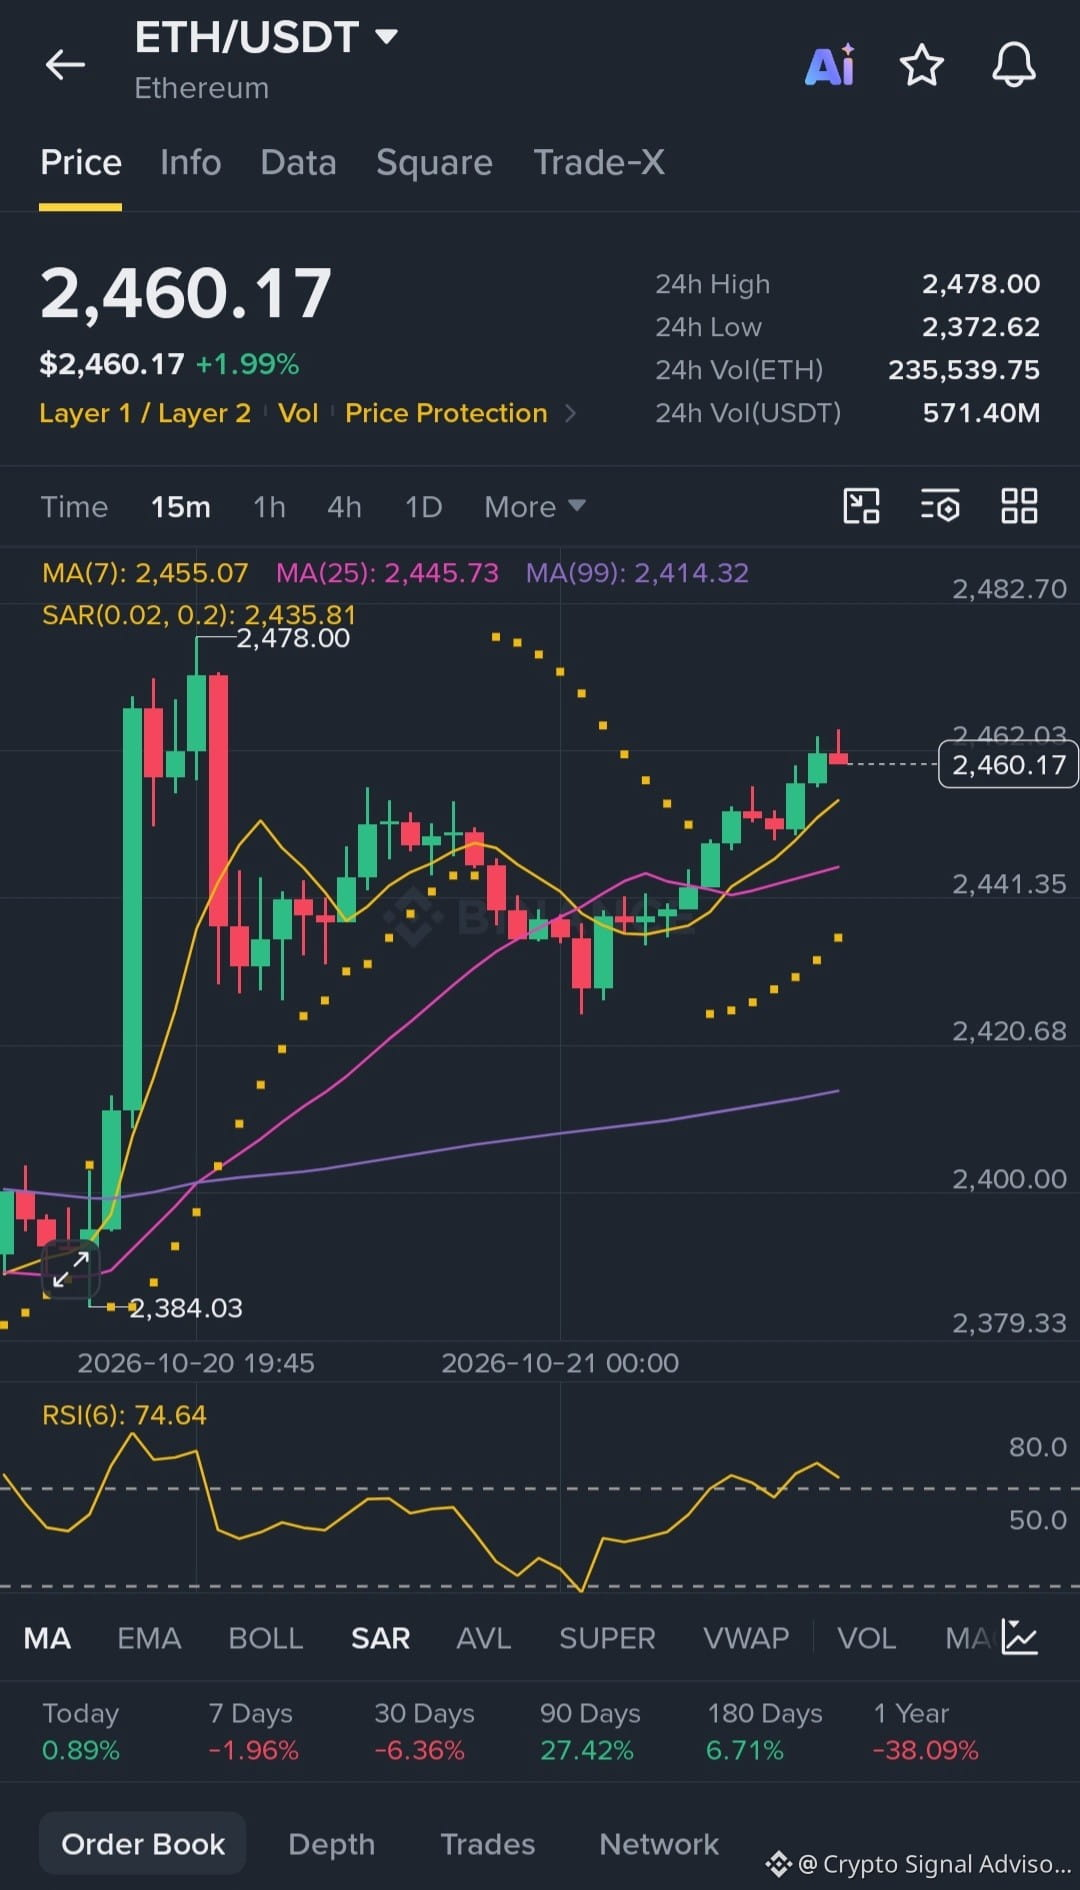
Ethereum looking strong right now on the 15-minute chart. The price is at 2460.17, which is up almost 2% today. After falling to a low of 2384, the price has bounced back up above its moving averages. The 7-day moving average at 2455 and the 25-day moving average at 2445 are now helping the price stay high. Also, the Parabolic SAR dots are now below the candles, which means buyers are in control right now.
But be careful if you are doing short-term trading. The RSI is very high at 74.64. This means the price is overbought and moved up too fast. So, a small price drop or moving sideways is very possible right now. The first big resistance is at the 24-hour high of 2478. If buyers break above 2478, the next target is 2500. On the lower side, the first strong support is at 2445, and then at 2414.
Here is the simple trading plan for Binance Square. If you want to buy, wait for a 15-minute candle to close above 2478. Then you can target 2500. If you want to sell, wait for the price to fail at 2478 and drop below 2445. Then you can target 2415. Because the RSI is overbought, do not buy right now at the top. Wait for a small price drop to the moving averages for a safer entry. Always use a stop loss to protect your money.
Thankyou
#etherreum $ETH
{future}(ETHUSDT)
Ethereum Price Analysis!!
Ethereum looking strong right now on the 15-minute chart. The price is at 2460.17, which is up almost 2% today. After falling to a low of 2384, the price has bounced back up above its moving averages. The 7-day moving average at 2455 and the 25-day moving average at 2445 are now helping the price stay high. Also, the Parabolic SAR dots are now below the candles, which means buyers are in control right now.
But be careful if you are doing short-term trading. The RSI is very high at 74.64. This means the price is overbought and moved up too fast. So, a small price drop or moving sideways is very possible right now. The first big resistance is at the 24-hour high of 2478. If buyers break above 2478, the next target is 2500. On the lower side, the first strong support is at 2445, and then at 2414.
Here is the simple trading plan for Binance Square. If you want to buy, wait for a 15-minute candle to close above 2478. Then you can target 2500. If you want to sell, wait for the price to fail at 2478 and drop below 2445. Then you can target 2415. Because the RSI is overbought, do not buy right now at the top. Wait for a small price drop to the moving averages for a safer entry. Always use a stop loss to protect your money.
Thankyou
#etherreum $ETH
Ethereum looking strong right now on the 15-minute chart. The price is at 2460.17, which is up almost 2% today. After falling to a low of 2384, the price has bounced back up above its moving averages. The 7-day moving average at 2455 and the 25-day moving average at 2445 are now helping the price stay high. Also, the Parabolic SAR dots are now below the candles, which means buyers are in control right now.
But be careful if you are doing short-term trading. The RSI is very high at 74.64. This means the price is overbought and moved up too fast. So, a small price drop or moving sideways is very possible right now. The first big resistance is at the 24-hour high of 2478. If buyers break above 2478, the next target is 2500. On the lower side, the first strong support is at 2445, and then at 2414.
Here is the simple trading plan for Binance Square. If you want to buy, wait for a 15-minute candle to close above 2478. Then you can target 2500. If you want to sell, wait for the price to fail at 2478 and drop below 2445. Then you can target 2415. Because the RSI is overbought, do not buy right now at the top. Wait for a small price drop to the moving averages for a safer entry. Always use a stop loss to protect your money.
Thankyou
#etherreum $ETH
1
1.1k

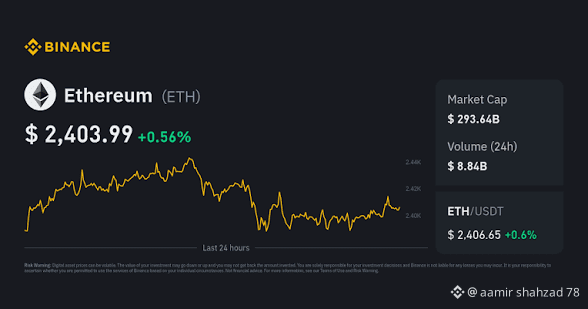
$ETH Ethereum (ETH) is a powerful blockchain platform known for its smart contracts, decentralization, security, and versatility. It supports decentralized applications (dApps), NFTs, decentralized finance (DeFi), and Web3 technologies. Unlike Bitcoin, Ethereum is designed not only as a digital currency but also as a platform for building innovative blockchain applications. Its growing ecosystem makes it an important part of the cryptocurrency world, although its price can be volatile and investments carry risk.
#etherreum #EarningsSeason
{spot}(ETHUSDT)
$ETH Ethereum (ETH) is a powerful blockchain platform known for its smart contracts, decentralization, security, and versatility. It supports decentralized applications (dApps), NFTs, decentralized finance (DeFi), and Web3 technologies. Unlike Bitcoin, Ethereum is designed not only as a digital currency but also as a platform for building innovative blockchain applications. Its growing ecosystem makes it an important part of the cryptocurrency world, although its price can be volatile and investments carry risk.
#etherreum #EarningsSeason
#etherreum #EarningsSeason

29

·
--
🚨 ETH/USDT ANALYSIS: RECOVERY OPPORTUNITY OR MORE DOWNSIDE?
Ethereum traders, keep your eyes on ETH! 👀
{spot}(ETHUSDT)
$ETH faced a difficult test as the market assesses institutional fund flows and broader crypto sentiment. With U.S. spot Ethereum ETFs recording approximately $320 million in net outflows during October 12–16, traders have to watch demand carefully.
📉 BEARISH SCENARIO
If ETH breaks below nearby support with rising selling volume, the price could go-down further. Continued ETF outflows may weigh on sentiment.
📈 BULLISH SCENARIO
If ETH holds support and reclaims nearby resistance with strong buying volume, a relief rally could develop. Improving ETF flows would add a positive signal, although price confirmation remains essential.
⚡ THREE SIGNALS TO WATCH
1️⃣ ETH/USDT support and resistance on the 4-hour chart.
2️⃣ Buying volume during any attempted recovery.
3️⃣ ETF flows and Bitcoin's overall direction.
🎯 MY STRATEGY: I would not buy ETH simply because its price has fallen. I would wait for a confirmed reversal or breakout, define a stop-loss, and check whether the potential reward justifies the risk.
A falling market can create opportunities, but catching the bottom without confirmation can be costly.
💬 WHAT DO YOU EXPECT NEXT?
🟢 ETH rebounds
🔴 ETH falls further
🟡 ETH consolidates
Share your analysis below! 👇
#etherreum #CryptoTrading #Altcoins! #Binance
🚨 ETH/USDT ANALYSIS: RECOVERY OPPORTUNITY OR MORE DOWNSIDE?
Ethereum traders, keep your eyes on ETH! 👀
$ETH faced a difficult test as the market assesses institutional fund flows and broader crypto sentiment. With U.S. spot Ethereum ETFs recording approximately $320 million in net outflows during October 12–16, traders have to watch demand carefully.
📉 BEARISH SCENARIO
If ETH breaks below nearby support with rising selling volume, the price could go-down further. Continued ETF outflows may weigh on sentiment.
📈 BULLISH SCENARIO
If ETH holds support and reclaims nearby resistance with strong buying volume, a relief rally could develop. Improving ETF flows would add a positive signal, although price confirmation remains essential.
⚡ THREE SIGNALS TO WATCH
1️⃣ ETH/USDT support and resistance on the 4-hour chart.
2️⃣ Buying volume during any attempted recovery.
3️⃣ ETF flows and Bitcoin's overall direction.
🎯 MY STRATEGY: I would not buy ETH simply because its price has fallen. I would wait for a confirmed reversal or breakout, define a stop-loss, and check whether the potential reward justifies the risk.
A falling market can create opportunities, but catching the bottom without confirmation can be costly.
💬 WHAT DO YOU EXPECT NEXT?
🟢 ETH rebounds
🔴 ETH falls further
🟡 ETH consolidates
Share your analysis below! 👇
#etherreum #CryptoTrading #Altcoins! #Binance
Ethereum traders, keep your eyes on ETH! 👀
$ETH faced a difficult test as the market assesses institutional fund flows and broader crypto sentiment. With U.S. spot Ethereum ETFs recording approximately $320 million in net outflows during October 12–16, traders have to watch demand carefully.
📉 BEARISH SCENARIO
If ETH breaks below nearby support with rising selling volume, the price could go-down further. Continued ETF outflows may weigh on sentiment.
📈 BULLISH SCENARIO
If ETH holds support and reclaims nearby resistance with strong buying volume, a relief rally could develop. Improving ETF flows would add a positive signal, although price confirmation remains essential.
⚡ THREE SIGNALS TO WATCH
1️⃣ ETH/USDT support and resistance on the 4-hour chart.
2️⃣ Buying volume during any attempted recovery.
3️⃣ ETF flows and Bitcoin's overall direction.
🎯 MY STRATEGY: I would not buy ETH simply because its price has fallen. I would wait for a confirmed reversal or breakout, define a stop-loss, and check whether the potential reward justifies the risk.
A falling market can create opportunities, but catching the bottom without confirmation can be costly.
💬 WHAT DO YOU EXPECT NEXT?
🟢 ETH rebounds
🔴 ETH falls further
🟡 ETH consolidates
Share your analysis below! 👇
#etherreum #CryptoTrading #Altcoins! #Binance
85

Scaling Solutions: Networks built on top of Ethereum (like Arbitrum, Optimism, Base, and Polygon) process transactions at fractions of a cent while anchoring their security directly back to Ethereum Layer 1.
Future-Proof Upgrades: Protocol upgrades (such as Pectra and Fusaka) continuously expand network throughput and lower fees across L2s.
Ethereum isn't just a cryptocurrency—it's the foundation of decentralized finance, NFTs, smart contracts, and thousands of blockchain applications. As innovation continues to grow, ETH remains one of the strongest projects shaping the future of digital finance.
#cryptouniverseofficial #Binance #etherreum #ETHETFsApproved
Scaling Solutions: Networks built on top of Ethereum (like Arbitrum, Optimism, Base, and Polygon) process transactions at fractions of a cent while anchoring their security directly back to Ethereum Layer 1.
Future-Proof Upgrades: Protocol upgrades (such as Pectra and Fusaka) continuously expand network throughput and lower fees across L2s.
Ethereum isn't just a cryptocurrency—it's the foundation of decentralized finance, NFTs, smart contracts, and thousands of blockchain applications. As innovation continues to grow, ETH remains one of the strongest projects shaping the future of digital finance.
#cryptouniverseofficial #Binance #etherreum #ETHETFsApproved
Future-Proof Upgrades: Protocol upgrades (such as Pectra and Fusaka) continuously expand network throughput and lower fees across L2s.
Ethereum isn't just a cryptocurrency—it's the foundation of decentralized finance, NFTs, smart contracts, and thousands of blockchain applications. As innovation continues to grow, ETH remains one of the strongest projects shaping the future of digital finance.
#cryptouniverseofficial #Binance #etherreum #ETHETFsApproved

85

·
--
$BTC Market Overview: Ethereum remains one of the leading cryptocurrencies, supported by its blockchain ecosystem, DeFi applications, and Layer 2 development. However, overall market conditions remain uncertain.
📈 Key Levels to Watch: 🟢 Support Zone: $3,250–$3,000
🔴 Resistance Zone: $3,500–$3,700
📊 Market Outlook: A sustained move above resistance could indicate stronger bullish momentum. If ETH loses support, further downside is possible.
⚠️ Important Factors: • Bitcoin's price movement
• Market liquidity and trading volume
• Global economic news
• Ethereum network activity
🎯 Conclusion: Ethereum's next move depends on price action around key support and resistance levels. Traders should confirm breakouts with volume and manage risk carefully.
💬 What is your outlook on ETH — bullish or bearish?
{spot}(BTCUSDT)
#etherreum #ETH🔥🔥🔥🔥🔥🔥 #CryptoNewss #Binance #TrendingTopic ading
$BTC Market Overview: Ethereum remains one of the leading cryptocurrencies, supported by its blockchain ecosystem, DeFi applications, and Layer 2 development. However, overall market conditions remain uncertain.
📈 Key Levels to Watch: 🟢 Support Zone: $3,250–$3,000
🔴 Resistance Zone: $3,500–$3,700
📊 Market Outlook: A sustained move above resistance could indicate stronger bullish momentum. If ETH loses support, further downside is possible.
⚠️ Important Factors: • Bitcoin's price movement
• Market liquidity and trading volume
• Global economic news
• Ethereum network activity
🎯 Conclusion: Ethereum's next move depends on price action around key support and resistance levels. Traders should confirm breakouts with volume and manage risk carefully.
💬 What is your outlook on ETH — bullish or bearish?
#etherreum #ETH🔥🔥🔥🔥🔥🔥 #CryptoNewss #Binance #TrendingTopic ading
📈 Key Levels to Watch: 🟢 Support Zone: $3,250–$3,000
🔴 Resistance Zone: $3,500–$3,700
📊 Market Outlook: A sustained move above resistance could indicate stronger bullish momentum. If ETH loses support, further downside is possible.
⚠️ Important Factors: • Bitcoin's price movement
• Market liquidity and trading volume
• Global economic news
• Ethereum network activity
🎯 Conclusion: Ethereum's next move depends on price action around key support and resistance levels. Traders should confirm breakouts with volume and manage risk carefully.
💬 What is your outlook on ETH — bullish or bearish?
#etherreum #ETH🔥🔥🔥🔥🔥🔥 #CryptoNewss #Binance #TrendingTopic ading

62

·
--
Рост
$ETH Ethereum (ETH) is a fundamental cryptocurrency, serving as the foundation for decentralized applications (dApps), non-fungible tokens (NFTs), and decentralized finance (DeFi). The platform transitioned to a Proof-of-Stake consensus mechanism through 'The Merge,' enhancing efficiency and reducing energy consumption. Currently, the crypto landscape is experiencing increased activity, and ETH is well-positioned for potential growth as blockchain adoption continues. Please note that cryptocurrency markets are highly volatile, and you should perform thorough research before making any investment decisions. This image is not financial advice.
#ETH #etherreum
{future}(ETHUSDT)
$ETH Ethereum (ETH) is a fundamental cryptocurrency, serving as the foundation for decentralized applications (dApps), non-fungible tokens (NFTs), and decentralized finance (DeFi). The platform transitioned to a Proof-of-Stake consensus mechanism through 'The Merge,' enhancing efficiency and reducing energy consumption. Currently, the crypto landscape is experiencing increased activity, and ETH is well-positioned for potential growth as blockchain adoption continues. Please note that cryptocurrency markets are highly volatile, and you should perform thorough research before making any investment decisions. This image is not financial advice.
#ETH #etherreum
#ETH #etherreum

66

$ETH
{spot}(ETHUSDT)
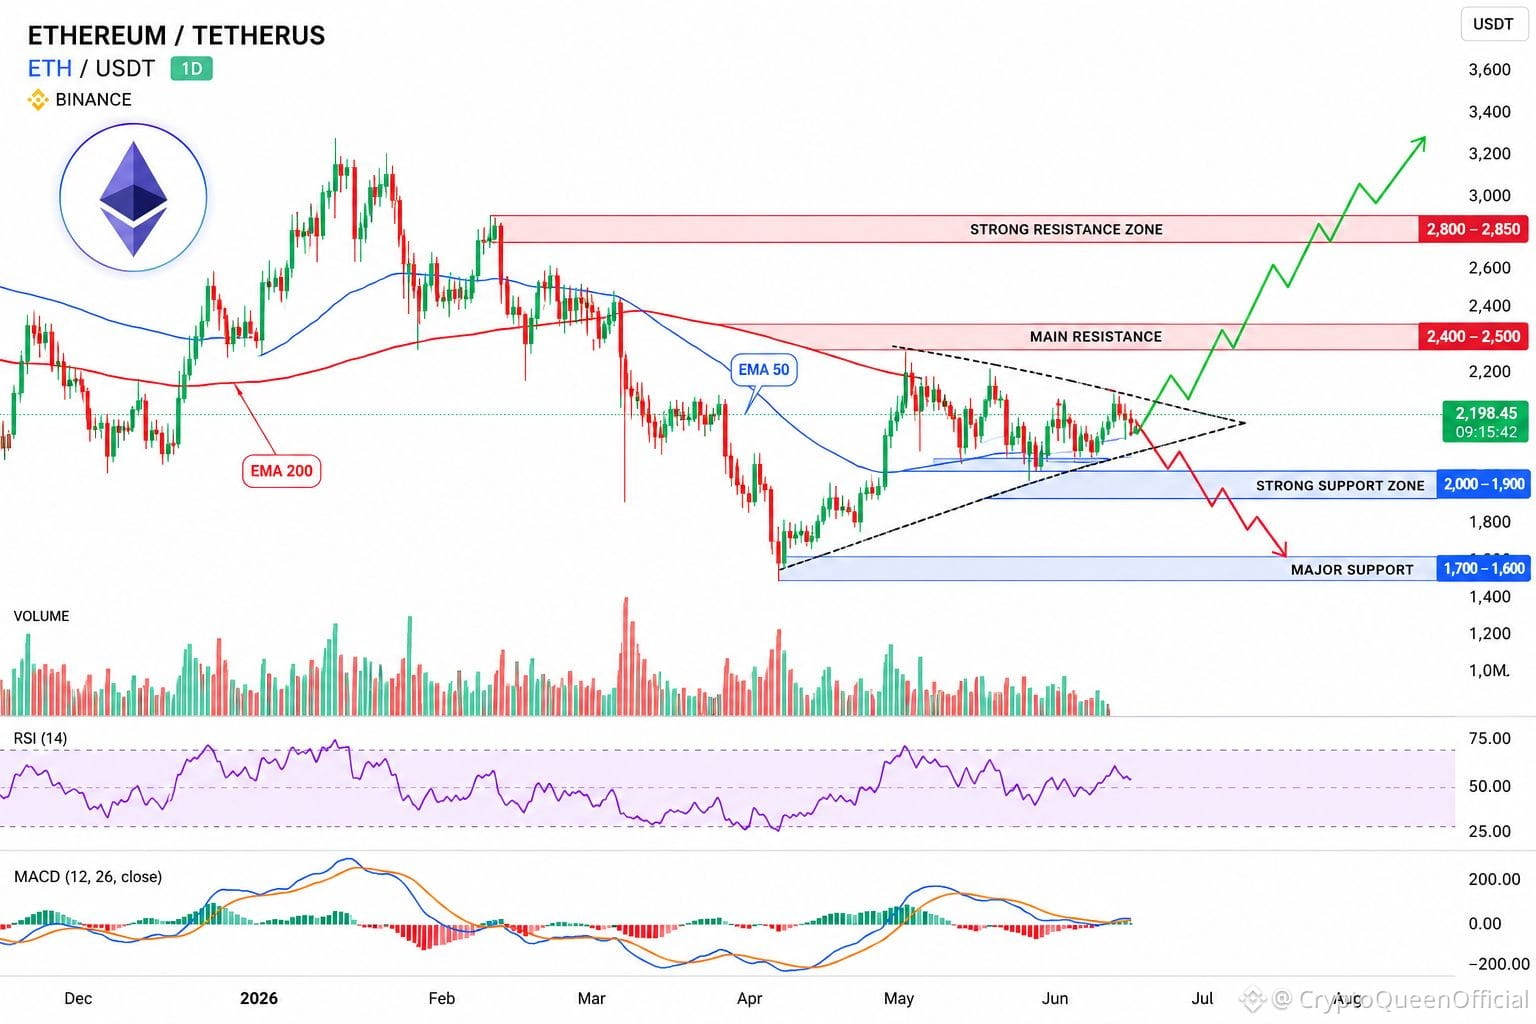
Latest Analysis — May 2026
Current Market Situation
Ethereum (ETH) is trading near the $2,100–$2,300 zone after facing strong volatility in recent weeks. The market is currently in a consolidation phase, meaning buyers and sellers are both waiting for the next major move. �
Reuters +1
Important Support & Resistance
Strong Support: $2,000 → $1,900
Main Resistance: $2,400 → $2,500
Bullish Breakout Zone: Above $2,420
Bearish Risk Zone: Below $2,000 �
MEXC +2
Bullish Signals 📈
Large ETH whale wallets recently accumulated over 140,000 ETH, showing strong long-term confidence. �
MEXC +1
Around 30% of ETH supply is staked, reducing selling pressure in the market. �
MEXC +2
Upcoming Ethereum upgrades may improve speed and scalability significantly. �
MEXC
Institutional ETF inflows are slowly returning positive. �
MEXC
Bearish Risks 📉
ETH is still below major resistance levels and market sentiment remains cautious. �
Economic Times +1
Some analysts warn that a breakdown under $2,000 could push ETH toward the $1,700 area. �
Cointelegraph +1
Exchange supply is increasing slightly, which may create short-term selling pressure. �
BanklessTimes
Short-Term Outlook
If Ethereum breaks and holds above $2,420, the next target could be:
$2,650 → $3,000
But if ETH falls below $2,000, the market may revisit:
$1,700 → $1,900
Overall Trend
Current trend:
Short-Term: Neutral / Slightly Bearish
Long-Term: Bullish because of strong adoption, staking growth, and Ethereum ecosystem expansion. �
Reddit +1
#Ethereum #etherreum
$ETH
Latest Analysis — May 2026
Current Market Situation
Ethereum (ETH) is trading near the $2,100–$2,300 zone after facing strong volatility in recent weeks. The market is currently in a consolidation phase, meaning buyers and sellers are both waiting for the next major move. �
Reuters +1
Important Support & Resistance
Strong Support: $2,000 → $1,900
Main Resistance: $2,400 → $2,500
Bullish Breakout Zone: Above $2,420
Bearish Risk Zone: Below $2,000 �
MEXC +2
Bullish Signals 📈
Large ETH whale wallets recently accumulated over 140,000 ETH, showing strong long-term confidence. �
MEXC +1
Around 30% of ETH supply is staked, reducing selling pressure in the market. �
MEXC +2
Upcoming Ethereum upgrades may improve speed and scalability significantly. �
MEXC
Institutional ETF inflows are slowly returning positive. �
MEXC
Bearish Risks 📉
ETH is still below major resistance levels and market sentiment remains cautious. �
Economic Times +1
Some analysts warn that a breakdown under $2,000 could push ETH toward the $1,700 area. �
Cointelegraph +1
Exchange supply is increasing slightly, which may create short-term selling pressure. �
BanklessTimes
Short-Term Outlook
If Ethereum breaks and holds above $2,420, the next target could be:
$2,650 → $3,000
But if ETH falls below $2,000, the market may revisit:
$1,700 → $1,900
Overall Trend
Current trend:
Short-Term: Neutral / Slightly Bearish
Long-Term: Bullish because of strong adoption, staking growth, and Ethereum ecosystem expansion. �
Reddit +1
#Ethereum #etherreum
Latest Analysis — May 2026
Current Market Situation
Ethereum (ETH) is trading near the $2,100–$2,300 zone after facing strong volatility in recent weeks. The market is currently in a consolidation phase, meaning buyers and sellers are both waiting for the next major move. �
Reuters +1
Important Support & Resistance
Strong Support: $2,000 → $1,900
Main Resistance: $2,400 → $2,500
Bullish Breakout Zone: Above $2,420
Bearish Risk Zone: Below $2,000 �
MEXC +2
Bullish Signals 📈
Large ETH whale wallets recently accumulated over 140,000 ETH, showing strong long-term confidence. �
MEXC +1
Around 30% of ETH supply is staked, reducing selling pressure in the market. �
MEXC +2
Upcoming Ethereum upgrades may improve speed and scalability significantly. �
MEXC
Institutional ETF inflows are slowly returning positive. �
MEXC
Bearish Risks 📉
ETH is still below major resistance levels and market sentiment remains cautious. �
Economic Times +1
Some analysts warn that a breakdown under $2,000 could push ETH toward the $1,700 area. �
Cointelegraph +1
Exchange supply is increasing slightly, which may create short-term selling pressure. �
BanklessTimes
Short-Term Outlook
If Ethereum breaks and holds above $2,420, the next target could be:
$2,650 → $3,000
But if ETH falls below $2,000, the market may revisit:
$1,700 → $1,900
Overall Trend
Current trend:
Short-Term: Neutral / Slightly Bearish
Long-Term: Bullish because of strong adoption, staking growth, and Ethereum ecosystem expansion. �
Reddit +1
#Ethereum #etherreum
51

·
--
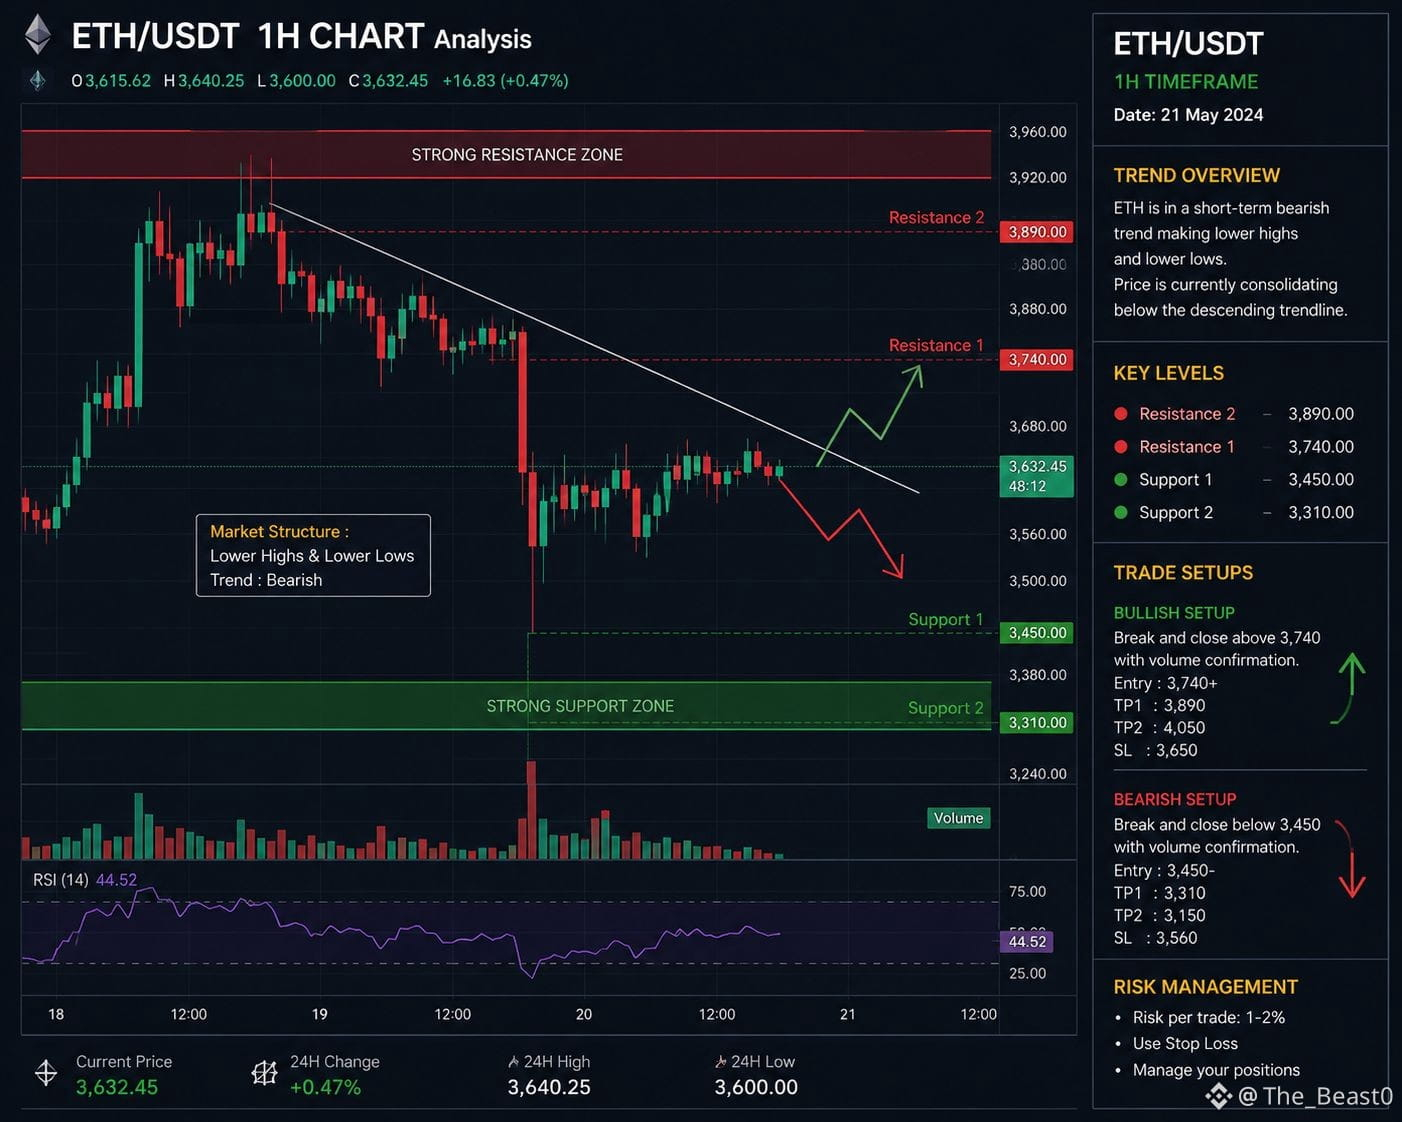
@Ethereum_official @Ethereum_World_News @eth_classic 📈 Bullish Trade:
•Buy only if ETH breaks above the nearest resistance with strong volume.
•Target 1: +2%
•Target 2: +4%
•Stop Loss: 1–1.5% below your entry.
#ETH
{future}(ETHUSDT)
📉Bearish trade:
•Sell/Short only if ETH breaks below today's support level with confirmation.
•Target 1: -2%
•Target 2: -4%
•Stop Loss: 1–1.5% above your entry.
#ETH #UKFCAFinalizesCryptoFramework #etherreum
@Ethereum @Ethereum World News @Ethereum Classic 📈 Bullish Trade:
•Buy only if ETH breaks above the nearest resistance with strong volume.
•Target 1: +2%
•Target 2: +4%
•Stop Loss: 1–1.5% below your entry.
#ETH
📉Bearish trade:
•Sell/Short only if ETH breaks below today's support level with confirmation.
•Target 1: -2%
•Target 2: -4%
•Stop Loss: 1–1.5% above your entry.
#ETH #UKFCAFinalizesCryptoFramework #etherreum
•Buy only if ETH breaks above the nearest resistance with strong volume.
•Target 1: +2%
•Target 2: +4%
•Stop Loss: 1–1.5% below your entry.
#ETH
📉Bearish trade:
•Sell/Short only if ETH breaks below today's support level with confirmation.
•Target 1: -2%
•Target 2: -4%
•Stop Loss: 1–1.5% above your entry.
#ETH #UKFCAFinalizesCryptoFramework #etherreum
108


Статья
🔥 #Ethereum $ETH Daily Analysis | May 25, 2026$ETH is trading at $2,100.96 today, with a 24H range of $2,058.73 – $2,141.81 and a trading volume of $13.92B. Market cap stands at $253.41B (+1.99% in 24H), ranking #2 overall. (Bybit)
📊 Technical Snapshot:
$ETH is currently trading below its 200-day MA at $2,116.80, with the monthly RSI at 36 — signaling oversold conditions. A monthly close above $2,260 would confirm bullish momentum heading into Q3. (CoinDCX)
⚡ Key Levels to Watch:
Critical support sits at $2,067 — a break below could push $ETH toward the $1,909–$1,741 zone. On the upside, $2,242 is the key resistance to crack. (Bybit)
🚀 Catalyst to Watch:
The Glamsterdam upgrade, targeting June 2026, could triple Ethereum's Layer 1 throughput — a major catalyst the market hasn't fully priced in yet.
#Ethereum #ETH🔥🔥🔥🔥🔥🔥 #etherreum
🔥 #Ethereum $ETH Daily Analysis | May 25, 2026
$ETH is trading at $2,100.96 today, with a 24H range of $2,058.73 – $2,141.81 and a trading volume of $13.92B. Market cap stands at $253.41B (+1.99% in 24H), ranking #2 overall. (Bybit)
📊 Technical Snapshot:
$ETH is currently trading below its 200-day MA at $2,116.80, with the monthly RSI at 36 — signaling oversold conditions. A monthly close above $2,260 would confirm bullish momentum heading into Q3. (CoinDCX)
⚡ Key Levels to Watch:
Critical support sits at $2,067 — a break below could push $ETH toward the $1,909–$1,741 zone. On the upside, $2,242 is the key resistance to crack. (Bybit)
🚀 Catalyst to Watch:
The Glamsterdam upgrade, targeting June 2026, could triple Ethereum's Layer 1 throughput — a major catalyst the market hasn't fully priced in yet.
#Ethereum #ETH🔥🔥🔥🔥🔥🔥 #etherreum
📊 Technical Snapshot:
$ETH is currently trading below its 200-day MA at $2,116.80, with the monthly RSI at 36 — signaling oversold conditions. A monthly close above $2,260 would confirm bullish momentum heading into Q3. (CoinDCX)
⚡ Key Levels to Watch:
Critical support sits at $2,067 — a break below could push $ETH toward the $1,909–$1,741 zone. On the upside, $2,242 is the key resistance to crack. (Bybit)
🚀 Catalyst to Watch:
The Glamsterdam upgrade, targeting June 2026, could triple Ethereum's Layer 1 throughput — a major catalyst the market hasn't fully priced in yet.
#Ethereum #ETH🔥🔥🔥🔥🔥🔥 #etherreum
63

·
--
Рост
$ETH
{future}(ETHUSDT)
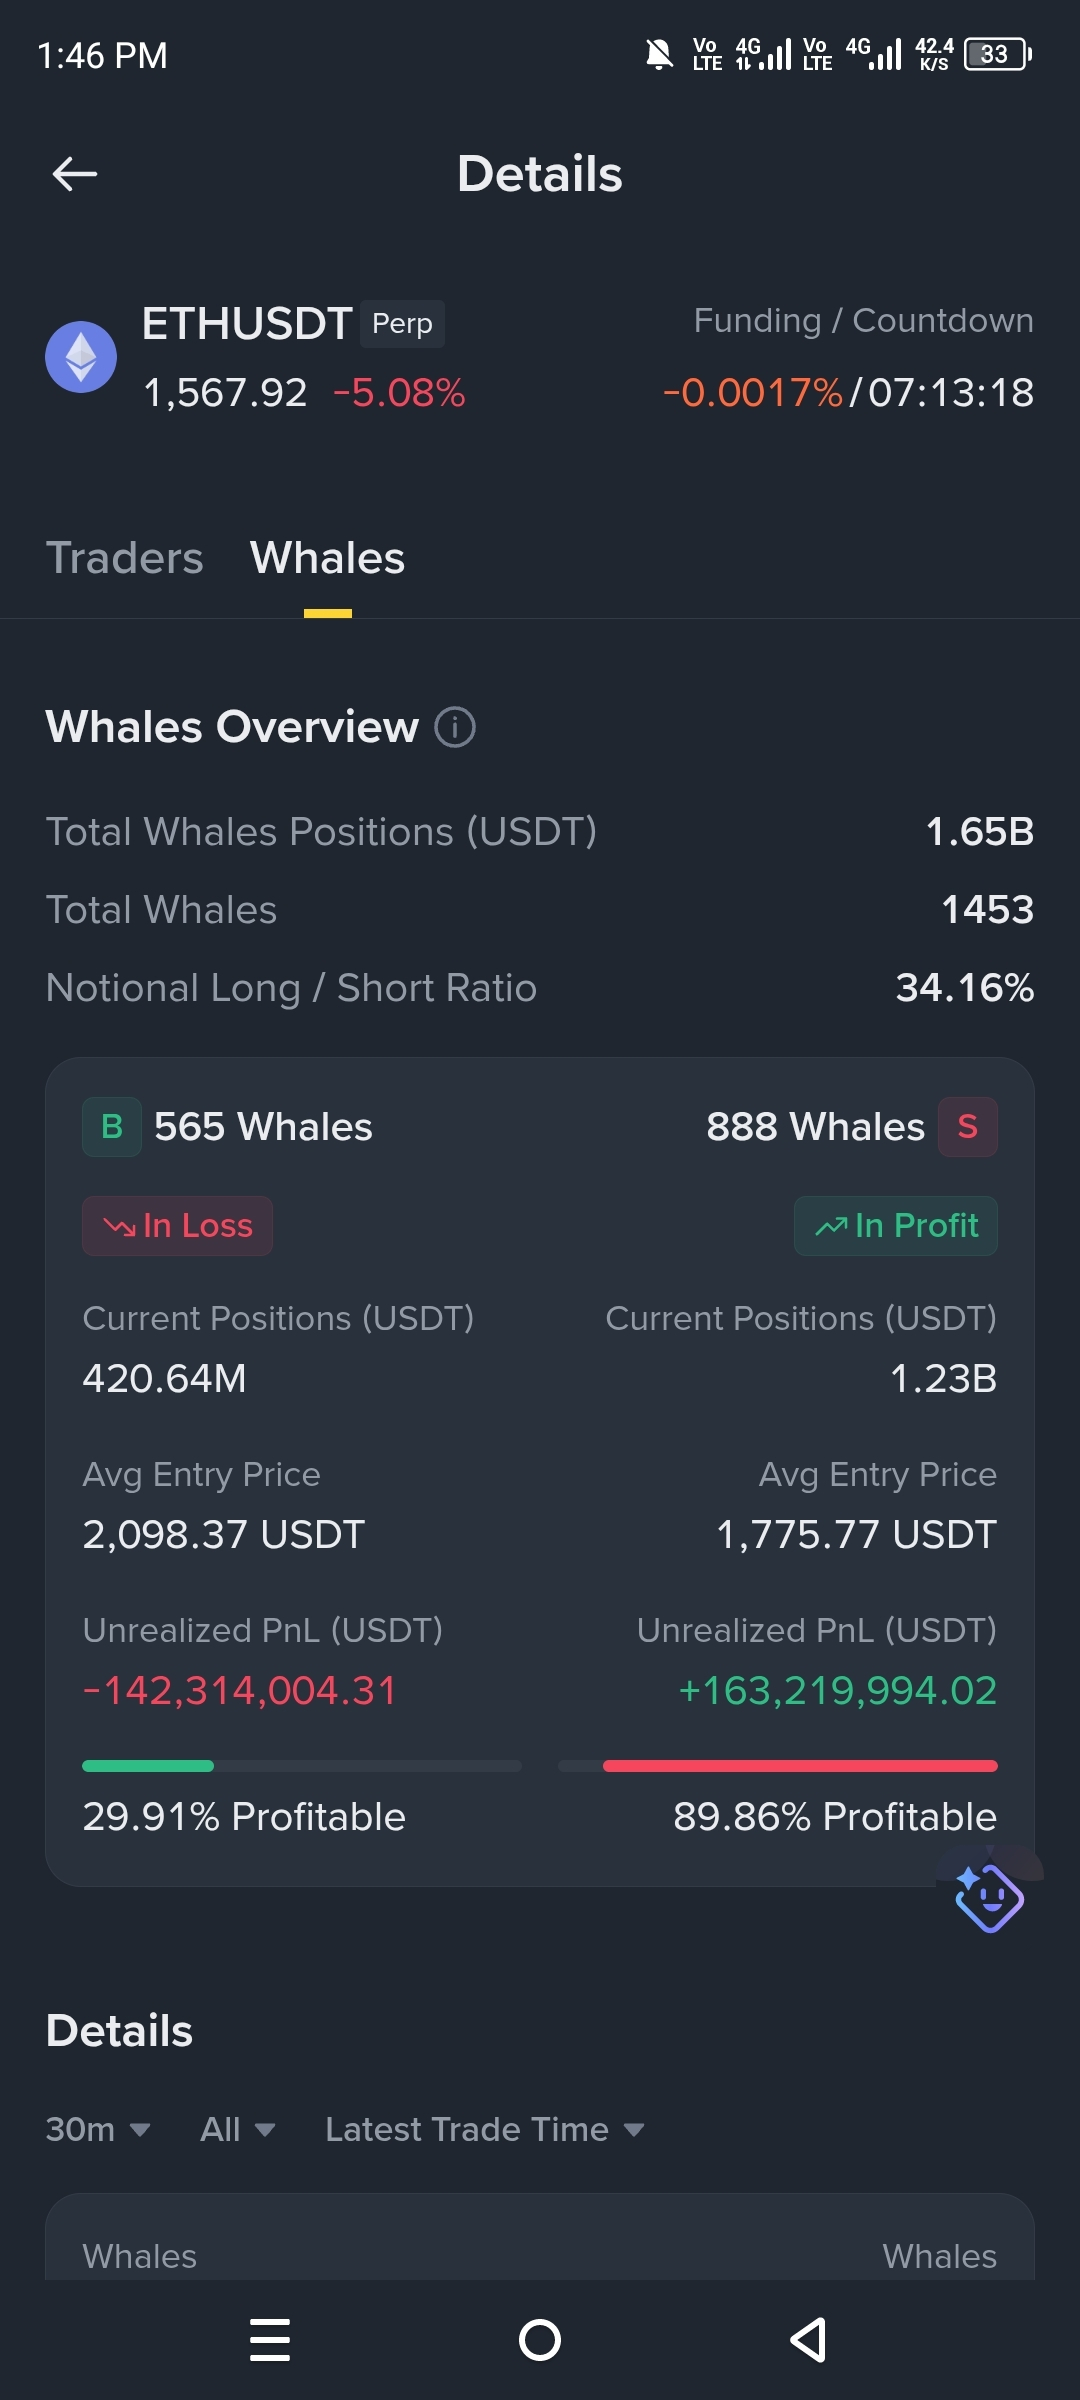
Thinking Ethereum is going to save your portfolio right now is pure delusion! The whales are aggressively shorting, and nearly 90% of them are already sitting on massive realized profits while longs are completely trapped. I refuse to fight the biggest players in the game. I am loading up on a heavy short position before the next leg down.
- My Entry: 1,567.90 USDT
- My Direction: Short
- My Target (TP): 1,350.00 USDT
- My Stop Loss (SL): 1,720.00 USDT
DYOR
#ETHETFsApproved #ETHETFS #ETGCOIN #etherreum #etherreum
$ETH
Thinking Ethereum is going to save your portfolio right now is pure delusion! The whales are aggressively shorting, and nearly 90% of them are already sitting on massive realized profits while longs are completely trapped. I refuse to fight the biggest players in the game. I am loading up on a heavy short position before the next leg down.
- My Entry: 1,567.90 USDT
- My Direction: Short
- My Target (TP): 1,350.00 USDT
- My Stop Loss (SL): 1,720.00 USDT
DYOR
#ETHETFsApproved #ETHETFS #ETGCOIN #etherreum #etherreum
Thinking Ethereum is going to save your portfolio right now is pure delusion! The whales are aggressively shorting, and nearly 90% of them are already sitting on massive realized profits while longs are completely trapped. I refuse to fight the biggest players in the game. I am loading up on a heavy short position before the next leg down.
- My Entry: 1,567.90 USDT
- My Direction: Short
- My Target (TP): 1,350.00 USDT
- My Stop Loss (SL): 1,720.00 USDT
DYOR
#ETHETFsApproved #ETHETFS #ETGCOIN #etherreum #etherreum
107
⚡ Ethereum en zona de guerra: Lucha por recuperar los $1,900 mientras datos on-chain revelan acumulación silenciosa
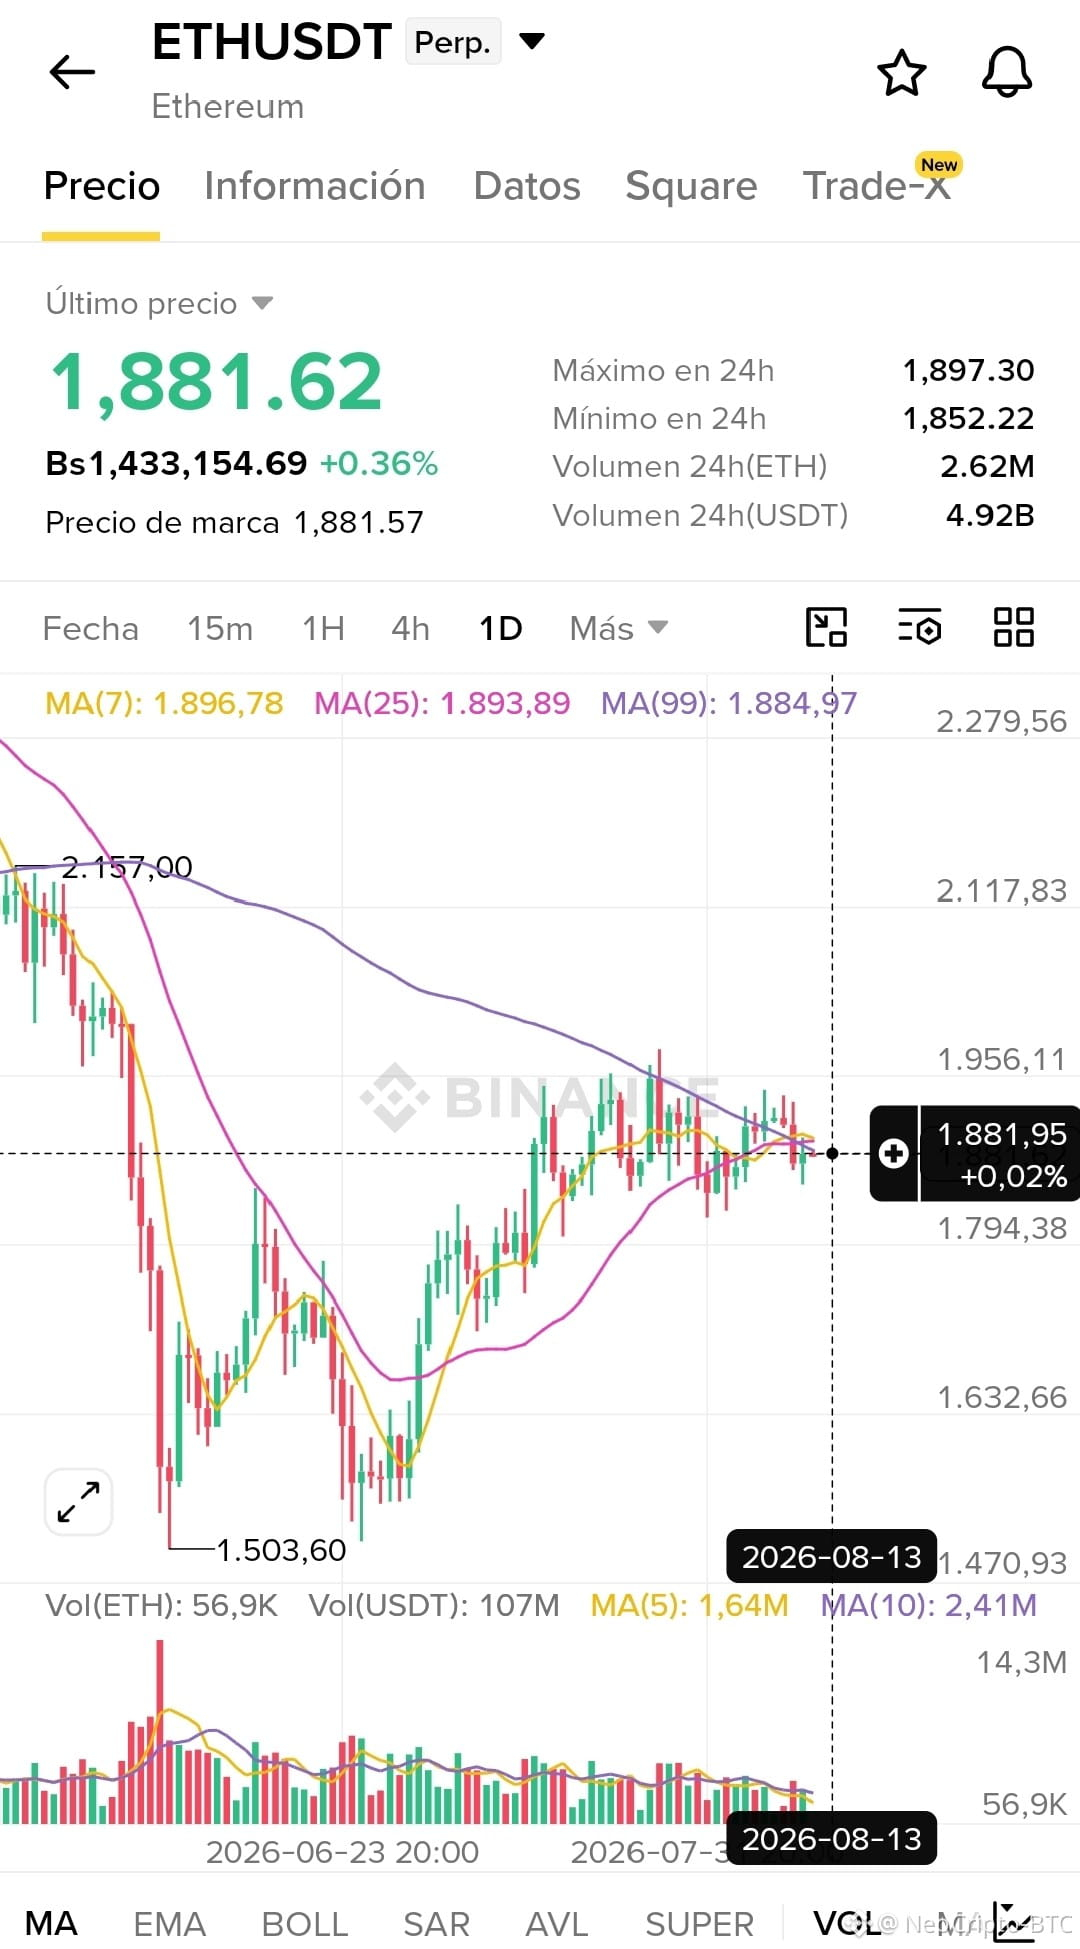
Ethereum cotiza hoy cerca de los $1,880, tras un ligero repunte del 0.5% en las últimas 24 horas. Tras semanas de presión bajista, la red principal de contratos inteligentes se encuentra en un punto de inflexión técnico y fundamental.
¿Qué pasó?
El mercado está digiriendo la reciente volatilidad. Tras caer por debajo del nivel psicológico de los $1,900, Ethereum está intentando consolidar una base. Mientras el pánico minorista se palpa en redes sociales, los grandes capitales están actuando de forma distinta.
Datos que confirman la batalla:
🔹 Soporte y Resistencia: El rango clave a vigilar es $1,780 - $1,950. Romper los $1,950 activaría liquidaciones cortas por $767 millones, impulsando el precio rápidamente. Perder los $1,780 activaría liquidaciones largas por $786 millones.
🔹 Movimiento de Ballenas: Datos on-chain detectaron recientemente el retiro de más de 9,000 ETH de exchanges hacia custodia propia para staking, una señal clásica de acumulación a largo plazo.
🔹 Institucionales Firmes: Los ETF spot de Ethereum mantienen activos netos por más de $10,600 millones, lo que representa el 4.58% del valor total de ETH, demostrando que el interés institucional no ha desaparecido.
¿Por qué importa esto?
Estamos en un momento técnico crítico. La divergencia entre la acción del precio bajista a corto plazo y la acumulación silenciosa on-chain de ballenas e institucionales suele preceder a movimientos violentos. Si logramos recuperar y consolidar los $1,900, la estructura técnica podría cambiar a alcista.
Mi lectura: No es momento de pánico, es momento de observar los niveles clave. La verdadera dirección la definirán las liquidaciones masivas en $1,780 o $1,950.
¿Creen que las ballenas ganarán la batalla y recuperaremos los $1,950 esta semana, o el mercado probará el soporte de $1,780? 👇
#etherreum
$ETH
{future}(ETHUSDT)
⚡ Ethereum en zona de guerra: Lucha por recuperar los $1,900 mientras datos on-chain revelan acumulación silenciosa
Ethereum cotiza hoy cerca de los $1,880, tras un ligero repunte del 0.5% en las últimas 24 horas. Tras semanas de presión bajista, la red principal de contratos inteligentes se encuentra en un punto de inflexión técnico y fundamental.
¿Qué pasó?
El mercado está digiriendo la reciente volatilidad. Tras caer por debajo del nivel psicológico de los $1,900, Ethereum está intentando consolidar una base. Mientras el pánico minorista se palpa en redes sociales, los grandes capitales están actuando de forma distinta.
Datos que confirman la batalla:
🔹 Soporte y Resistencia: El rango clave a vigilar es $1,780 - $1,950. Romper los $1,950 activaría liquidaciones cortas por $767 millones, impulsando el precio rápidamente. Perder los $1,780 activaría liquidaciones largas por $786 millones.
🔹 Movimiento de Ballenas: Datos on-chain detectaron recientemente el retiro de más de 9,000 ETH de exchanges hacia custodia propia para staking, una señal clásica de acumulación a largo plazo.
🔹 Institucionales Firmes: Los ETF spot de Ethereum mantienen activos netos por más de $10,600 millones, lo que representa el 4.58% del valor total de ETH, demostrando que el interés institucional no ha desaparecido.
¿Por qué importa esto?
Estamos en un momento técnico crítico. La divergencia entre la acción del precio bajista a corto plazo y la acumulación silenciosa on-chain de ballenas e institucionales suele preceder a movimientos violentos. Si logramos recuperar y consolidar los $1,900, la estructura técnica podría cambiar a alcista.
Mi lectura: No es momento de pánico, es momento de observar los niveles clave. La verdadera dirección la definirán las liquidaciones masivas en $1,780 o $1,950.
¿Creen que las ballenas ganarán la batalla y recuperaremos los $1,950 esta semana, o el mercado probará el soporte de $1,780? 👇
#etherreum
$ETH
Ethereum cotiza hoy cerca de los $1,880, tras un ligero repunte del 0.5% en las últimas 24 horas. Tras semanas de presión bajista, la red principal de contratos inteligentes se encuentra en un punto de inflexión técnico y fundamental.
¿Qué pasó?
El mercado está digiriendo la reciente volatilidad. Tras caer por debajo del nivel psicológico de los $1,900, Ethereum está intentando consolidar una base. Mientras el pánico minorista se palpa en redes sociales, los grandes capitales están actuando de forma distinta.
Datos que confirman la batalla:
🔹 Soporte y Resistencia: El rango clave a vigilar es $1,780 - $1,950. Romper los $1,950 activaría liquidaciones cortas por $767 millones, impulsando el precio rápidamente. Perder los $1,780 activaría liquidaciones largas por $786 millones.
🔹 Movimiento de Ballenas: Datos on-chain detectaron recientemente el retiro de más de 9,000 ETH de exchanges hacia custodia propia para staking, una señal clásica de acumulación a largo plazo.
🔹 Institucionales Firmes: Los ETF spot de Ethereum mantienen activos netos por más de $10,600 millones, lo que representa el 4.58% del valor total de ETH, demostrando que el interés institucional no ha desaparecido.
¿Por qué importa esto?
Estamos en un momento técnico crítico. La divergencia entre la acción del precio bajista a corto plazo y la acumulación silenciosa on-chain de ballenas e institucionales suele preceder a movimientos violentos. Si logramos recuperar y consolidar los $1,900, la estructura técnica podría cambiar a alcista.
Mi lectura: No es momento de pánico, es momento de observar los niveles clave. La verdadera dirección la definirán las liquidaciones masivas en $1,780 o $1,950.
¿Creen que las ballenas ganarán la batalla y recuperaremos los $1,950 esta semana, o el mercado probará el soporte de $1,780? 👇
#etherreum
$ETH
1
167
Войдите, чтобы посмотреть больше материала
Присоединяйтесь к пользователям криптовалют по всему миру на Binance Square
⚡️ Получайте новейшую и полезную информацию о криптоактивах.
💬 Нам доверяет крупнейшая в мире криптобиржа.
👍 Получите достоверные аналитические данные от верифицированных создателей контента.
Эл. почта/номер телефона
В тренде
1
#NvidiaEarningsTonight:AIStocks’NextMove?
Просмотров: 47,709
742 обсуждают
2
#A Packed Week of Earnings and Data Tests Markets
Просмотров: 115,795
585 обсуждают
3
#AnthropicIPOTestsInvestorAppetiteForAI
Просмотров: 252,113
2,469 обсуждают
4
#NvidiaBoardNotConsideringHuang’sReturnasCEO
Просмотров: 66,214
687 обсуждают
5
#KOSPIFalls2.59%ToLowestCloseSinceFebruary
Просмотров: 6,802
118 обсуждают
6
#AnthropicClearedToListOnNasdaqAsANT
Просмотров: 9,640
120 обсуждают
7
#WhatInvestmentSignalsDo13FFilingsReveal?
Просмотров: 39,287
516 обсуждают
8
#TetherCapitalMakesStrategicInvestmentInStables
Просмотров: 1,909
24 обсуждают
9
#EvernorthRecords$505MImpairmentOnPreListingXRP
Просмотров: 1,022
16 обсуждают
10
#GoldmanSachsReports$1.22BInEtherETFHoldings
Просмотров: 723
15 обсуждают