

#atr
atr
Просмотров: 46,517
88 обсуждают
Популярные
Новые

·
--
🎓 ¿Por qué un movimiento del 3 % es "nada" en PEPE y mucho en BTC? La respuesta tiene nombre: ATR.
📌 El concepto: el ATR (Average True Range, rango verdadero medio) mide cuánto se mueve el precio por vela, en promedio, en las últimas 14 velas. No dice si sube o baja: solo cuánto se mueve.
📊 Ejemplo con datos de hoy (Binance):
• $BTC : ATR de 4 h ≈ 891 $ (1,1 %) y diario ≈ 2.120 $ (2,5 %).
• $PEPE : ATR diario del 7 %.
• $IOST : ATR de 4 h del 20,5 % → en una sola vela de 4 h se mueve lo que BTC en más de una semana.
❌ Error común: usar el mismo % de stop o de objetivo para todas las monedas. Un stop del 2 % en IOST puede saltar con el ruido normal de una vela; en BTC, 2 % ya es un movimiento real. Primero mira el ATR, luego decide.
✅ En una línea: el ATR no predice la dirección, te dice cuánto ruido esperar.
#ATR #AnálisisTécnico #Educación #Cripto #Tra100d
⚠️ Contenido solo informativo y educativo, no es asesoría financiera. Las criptomonedas son volátiles: investiga y opera con precaución.
159

·
--
🚨 Индикатор ATR — твой компас волатильности!
ATR (Average True Range) измеряет средний размах цены за период. $BTC ATR(14) = 184.31. Это значит, что в среднем цена проходит $184 за свечу. Чем выше ATR — тем сильнее движения и выше риск.
Как использовать:
· Стоп-лосс: ставьте не ближе 1×ATR от входа — иначе выбьет шумом.
· Тейк-профит: цель минимум 2×ATR для хорошего соотношения риск/прибыль.
· Размер позиции: чем выше ATR, тем меньше лот.
Сейчас BTC у $85,334 (+0.58%), RSI 65 — рост есть, но волатильность растёт. Учитывайте ATR перед входом!
🔥 Как думаешь, ATR поможет тебе торговать точнее? 👇
👉 Подпишись на разборы индикаторов!
#ATR #IndicatorsAnalysis
{spot}(BTCUSDT)
{spot}(ETHUSDT)
{spot}(XRPUSDT)
🚨 Индикатор ATR — твой компас волатильности!
ATR (Average True Range) измеряет средний размах цены за период. $BTC ATR(14) = 184.31. Это значит, что в среднем цена проходит $184 за свечу. Чем выше ATR — тем сильнее движения и выше риск.
Как использовать:
· Стоп-лосс: ставьте не ближе 1×ATR от входа — иначе выбьет шумом.
· Тейк-профит: цель минимум 2×ATR для хорошего соотношения риск/прибыль.
· Размер позиции: чем выше ATR, тем меньше лот.
Сейчас BTC у $85,334 (+0.58%), RSI 65 — рост есть, но волатильность растёт. Учитывайте ATR перед входом!
🔥 Как думаешь, ATR поможет тебе торговать точнее? 👇
👉 Подпишись на разборы индикаторов!
#ATR #IndicatorsAnalysis
140

·
--
📊 $ATR.US
{stock_us}(ATR.US)
: The Indicator That Measures Market Volatility
If you trade crypto, knowing how much the market is moving can be just as important as knowing the direction.
🔹 ATR = Average True Range
It measures market volatility — not whether price will go up or down.
💡 How traders use ATR:
• Higher ATR → stronger volatility & larger price swings
• Lower ATR → quieter market & smaller movements
• ATR can help set more realistic Stop Loss and Take Profit levels
• Useful for avoiding stops that are too tight during volatile markets
📌 Example:
If BTC has a high ATR, a very tight stop-loss may be hit by normal market fluctuations. Traders may use ATR to understand the typical range before choosing their risk level.
#ATR #CryptoTrading #BinanceSquare #TradingEducation
📊 $ATR.US
: The Indicator That Measures Market Volatility
If you trade crypto, knowing how much the market is moving can be just as important as knowing the direction.
🔹 ATR = Average True Range
It measures market volatility — not whether price will go up or down.
💡 How traders use ATR:
• Higher ATR → stronger volatility & larger price swings
• Lower ATR → quieter market & smaller movements
• ATR can help set more realistic Stop Loss and Take Profit levels
• Useful for avoiding stops that are too tight during volatile markets
📌 Example:
If BTC has a high ATR, a very tight stop-loss may be hit by normal market fluctuations. Traders may use ATR to understand the typical range before choosing their risk level.
#ATR #CryptoTrading #BinanceSquare #TradingEducation
ATRUS+0,37%
95

·
--

Статья
📊 مؤشر ATR وعلاقته بتحديد وقف الخسارة بدقة وتأمين الأموال:📊 شرح مبسط لمؤشر ATR:
■ كثير من المتداولين يخسرون صفقاتهم ليس بسبب خطأ في الاتجاه، بل بسبب وضع وقف خسارة ضيق لا يتحمل تذبذب السوق الطبيعي.
■ هنا تأتي أهمية مؤشر ATR أو “متوسط المدى الحقيقي”، فهو من أفضل الأدوات التي تساعد على فهم قوة حركة السعر وتقلباته.
■ مؤشر ATR لا يحدد إن كان السوق صاعدًا أو هابطًا، بل يقيس فقط حجم الحركة والتذبذب.
■ عندما يرتفع ATR فهذا يعني أن السوق يتحرك بعنف وتقلباته عالية، وعندما ينخفض فهذا يدل على هدوء الحركة وضعف التذبذب.
💡 كيف يساعد ATR في وقف الخسارة؟
■ بدلاً من وضع وقف خسارة عشوائي، يستخدم المتداول ATR لتحديد مسافة منطقية وآمنة تتناسب مع حركة السوق.
■ مثال:
إذا كان سعر الأصل $100 وقراءة ATR تساوي $2 فهذا يعني أن السعر يتحرك بمتوسط $2 يوميًا.
✅ يمكن وضع وقف الخسارة على بعد:
• 1.5 <<< ATR = $3
• أو 2 <<< ATR = $4
وبذلك تتجنب الخروج المبكر بسبب الذبذبات الطبيعية.
📌 فوائد استخدام ATR:
✔️ حماية رأس المال
✔️ تقليل التصفية العشوائية
✔️ تحسين إدارة المخاطر
✔️ اختيار حجم صفقة مناسب حسب تقلب السوق
■ المتداول الذكي لا يضع وقف الخسارة بناءً على المشاعر، بل بناءً على حركة السوق الحقيقية.
..
..
..
$AGT
$GRASS
$IN
#atr #Atr_analysis
📊 مؤشر ATR وعلاقته بتحديد وقف الخسارة بدقة وتأمين الأموال:
📊 شرح مبسط لمؤشر ATR:
■ كثير من المتداولين يخسرون صفقاتهم ليس بسبب خطأ في الاتجاه، بل بسبب وضع وقف خسارة ضيق لا يتحمل تذبذب السوق الطبيعي.
■ هنا تأتي أهمية مؤشر ATR أو “متوسط المدى الحقيقي”، فهو من أفضل الأدوات التي تساعد على فهم قوة حركة السعر وتقلباته.
■ مؤشر ATR لا يحدد إن كان السوق صاعدًا أو هابطًا، بل يقيس فقط حجم الحركة والتذبذب.
■ عندما يرتفع ATR فهذا يعني أن السوق يتحرك بعنف وتقلباته عالية، وعندما ينخفض فهذا يدل على هدوء الحركة وضعف التذبذب.
💡 كيف يساعد ATR في وقف الخسارة؟
■ بدلاً من وضع وقف خسارة عشوائي، يستخدم المتداول ATR لتحديد مسافة منطقية وآمنة تتناسب مع حركة السوق.
■ مثال:
إذا كان سعر الأصل $100 وقراءة ATR تساوي $2 فهذا يعني أن السعر يتحرك بمتوسط $2 يوميًا.
✅ يمكن وضع وقف الخسارة على بعد:
• 1.5 <<< ATR = $3
• أو 2 <<< ATR = $4
وبذلك تتجنب الخروج المبكر بسبب الذبذبات الطبيعية.
📌 فوائد استخدام ATR:
✔️ حماية رأس المال
✔️ تقليل التصفية العشوائية
✔️ تحسين إدارة المخاطر
✔️ اختيار حجم صفقة مناسب حسب تقلب السوق
■ المتداول الذكي لا يضع وقف الخسارة بناءً على المشاعر، بل بناءً على حركة السوق الحقيقية.
..
..
..
$AGT
$GRASS
$IN
#atr #Atr_analysis
212

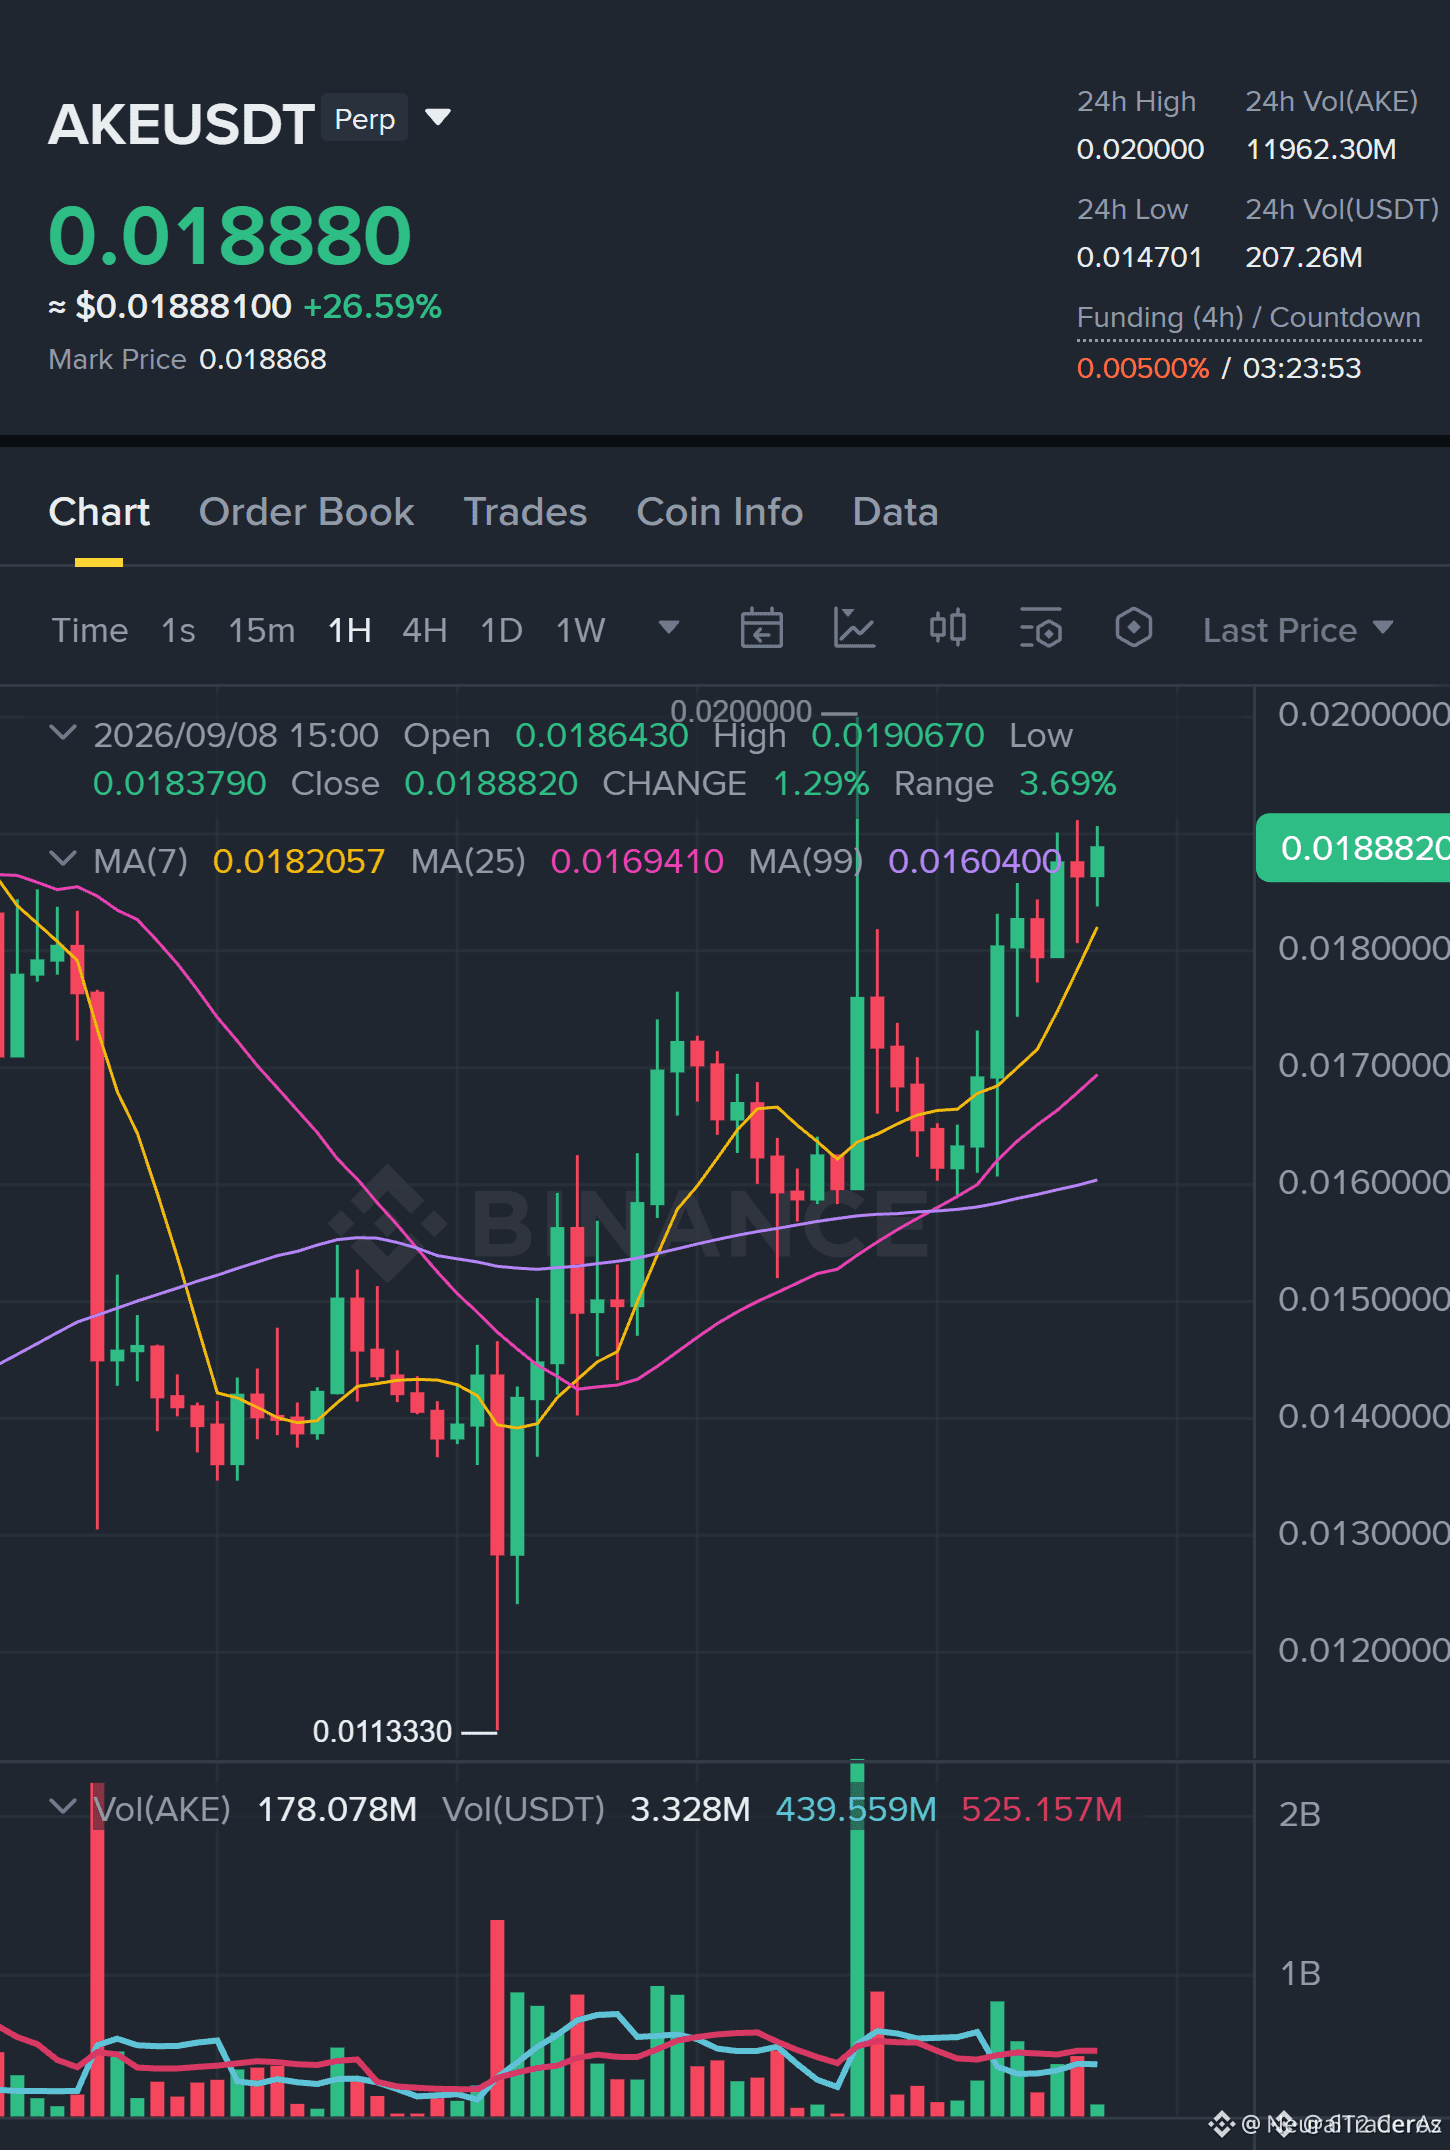
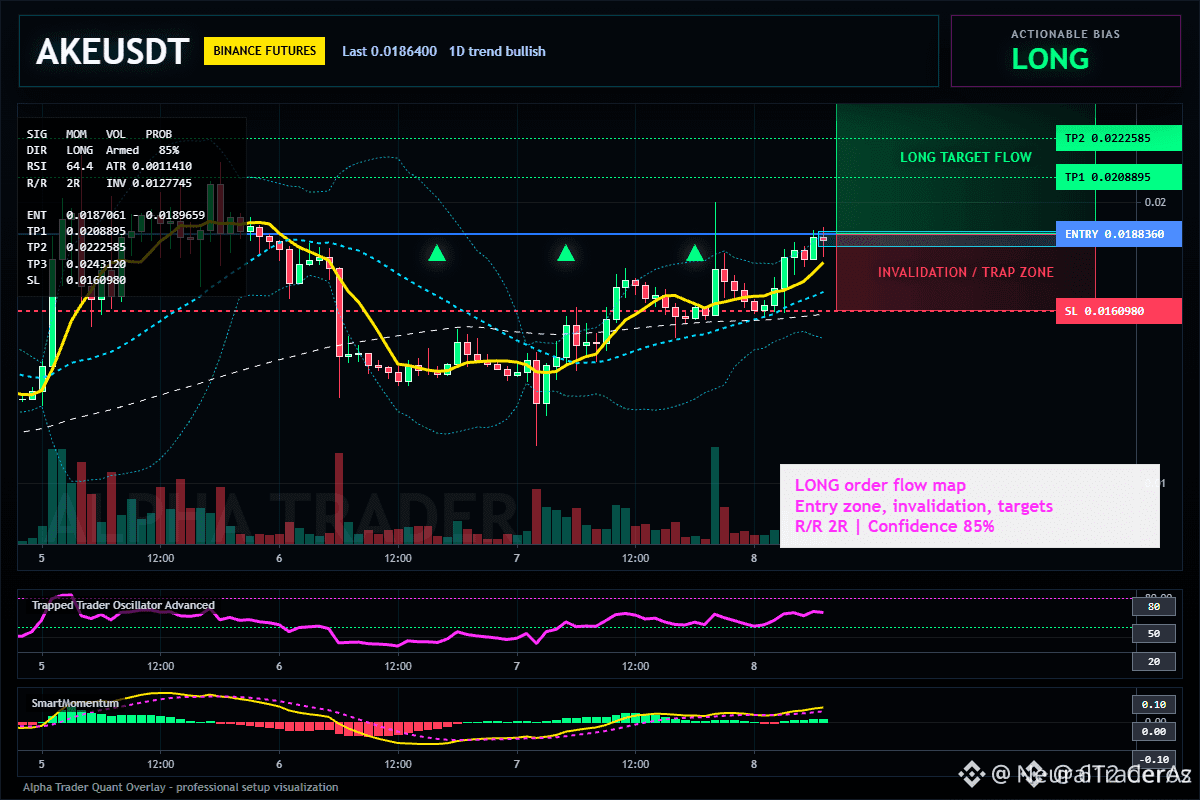
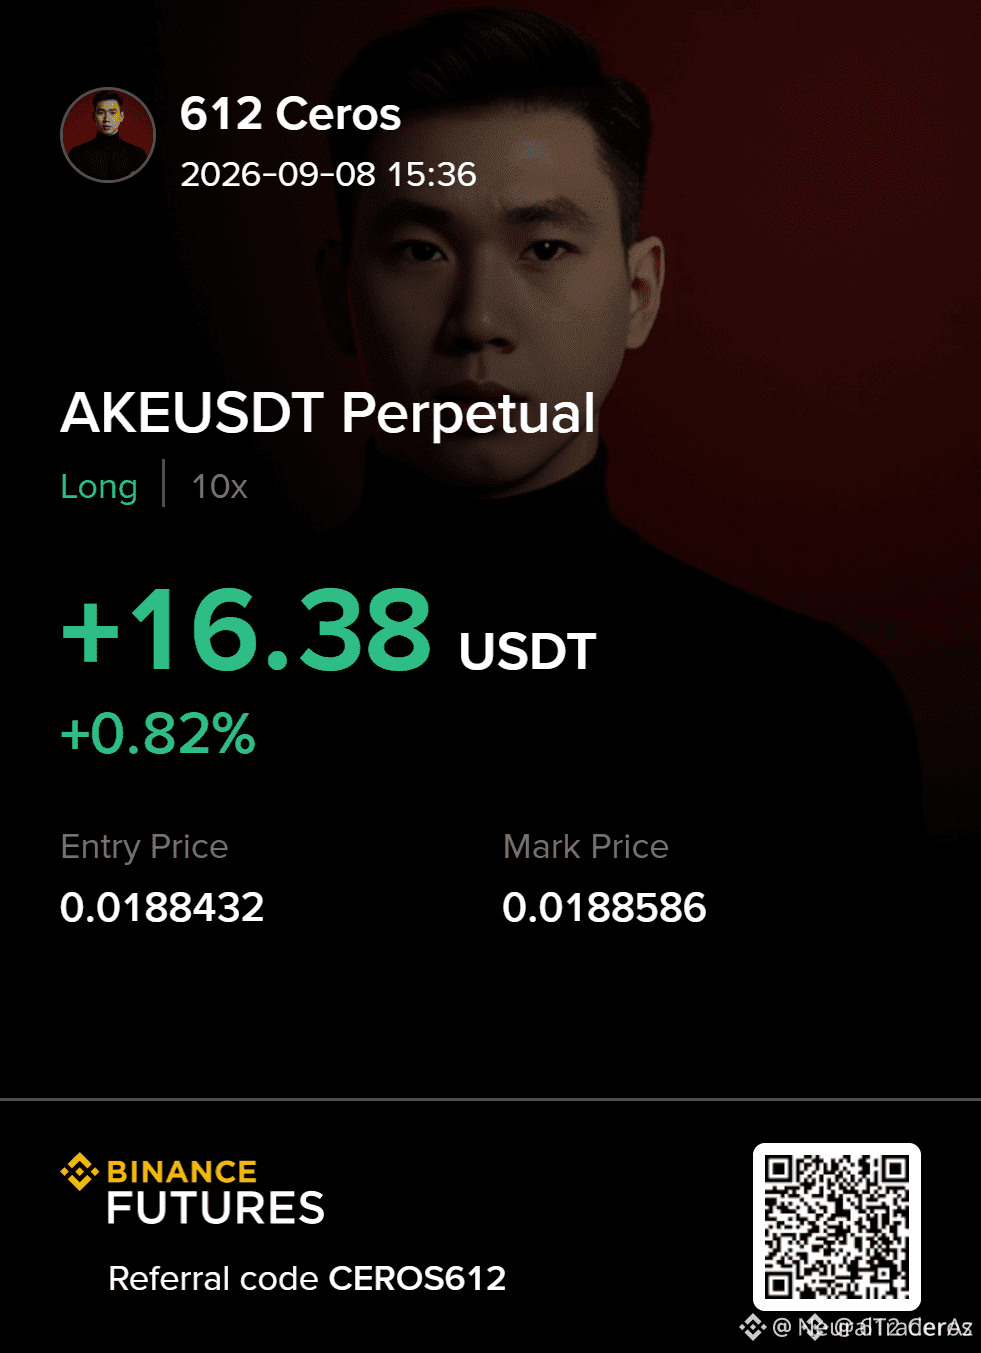
🚀 $AKE SURFACES FROM ATR SQUEEZE INTO BULLISH RAMPAGE! 🟢
Entry: 0.0187061-0.0189659 🟢
Target: 0.0208895 🚀
Target: 0.0222585 🚀
Target: 0.0243120 🚀
Stop Loss: 0.0160980 ⚠️
The 1‑hour ATR is compressing at 0.001141, a classic prelude to a volatility explosion that aligns with the daily bullish bias. 📊 The price is nesting in a tight 0.0187061‑0.0189659 entry window, while the 15‑minute RSI sits at 64.4, giving the long side ample headroom before hitting overbought territory. ⚡ Smart money is likely stacking liquidity above the zone; each upward tick fills the demand block, priming the next leg toward TP1 at 0.0208895 and beyond. 🌊 💬 How far do you think the swing can stretch before the hard stop at 0.0160980 forces a re‑entry? 👇
⚠️ Not financial advice. Always manage your risk. 🛡️
🏷️ #AKE #LongSetup #ATR #Crypto
🦈 🔥
30

·
--
Статья
📊 ATR (Average True Range): Aprende a medir la volatilidad del mercado# 📘 Trading desde Cero – Día 9/90
# 📊 ATR (Average True Range): Aprende a medir la volatilidad del mercado
Hasta ahora hemos aprendido a proteger el capital utilizando herramientas como el Stop Loss, el Take Profit, la Gestión del Riesgo y conceptos relacionados con el trading de futuros. Ahora conoceremos un indicador que puede ayudarte a entender mejor el comportamiento del precio: el ATR (Average True Range).
El ATR no indica si el mercado va a subir o bajar. Su función principal es medir la volatilidad, es decir, cuánto se mueve el precio durante un periodo determinado.
Comprender este indicador puede ayudarte a colocar un Stop Loss más adecuado y a evitar que una operación se cierre por movimientos normales del mercado.
## ¿Qué es el ATR?
El Average True Range (ATR) es un indicador desarrollado por J. Welles Wilder que mide el rango promedio de movimiento del precio durante un número determinado de velas.
En otras palabras, muestra cuánto suele moverse un activo, sin indicar la dirección de ese movimiento.
## ¿Cómo interpretar el ATR?
- 📈 ATR alto: el mercado presenta una mayor volatilidad y los movimientos del precio suelen ser más amplios.
- 📉 ATR bajo: el mercado tiene menor volatilidad y los movimientos suelen ser más reducidos.
Es importante recordar que un ATR alto no significa que el precio vaya a subir, ni un ATR bajo significa que vaya a bajar.
## Ejemplo práctico
Imagina que el ATR de un activo es 2 USDT.
Esto significa que, en promedio, el precio se mueve alrededor de 2 USDT durante el periodo analizado.
Si colocas un Stop Loss demasiado cerca del precio de entrada, es posible que una oscilación normal del mercado cierre tu operación antes de tiempo.
## ¿Para qué sirve?
✅ Medir la volatilidad del mercado.
✅ Ajustar mejor el Stop Loss.
✅ Adaptar el tamaño de la posición al riesgo.
✅ Evitar decisiones basadas únicamente en las emociones.
## Errores comunes
❌ Pensar que el ATR predice la dirección del precio.
❌ Utilizar siempre el mismo Stop Loss sin considerar la volatilidad.
❌ Ignorar los cambios en el ATR cuando el mercado se vuelve más activo o más tranquilo.
## Buenas prácticas
- Utiliza el ATR como complemento de tu análisis.
- Combínalo con soportes, resistencias y la gestión del riesgo.
- Adapta tus niveles de Stop Loss según la volatilidad.
- No tomes decisiones utilizando únicamente un indicador.
## Conclusión
El ATR es una herramienta muy útil para comprender cómo se mueve el mercado.
No intenta predecir el futuro, sino ayudarte a adaptar tu estrategia a la volatilidad existente y gestionar mejor el riesgo de cada operación.
📘 En el Día 10/90 conoceremos el Patrón AMD (Acumulación, Manipulación y Distribución) y aprenderemos cómo muchos traders analizan la estructura del mercado.
---
## Pregunta:
🤔 ¿Crees que conocer la volatilidad del mercado puede ayudarte a colocar un Stop Loss más adecuado? ¿Por qué? 💬
#Trading #BinanceSquare #ATR #TradingEducation #TechnicalAnalysis
📊 ATR (Average True Range): Aprende a medir la volatilidad del mercado
# 📘 Trading desde Cero – Día 9/90
# 📊 ATR (Average True Range): Aprende a medir la volatilidad del mercado
Hasta ahora hemos aprendido a proteger el capital utilizando herramientas como el Stop Loss, el Take Profit, la Gestión del Riesgo y conceptos relacionados con el trading de futuros. Ahora conoceremos un indicador que puede ayudarte a entender mejor el comportamiento del precio: el ATR (Average True Range).
El ATR no indica si el mercado va a subir o bajar. Su función principal es medir la volatilidad, es decir, cuánto se mueve el precio durante un periodo determinado.
Comprender este indicador puede ayudarte a colocar un Stop Loss más adecuado y a evitar que una operación se cierre por movimientos normales del mercado.
## ¿Qué es el ATR?
El Average True Range (ATR) es un indicador desarrollado por J. Welles Wilder que mide el rango promedio de movimiento del precio durante un número determinado de velas.
En otras palabras, muestra cuánto suele moverse un activo, sin indicar la dirección de ese movimiento.
## ¿Cómo interpretar el ATR?
- 📈 ATR alto: el mercado presenta una mayor volatilidad y los movimientos del precio suelen ser más amplios.
- 📉 ATR bajo: el mercado tiene menor volatilidad y los movimientos suelen ser más reducidos.
Es importante recordar que un ATR alto no significa que el precio vaya a subir, ni un ATR bajo significa que vaya a bajar.
## Ejemplo práctico
Imagina que el ATR de un activo es 2 USDT.
Esto significa que, en promedio, el precio se mueve alrededor de 2 USDT durante el periodo analizado.
Si colocas un Stop Loss demasiado cerca del precio de entrada, es posible que una oscilación normal del mercado cierre tu operación antes de tiempo.
## ¿Para qué sirve?
✅ Medir la volatilidad del mercado.
✅ Ajustar mejor el Stop Loss.
✅ Adaptar el tamaño de la posición al riesgo.
✅ Evitar decisiones basadas únicamente en las emociones.
## Errores comunes
❌ Pensar que el ATR predice la dirección del precio.
❌ Utilizar siempre el mismo Stop Loss sin considerar la volatilidad.
❌ Ignorar los cambios en el ATR cuando el mercado se vuelve más activo o más tranquilo.
## Buenas prácticas
- Utiliza el ATR como complemento de tu análisis.
- Combínalo con soportes, resistencias y la gestión del riesgo.
- Adapta tus niveles de Stop Loss según la volatilidad.
- No tomes decisiones utilizando únicamente un indicador.
## Conclusión
El ATR es una herramienta muy útil para comprender cómo se mueve el mercado.
No intenta predecir el futuro, sino ayudarte a adaptar tu estrategia a la volatilidad existente y gestionar mejor el riesgo de cada operación.
📘 En el Día 10/90 conoceremos el Patrón AMD (Acumulación, Manipulación y Distribución) y aprenderemos cómo muchos traders analizan la estructura del mercado.
---
## Pregunta:
🤔 ¿Crees que conocer la volatilidad del mercado puede ayudarte a colocar un Stop Loss más adecuado? ¿Por qué? 💬
#Trading #BinanceSquare #ATR #TradingEducation #TechnicalAnalysis
1
22

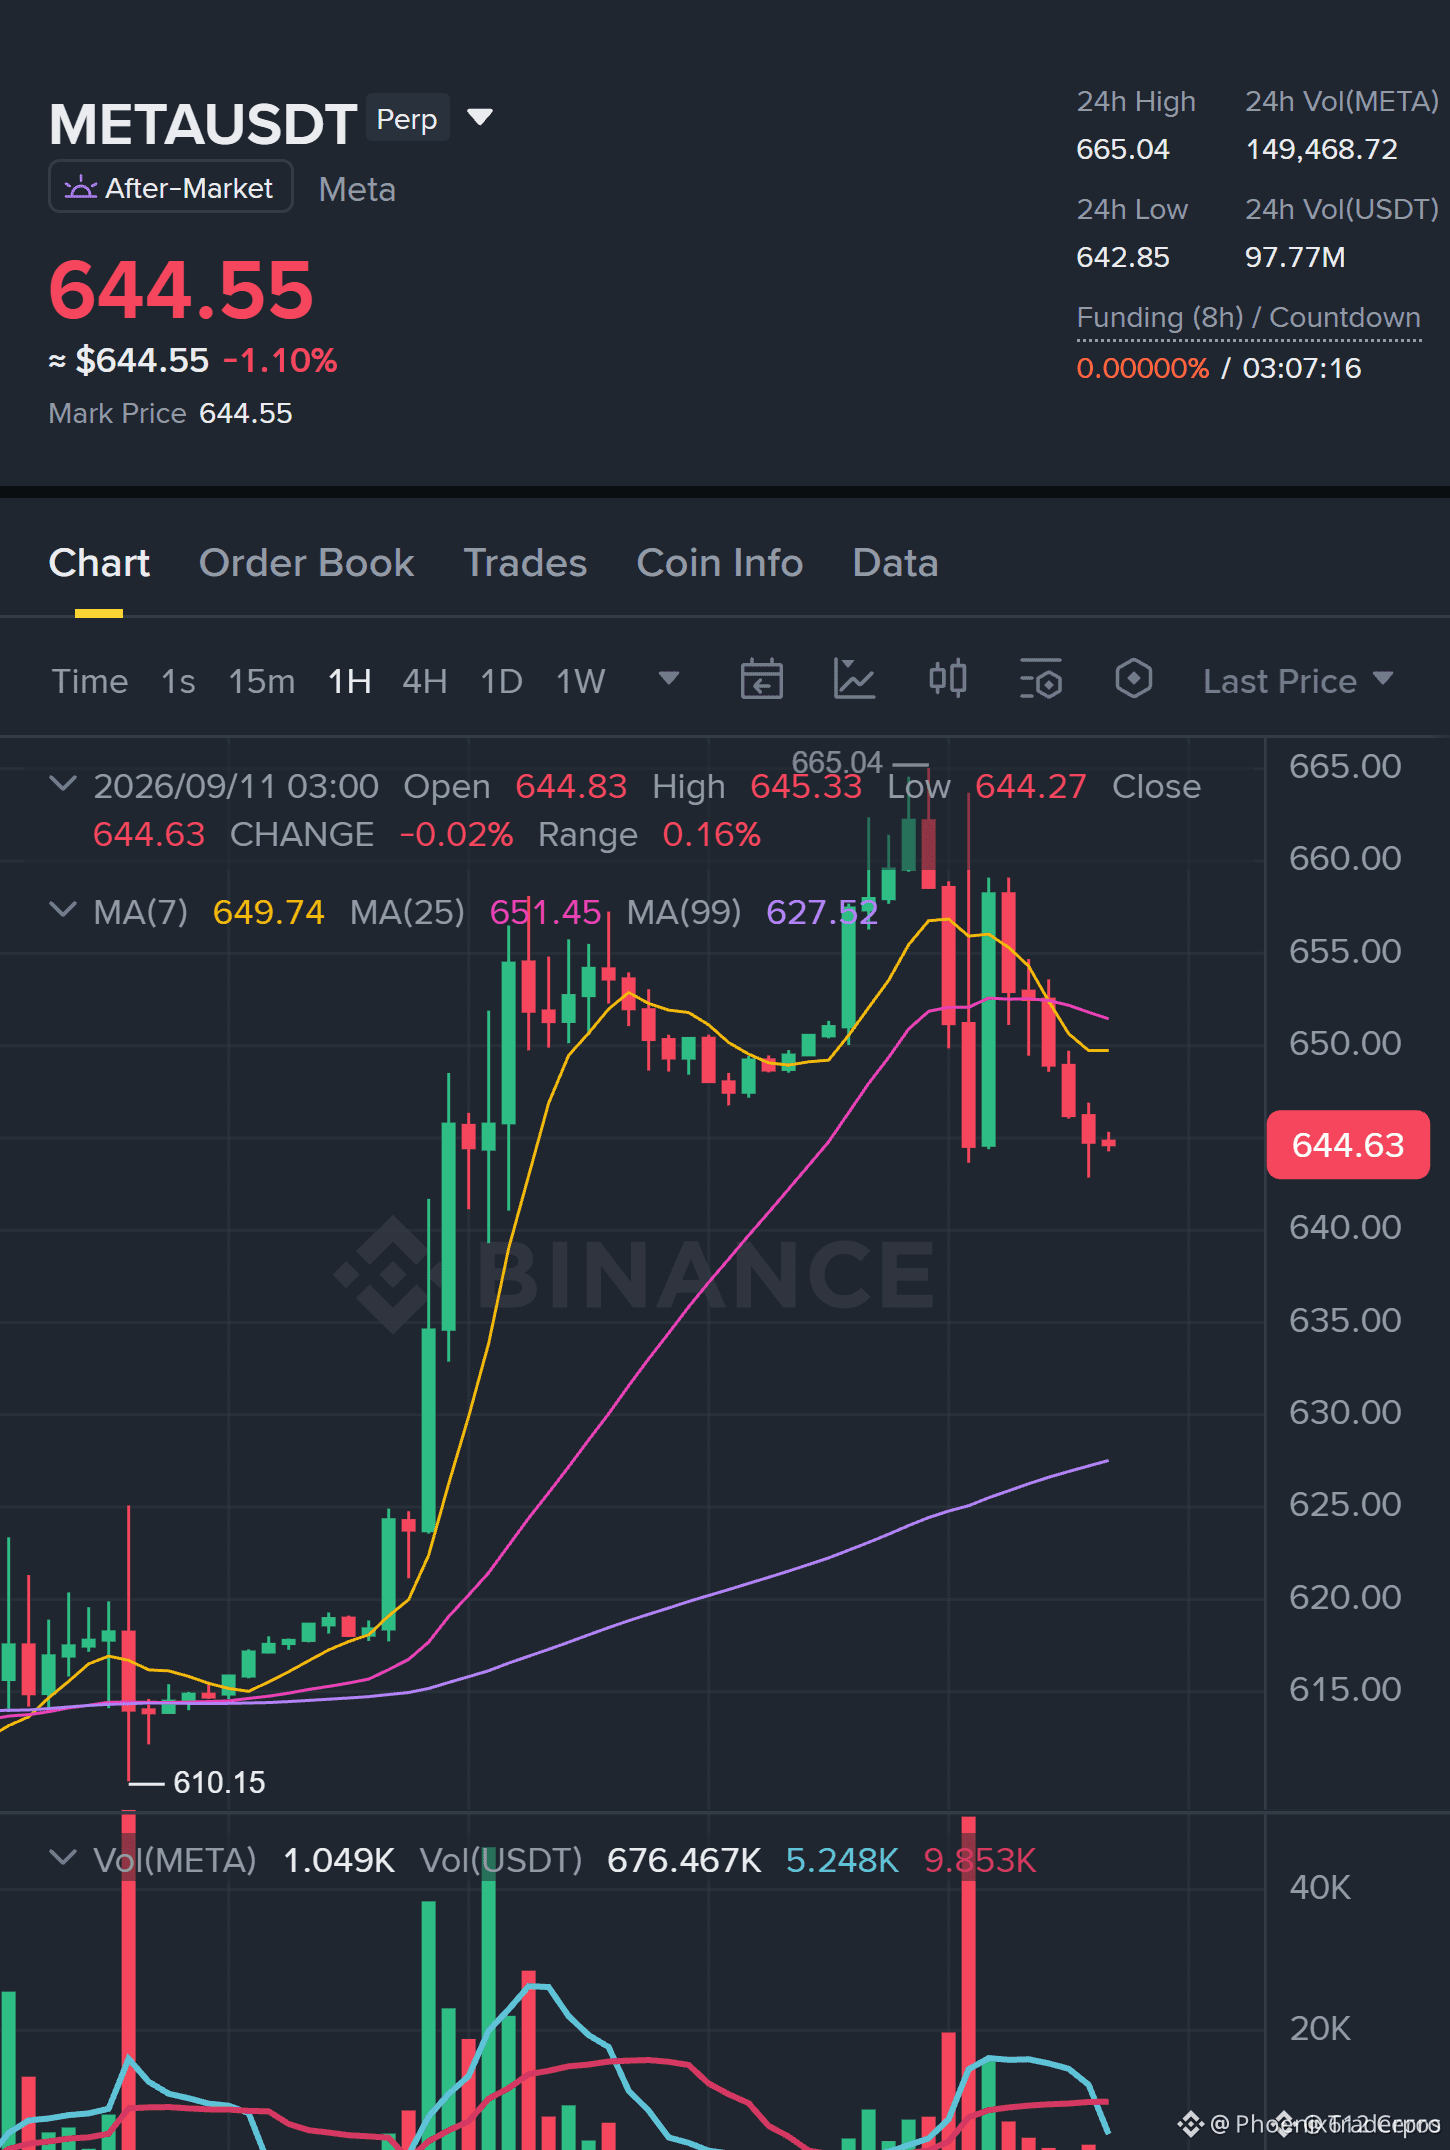
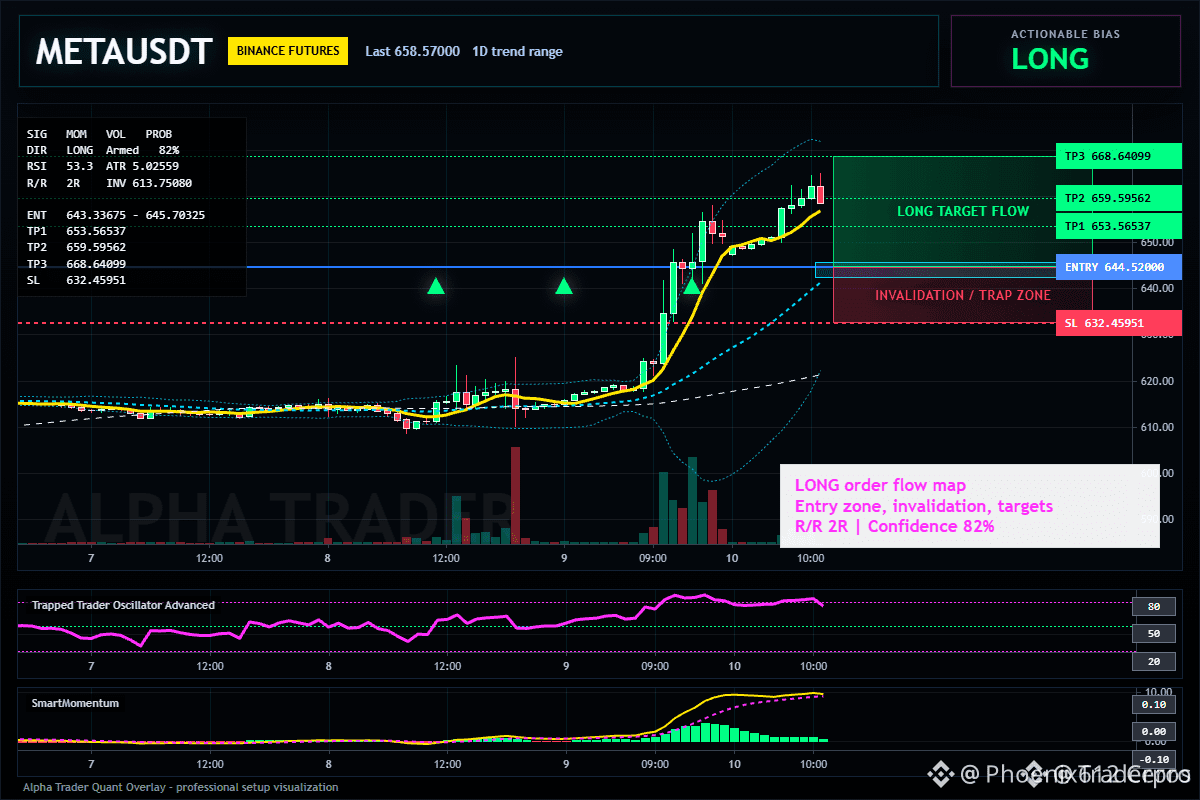
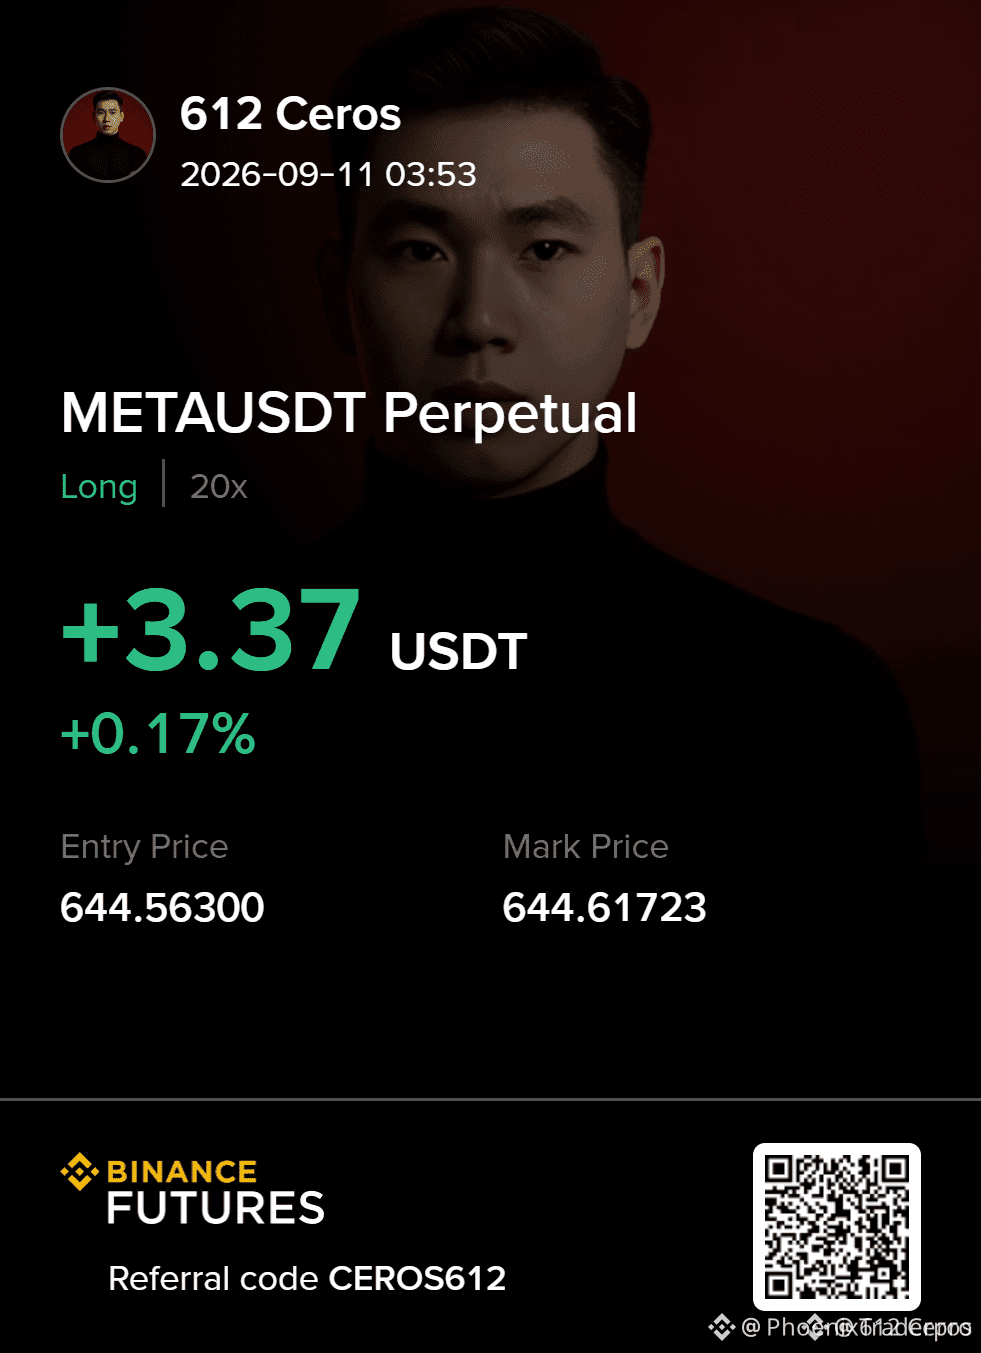
🚀 $META SURFING 1H ATR SPIKE INTO QUICK LONG 💥
Entry: 643.34-645.70 ⚡
Target: 653.56537 🚀
Stop Loss: 632.45951 ⚠️
📊 The 1‑hour ATR jumping to 5.02 is a clear liquidity beacon – smart‑money sharks are loading up as price hovers at 644.52. ⚡ RSI sits comfortably at 53 on the 15‑min, showing buyers still have steam left in the tank. 🦈
🗺️ The entry corridor between 643.34 and 645.70 lines up with the current price, priming a clean fill before the next leg rockets to TP1. The sand‑line at 613.75 guards the downside if the range collapses. 💬 Do you think the market will punch through to TP1 or trap the longs in a false breakout? 👇
⚠️ Not financial advice. Always manage your risk. 🛡️
🏷️ #META #LongSetup #ATR #Crypto
🔥 💎
17

·
--
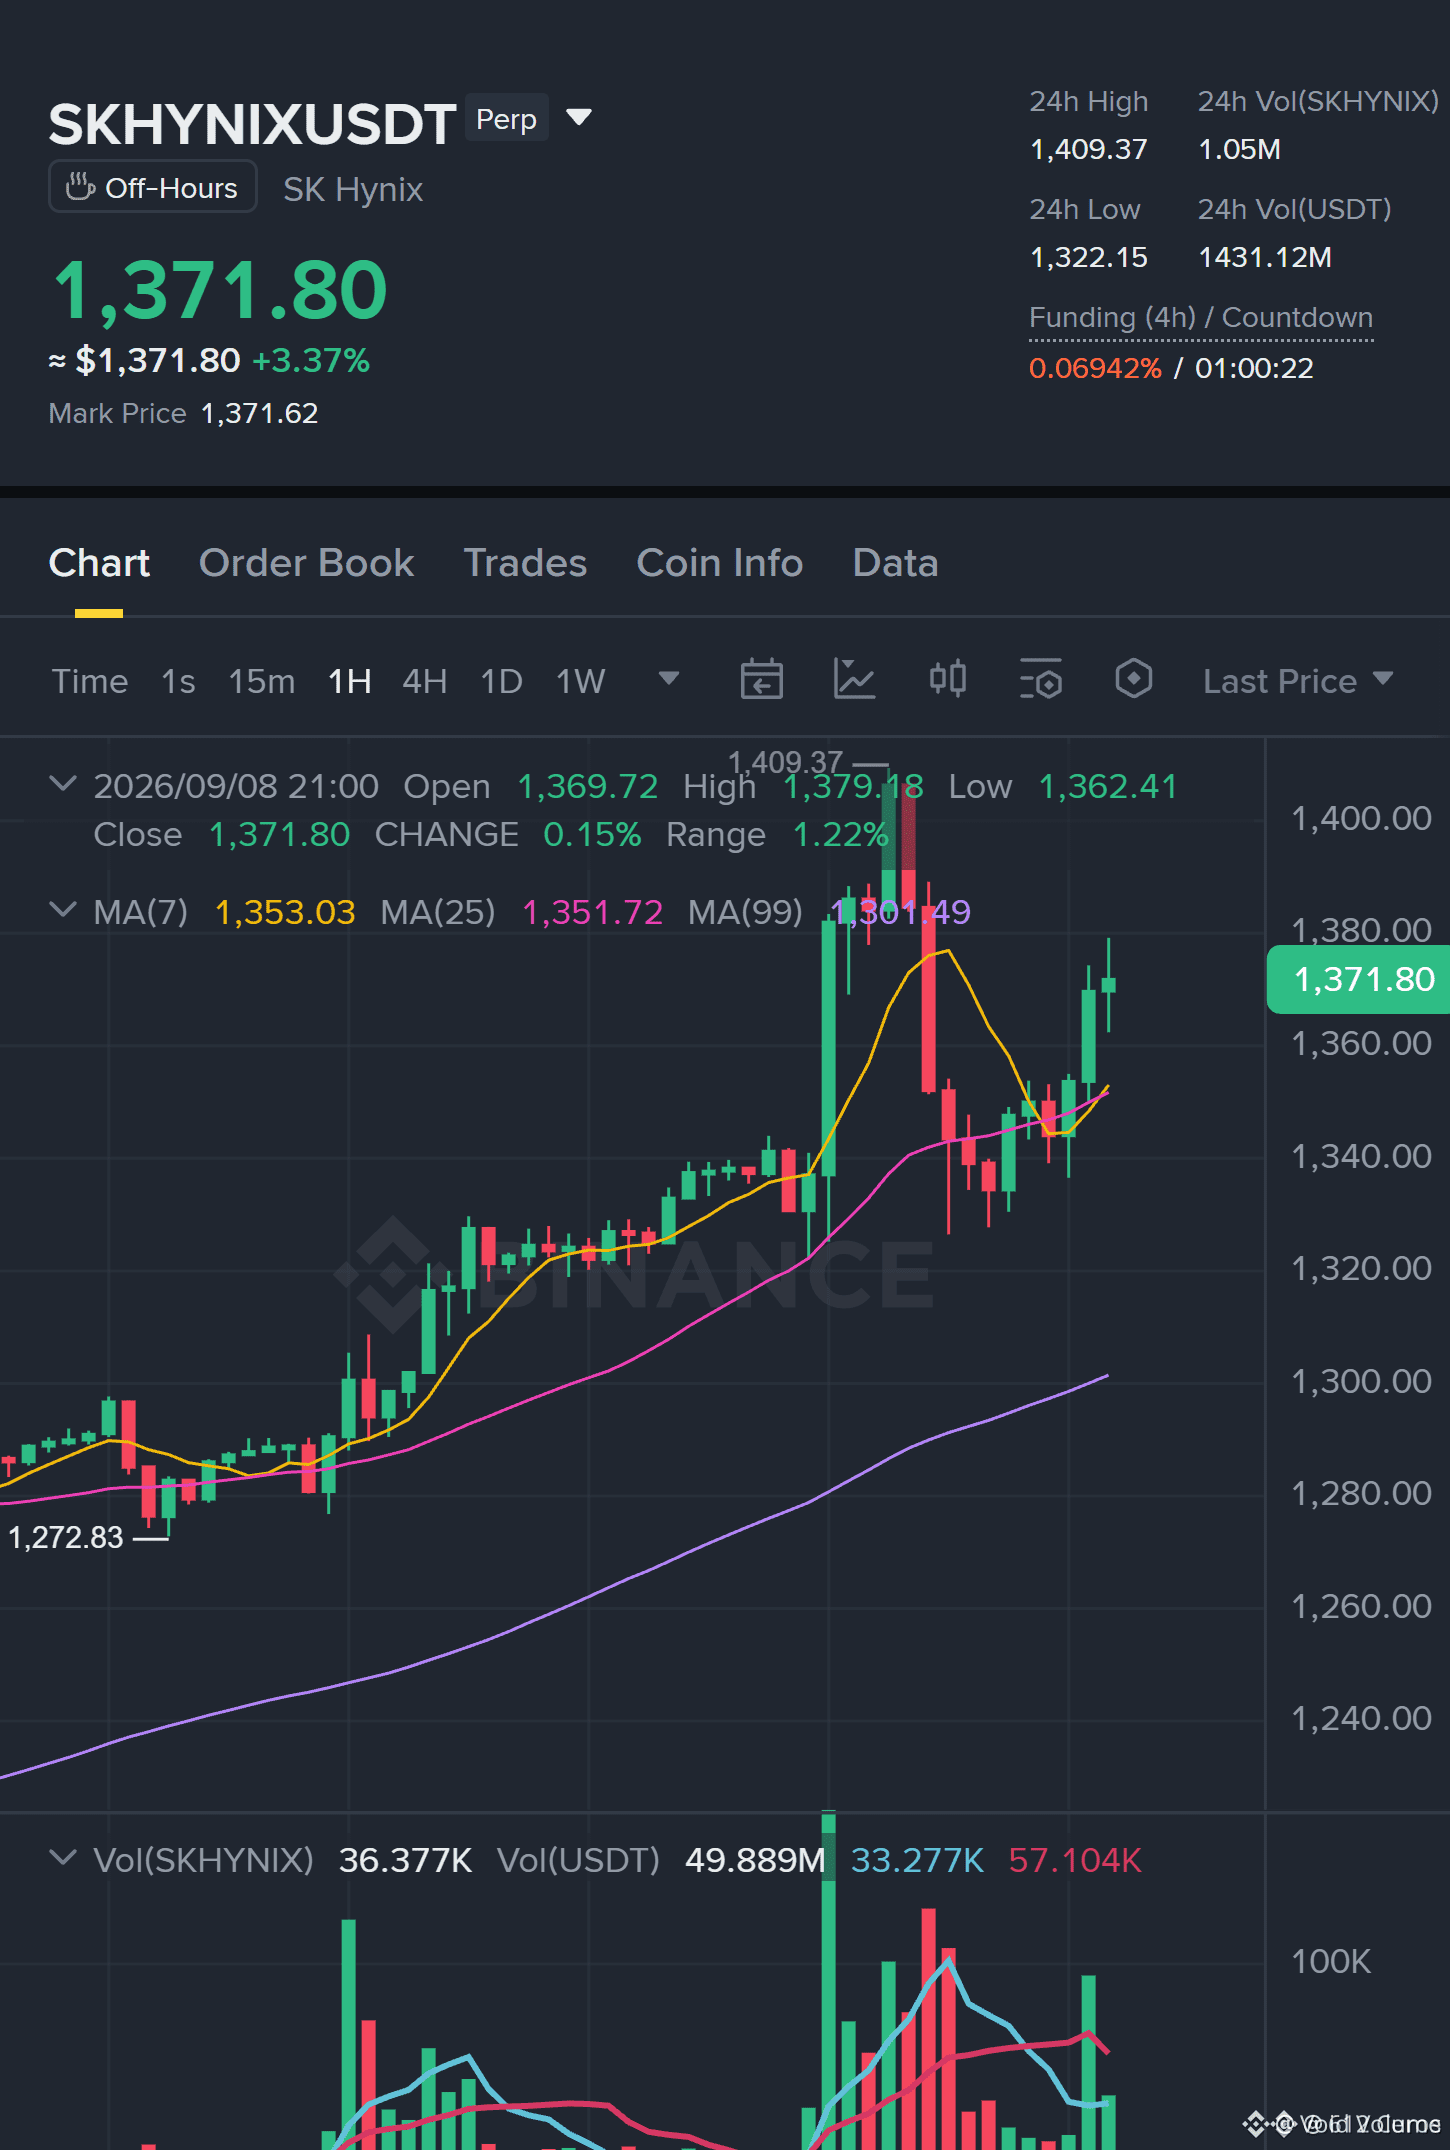
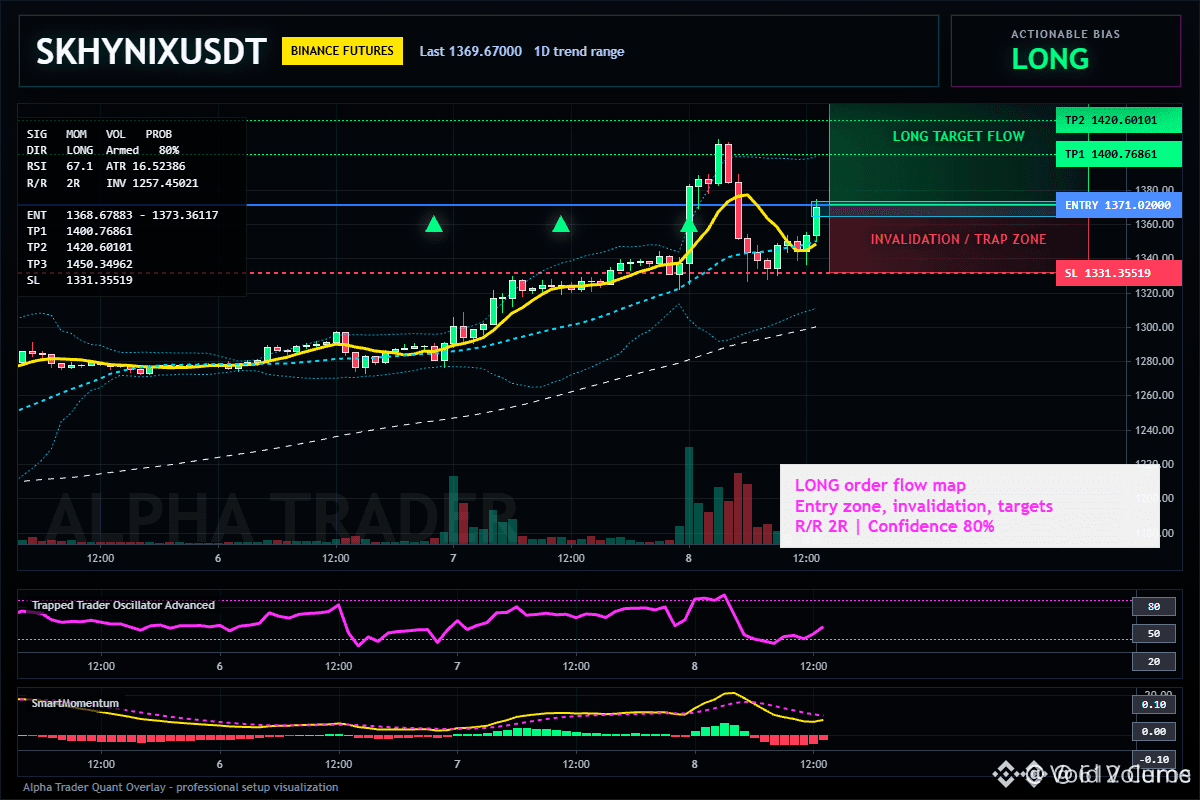
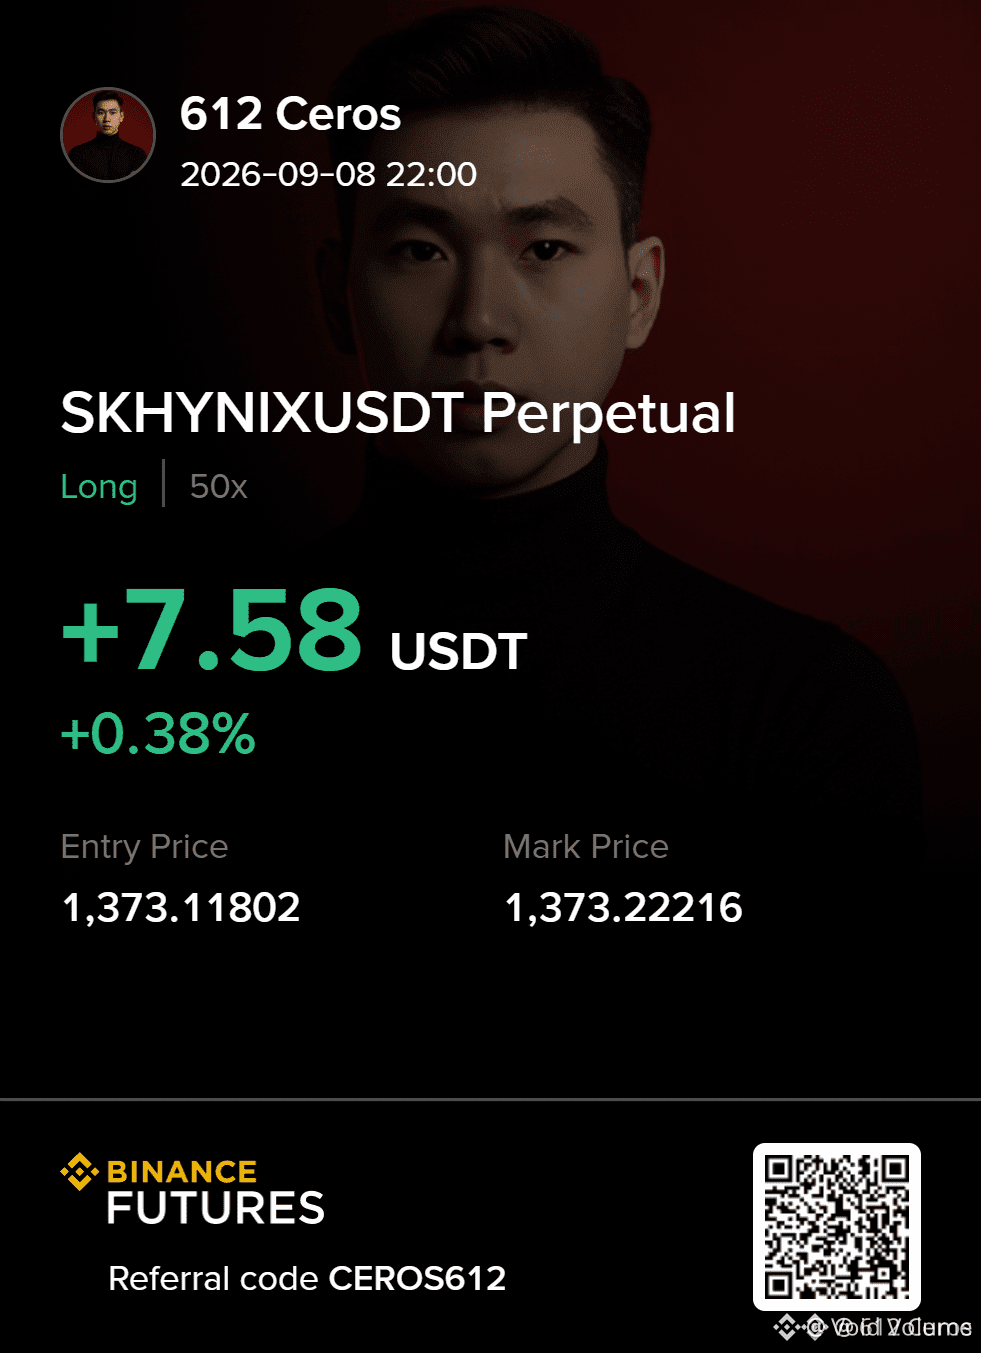
🚀 $SKHYNIX SURGES AS 1H ATR EXPANDS – LONG OPPORTUNITY 🟢
Entry: 1368.68-1373.36 ⚡
Target: 1400.77 🚀
Target: 1420.60 🚀
Target: 1450.35 🚀
Stop Loss: 1331.36 ⚠️
📊 The 1H ATR spiking to 16.52 signals real volatility awakening, nudging price out of the tight 1368‑1373 entry corridor. 📌 RSI on the 15M sits at 67, still climbing without hitting overbought, indicating institutional demand is building. 🌊 Daily range remains flat, but the line in the sand at 1257.45 holds the liquidity trap—break it and the bias stays intact. ⚡ Momentum is primed for a clean push toward TP1 and beyond.
💬 Will you ride the wave to TP2 or wait for a deeper confirmation? 👇
⚠️ Not financial advice. Always manage your risk. 🛡️
🏷️ #SKHYNIX #LongSetup #ATR #Crypto
🔥 💎
64

·
--
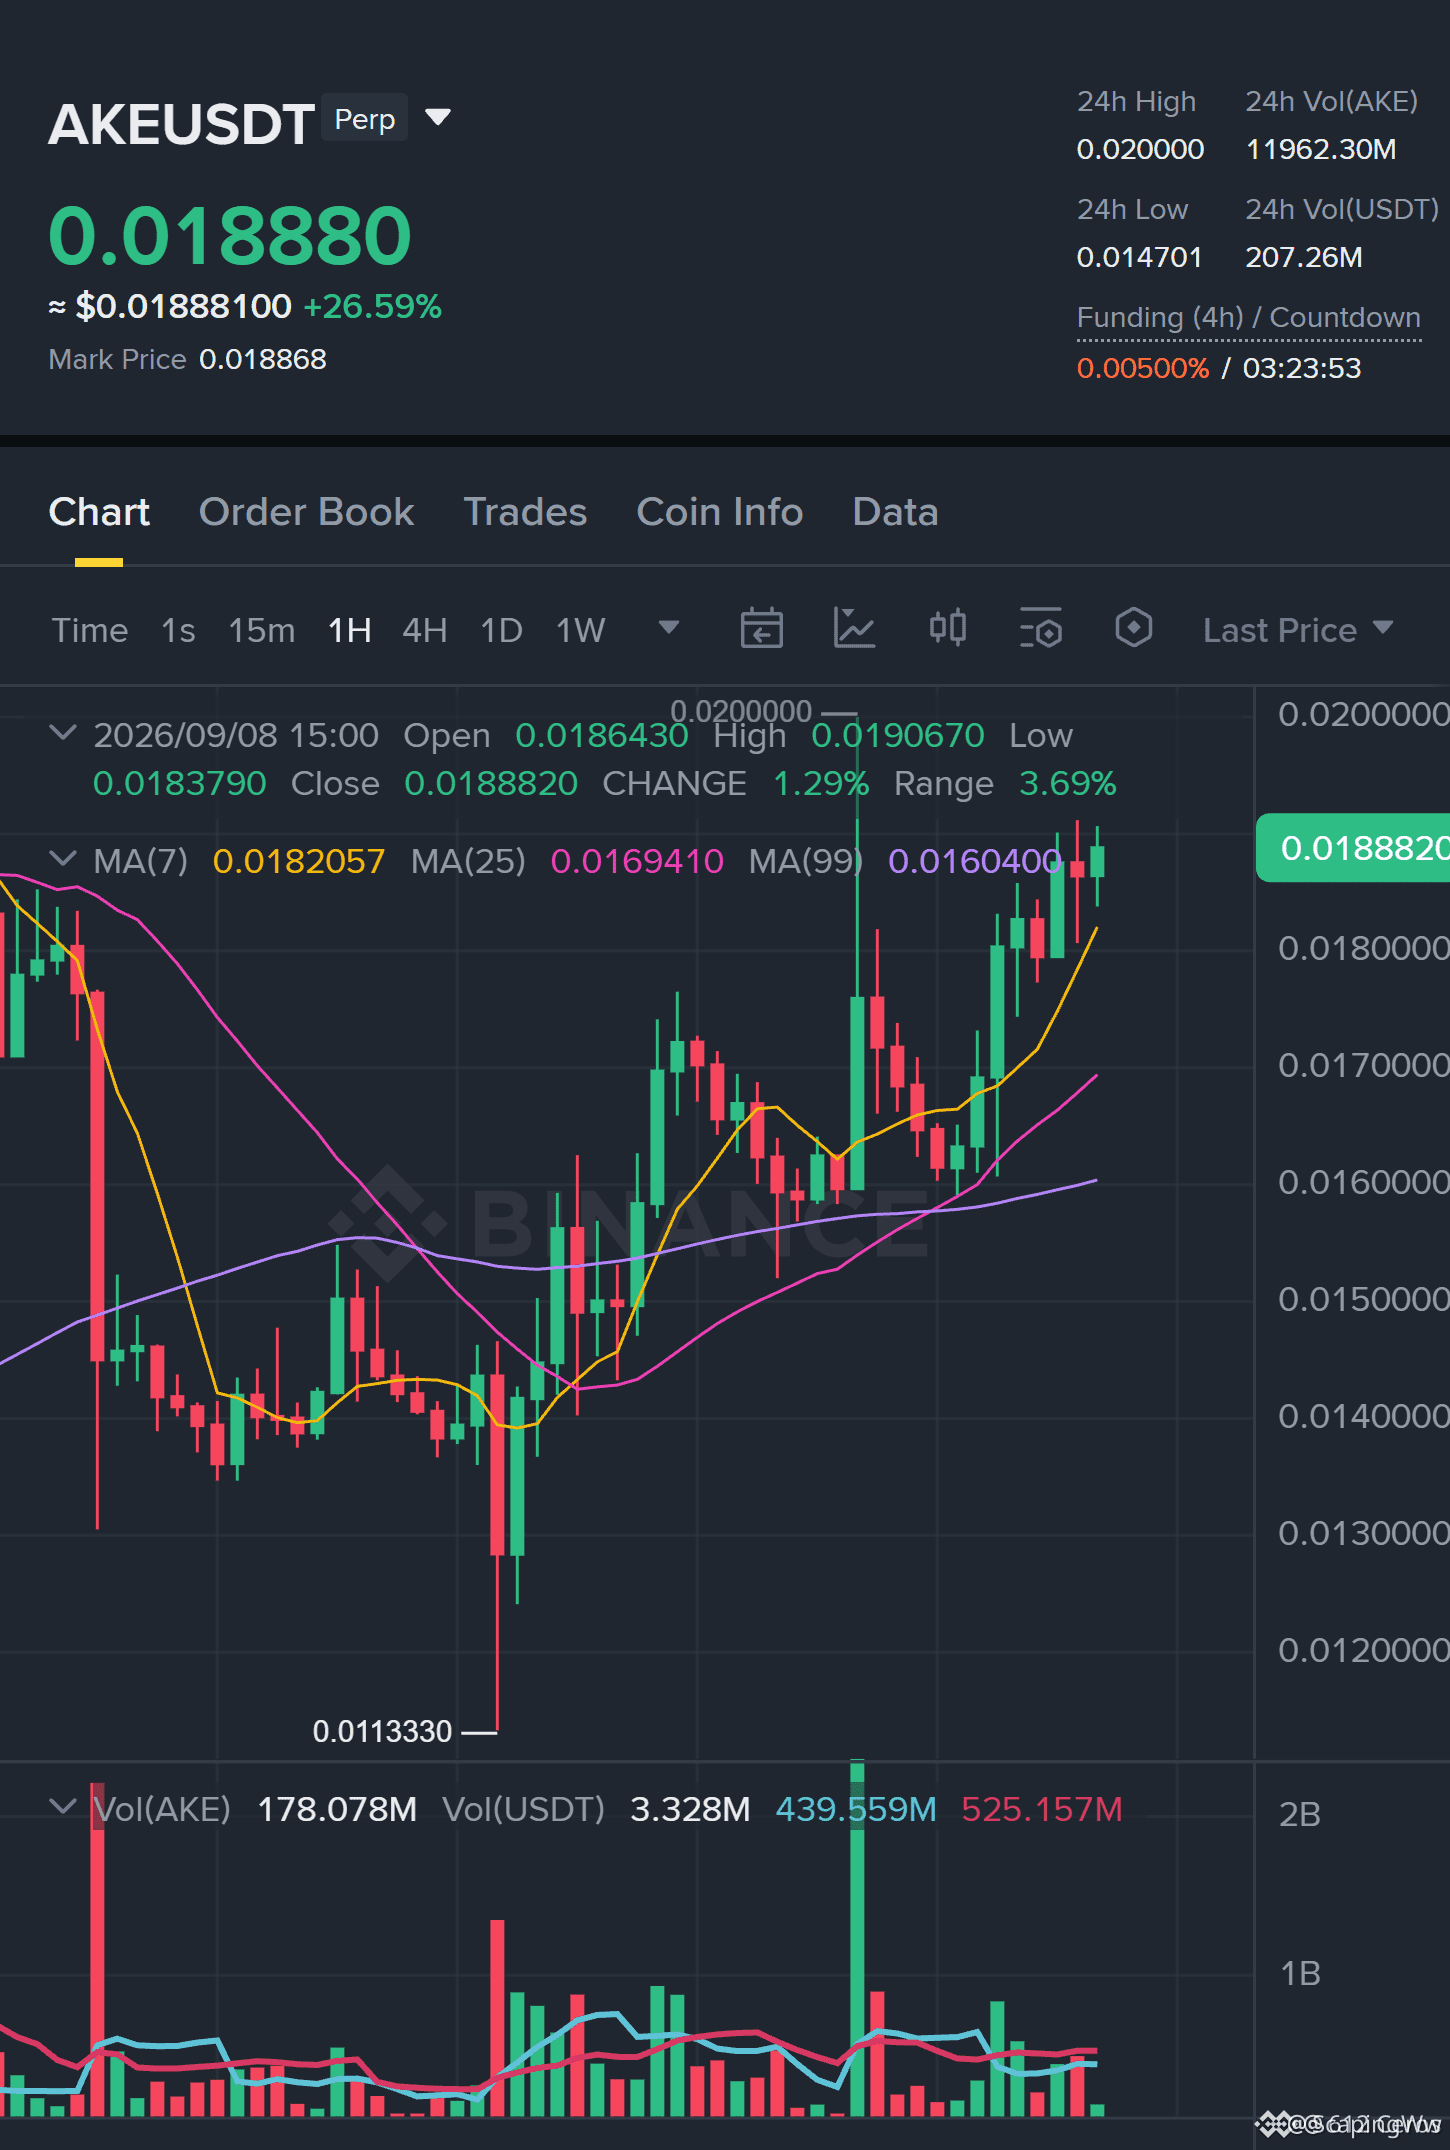
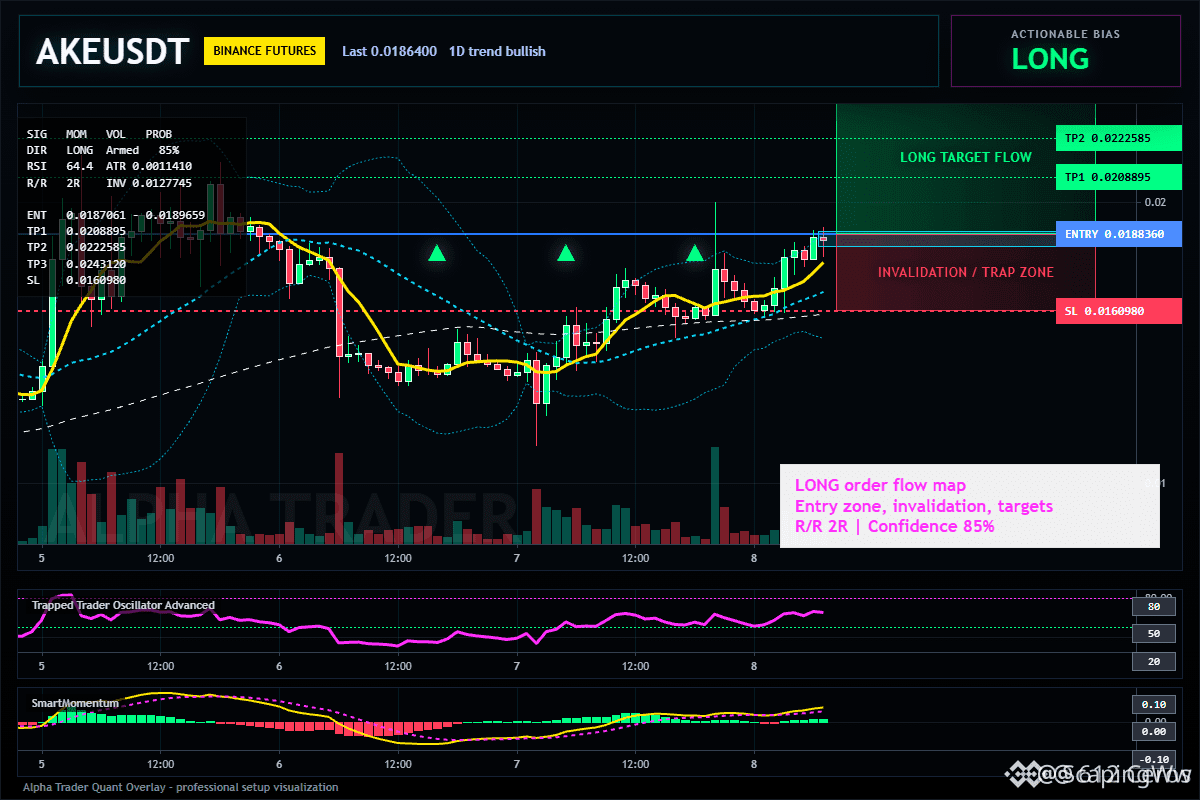
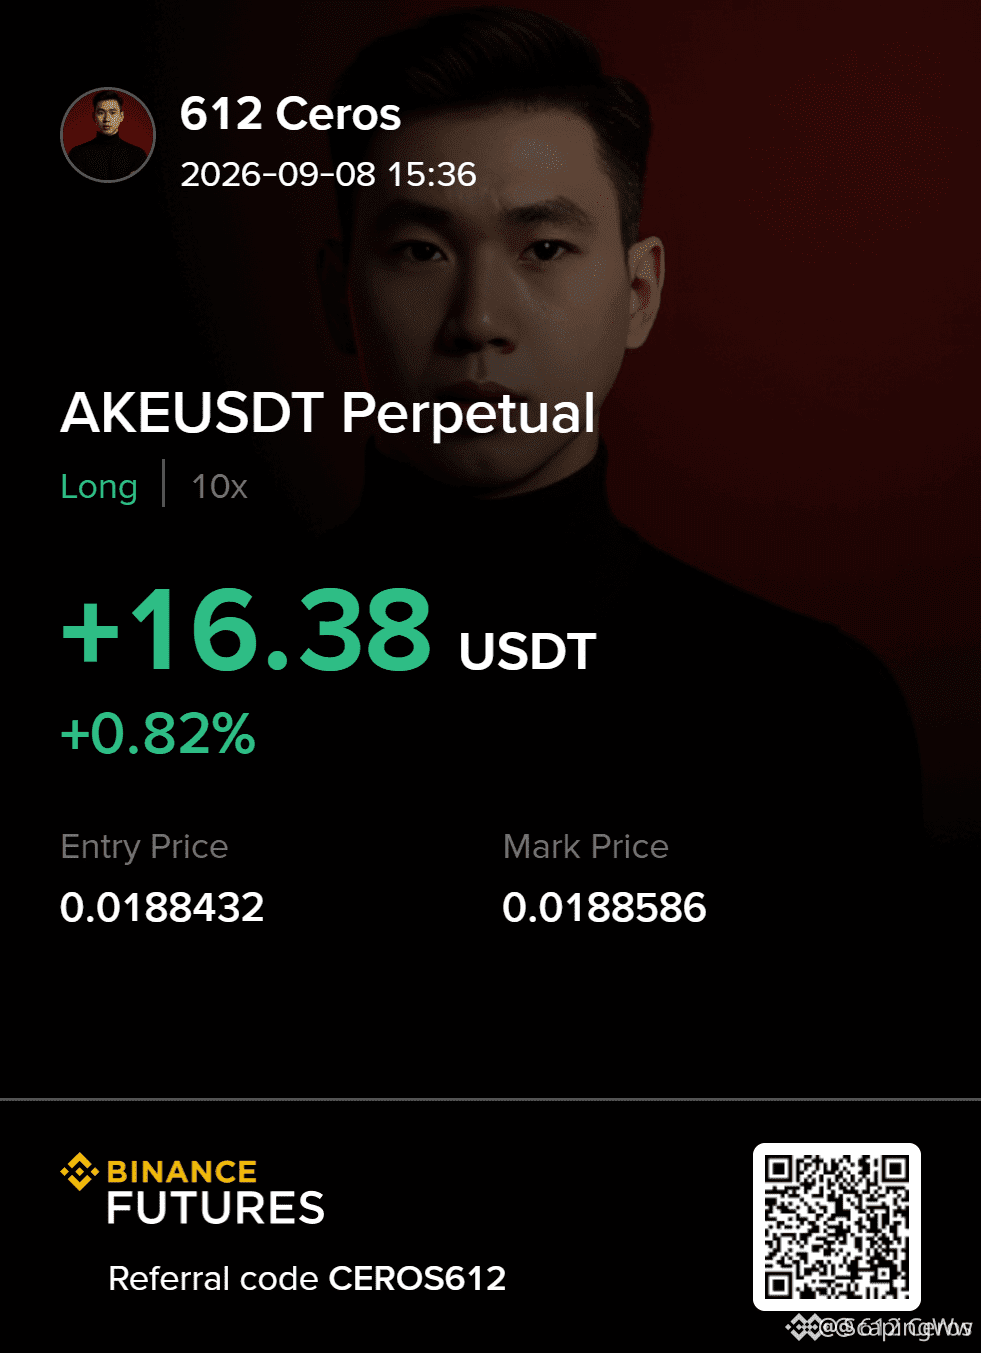
🚀 $AKE POISED FOR A SHARP VOL EXPANSION! 💎
Entry: 0.0187061‑0.0189659 ⚡
Target: 0.0208895 🚀
Stop Loss: 0.0160980 ⚠️
📊 The 1‑hour ATR is tightening like a spring, a classic prelude to a volatility burst that aligns with the daily bullish bias. ⚡ RSI on the 15‑minute chart sits at 64, giving the longs room to sprint without hitting overbought territory. 🌊 Buyers are already anchoring the zone, and each candle adds pressure to the liquidity wall below.
💡 With a clean risk‑to‑reward and three tiered targets, the play rewards disciplined sizing. 💬 Are you loading up for the first target or holding for the second wave? 👇
⚠️ Not financial advice. Always manage your risk. 🛡️
🏷️ #AKE #LongSetup #ATR #Crypto
🔥 💎
67

·
--
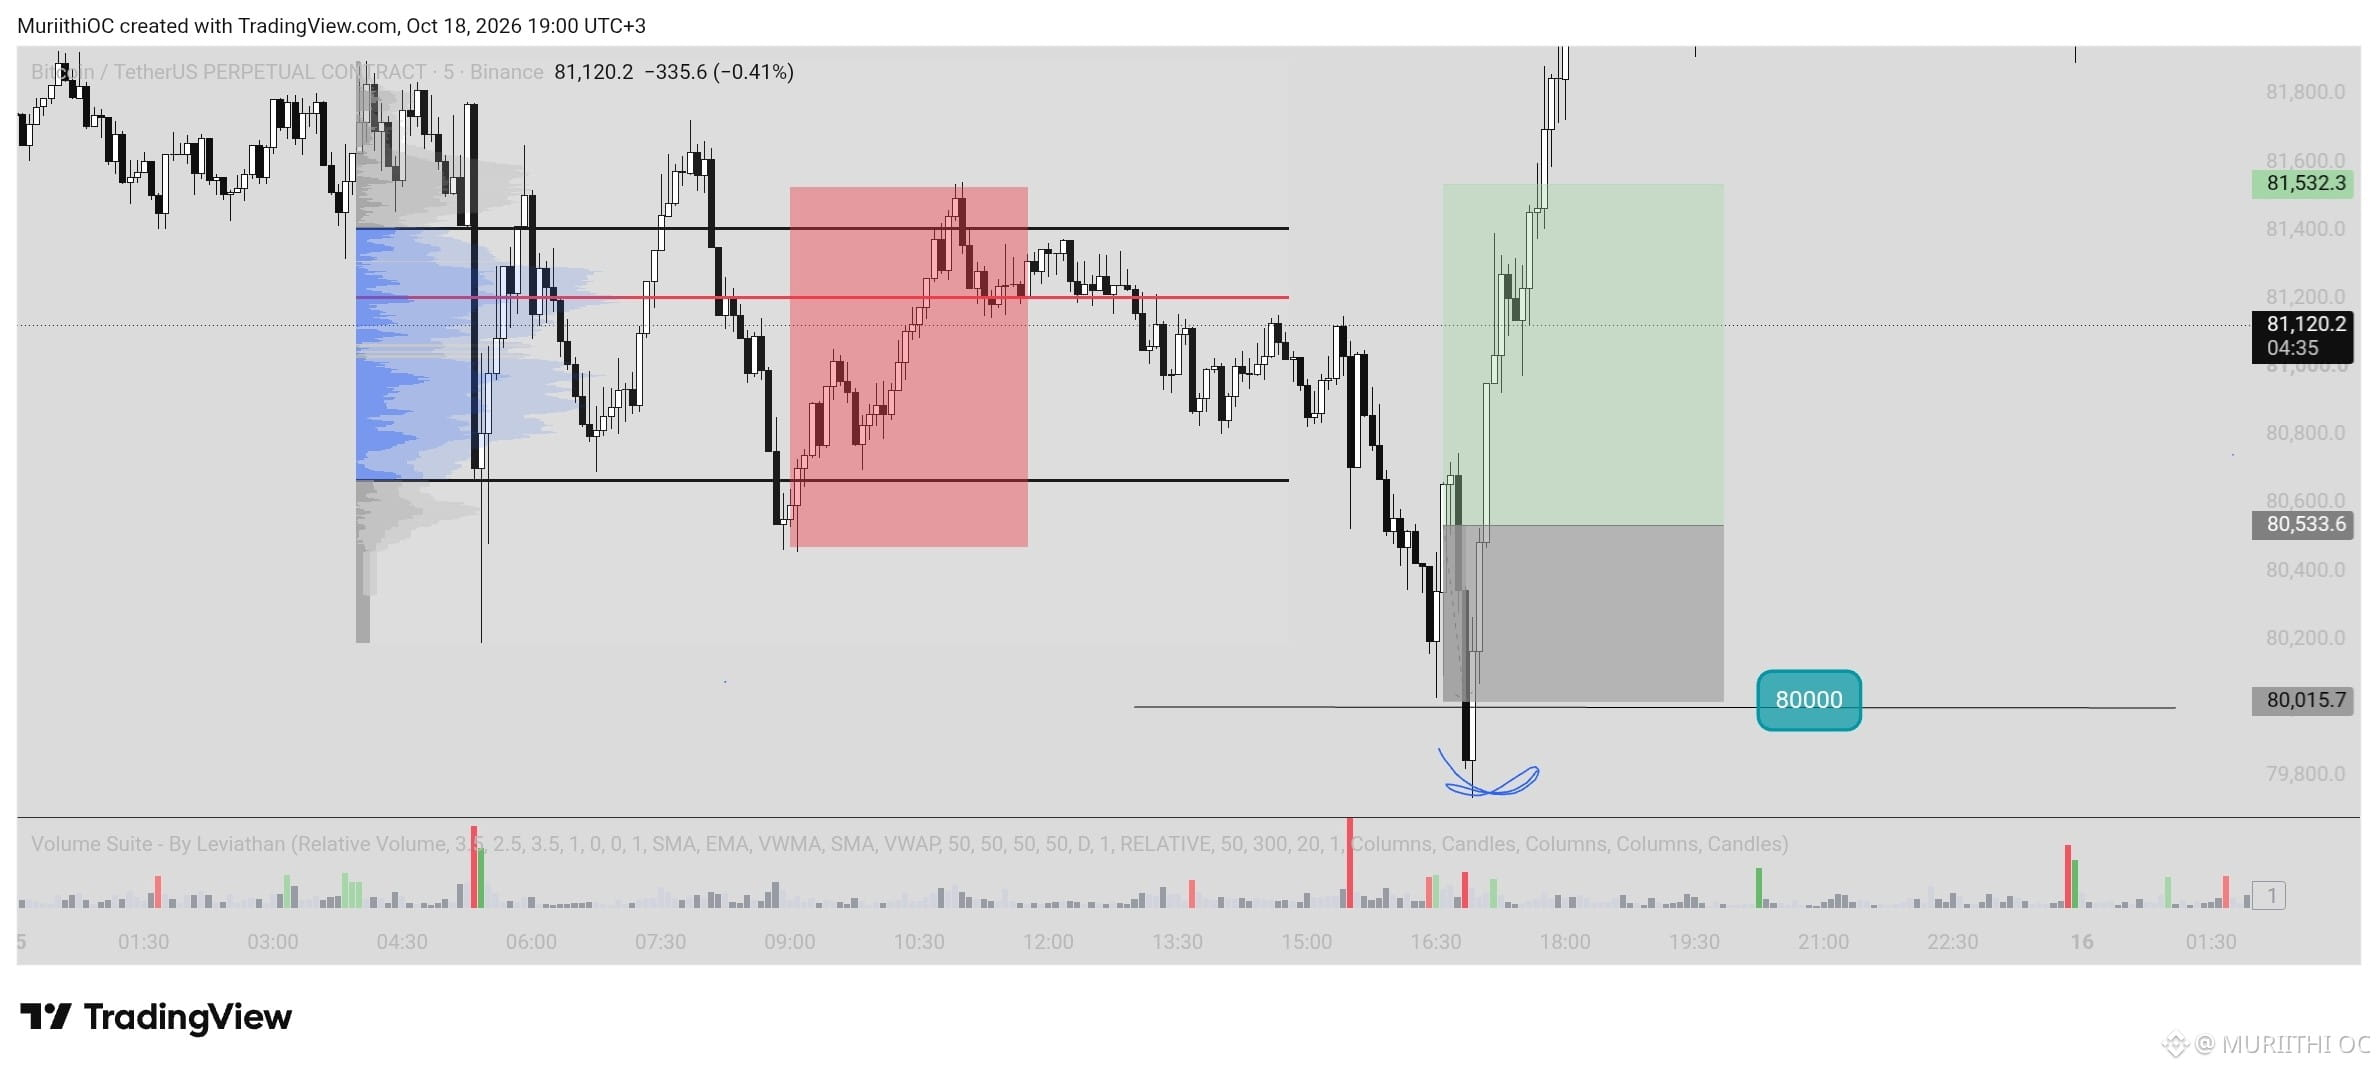
$BTC DON'T GET STOPPED OUT BEFORE RALLY.
I took a long on $BTC with a target at VAH.
Price reversed at my entry and stopped me out before TP rally.
What would have kept me in for the trade.
1. ROUND NUMBERS. $80,000 level is a magnet and holds a lot of
liquidity, consider a good buffer of 250-350 points.
2. ATR ( Average True range) average of the last 14 candles , in points.
#bitcoin $BTC #TradingLessons #Atr #RiskManagement
1
105

NEAR/USDT 1H Short Signal – ATR Tabanlı Seviyeler | NEAR/USDT 1H Short Signal – ATR-Based Levels
🇹🇷 TÜRKÇE
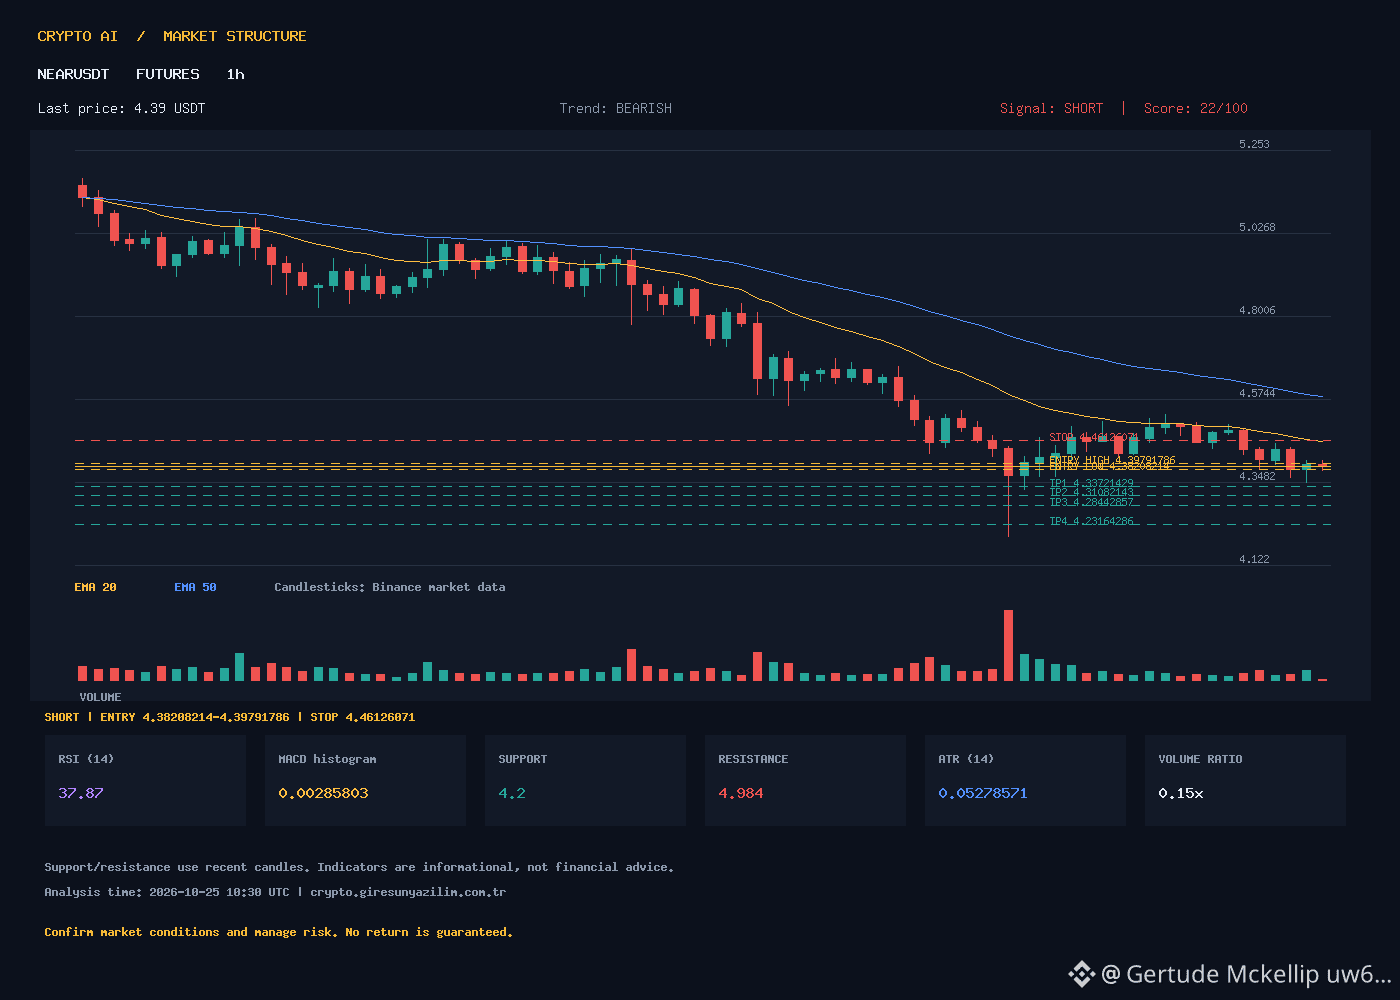
NEAR/USDT 1H kapanışta 4.39 fiyatı ile kısa vadeli sinyal **SHORT** yönünde. Trend BEARISH, skor 22, RSI 37.87 (durgun), EMA20 4.4573 > fiyat, EMA50 4.5794 > fiyat, EMA200 4.8295 > fiyat. MACD -0.0485, sinyal -0.0514, histogram küçük pozitif → hafif çelişki. ATR 0.0528, destek 4.2, direnç 4.984. Mevcut hacim 802.040 (ortalama 5.418M'nin %15'i) → zayıf alım satım.
**Kurulum Özeti:**
SHORT yönü, giriş aralığı 4.38208214‑4.39791786, stop loss 4.46126071, TP1 4.33721429, TP2 4.31082143, TP3 4.28442857, TP4 4.23164286. Bu seviyeler ATR tabanlı gösterge ama garanti değildir.
Piyasa yapıcıları ve hacim eğilimlerini takip ederken fiyat 4.2 desteğini koruyabilir mi, yoksa daha da düşebilir mi?
🇬🇧 ENGLISH
NEAR/USDT 1H closes at 4.39 with a **SHORT** signal. Trend is BEARISH, score 22, RSI 37.87 (neutral), EMA20 4.4573 > price, EMA50 4.5794 > price, EMA200 4.8295 > price. MACD -0.0485, signal -0.0514, histogram slightly positive → minor conflict. ATR 0.0528, support 4.2, resistance 4.984. Current volume 802,040 (15% of average 5.418M) indicates weak participation.
**Compact Setup Summary:**
SHORT | Entry 4.38208214‑4.39791786 | SL 4.46126071 | TP1 4.33721429 | TP2 4.31082143 | TP3 4.28442857 | TP4 4.23164286. Levels are ATR‑based scenarios, not guaranteed outcomes.
Watch for market makers and volume trends. Will price respect the 4.2 support or break further?
#NEAR #NEARUSDT #BinanceFutures #CryptoTechnicalAnalysis #ATR
8
JCTUSDT 1‑saat LONG sinyali | JCTUSDT 1‑hour LONG signal
🇹🇷 TÜRKÇE
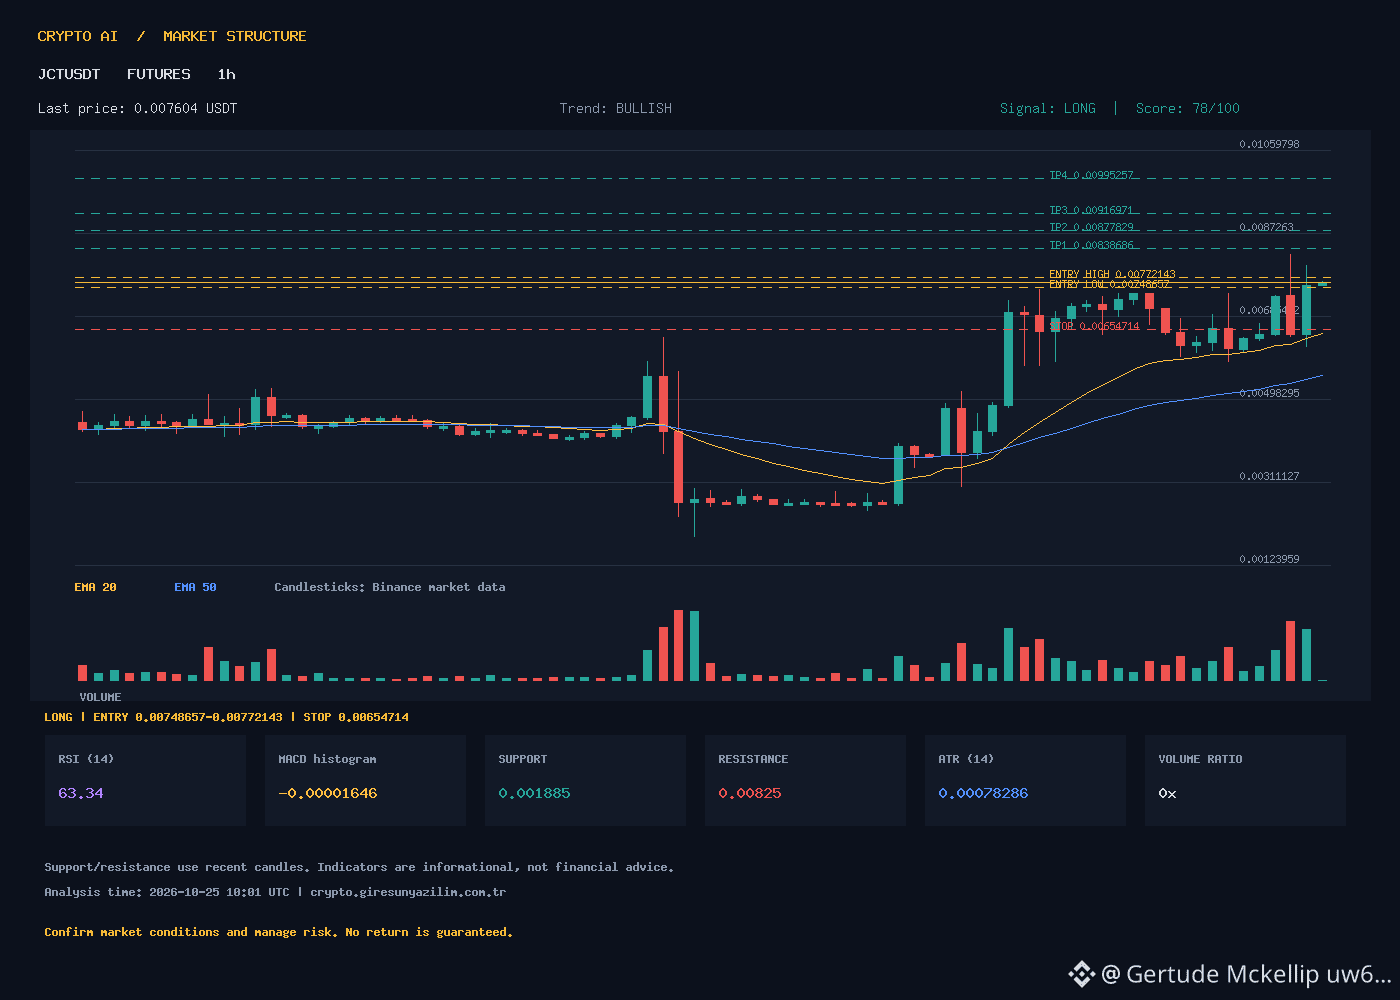
Signal: LONG, 1‑saat süresi. Mevcut fiyat 0.007604, trend BULLISH, score 78, RSI 63.34. EMA20 0.006458, EMA50 0.00549, EMA200 0.00375; fiyat EMA20 ve EMA50 üzerinde, bullish yönde. MACD 0.000610, signali 0.000627, histogram az negatif. ATR 0.00078286. Destek 0.001885, direnç 0.00825. Volume mevcut 14829017, ortalama 4102420233, düşük.
Trade plan (ATR temelli, kesin sonuç yok):
Giriş aralığı 0.00748657‑0.00772143, ortalama 0.007604.
Durdurma (stop‑loss) 0.00654714.
TP1 0.00838686, TP2 0.00877829, TP3 0.00916971, TP4 0.00995257.
Soru: Fiyat EMA20 üzer kalırsa bullish perspektif ne zaman sarsılır?
🇬🇧 ENGLISH
Signal: LONG, 1‑hour timeframe. Current price 0.007604, trend BULLISH, score 78, RSI 63.34. EMA20 0.006458, EMA50 0.00549, EMA200 0.00375; price sits above EMA20 and EMA50, indicating bullish momentum. MACD 0.000610, signal 0.000627, slight negative histogram. ATR 0.00078286. Support 0.001885, resistance 0.00825. Volume current 14829017, average 4102420233, relatively low.
Trade plan (ATR‑based illustrative levels, not guaranteed):
Entry range 0.00748657‑0.00772143 (mid 0.007604). Stop‑loss 0.00654714. TP1 0.00838686, TP2 0.00877829, TP3 0.00916971, TP4 0.00995257.
Question: If the price holds above EMA20, can it reach the first target before the volume picks up?
#JCTUSDT #BinanceFutures #CryptoAnalysis #LONG #ATR
4
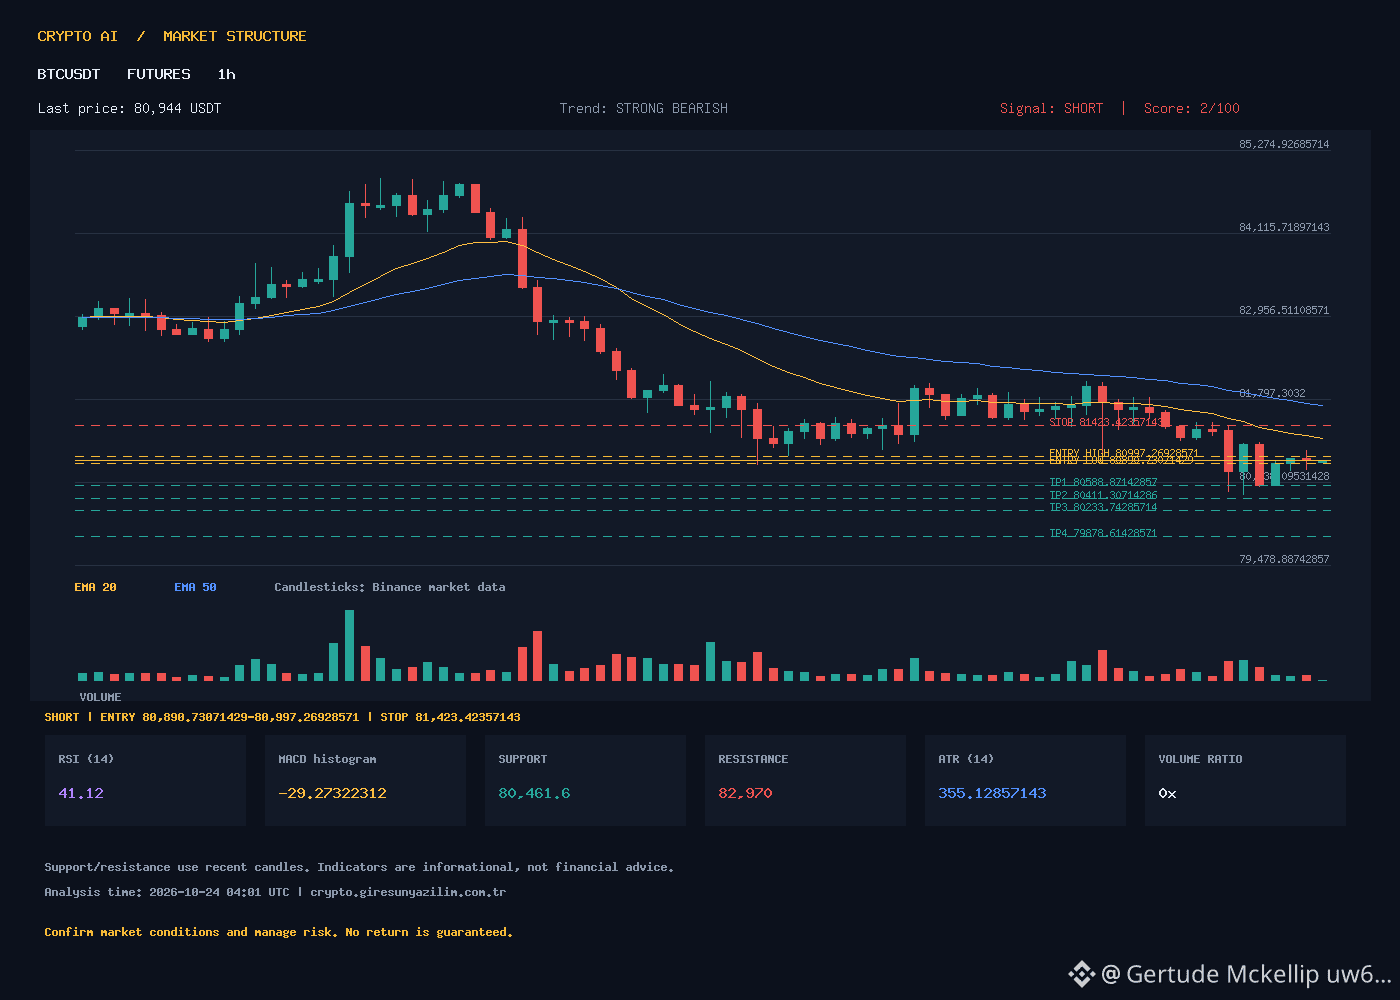
BTC/USDT 1‑saatlik SHORT sinyali | BTC/USDT 1‑hour SHORT signal
🇹🇷 TÜRKÇE
Signal: SHORT (1 saat) – Trend: STRONG BEARISH, score 2. Current price 80944, RSI 41.12. EMA20 81248.64, EMA50 81672.48, EMA200 81955.02. MACD –248.15 (negative), ATR 355.13, volume 0.909 (far below avg 4492.76). Support 80461.6, resistance 82970. Trade plan: direction SHORT, entry 80890.73071429‑80997.26928571, stop‑loss 81423.42357143, TP1 80588.87142857, TP2 80411.30714286, TP3 80233.74285714, TP4 79878.61428571. Bu seviyeler ATR‑tabanlı senaryodur, kesin bir tahmin değildir. Sizce ATR‑tabanlı hedefler gerçekten sarsılabilir mi?
🇬🇧 ENGLISH
Signal: SHORT (1‑hour) – Trend: STRONG BEARISH, score 2. Current price 80944, RSI 41.12. EMA20 81248.64, EMA50 81672.48, EMA200 81955.02. MACD –248.15 (negative), ATR 355.13, volume 0.909 (well below average 4492.76). Support 80461.6, resistance 82970. Trade plan: direction SHORT, entry 80890.73071429‑80997.26928571, stop‑loss 81423.42357143, TP1 80588.87142857, TP2 80411.30714286, TP3 80233.74285714, TP4 79878.61428571. These levels are illustrative ATR‑based scenarios, not guaranteed outcomes. Do you think the ATR targets could truly trigger a reversal?
#BTC #Binance #Futures #Short #ATR
1
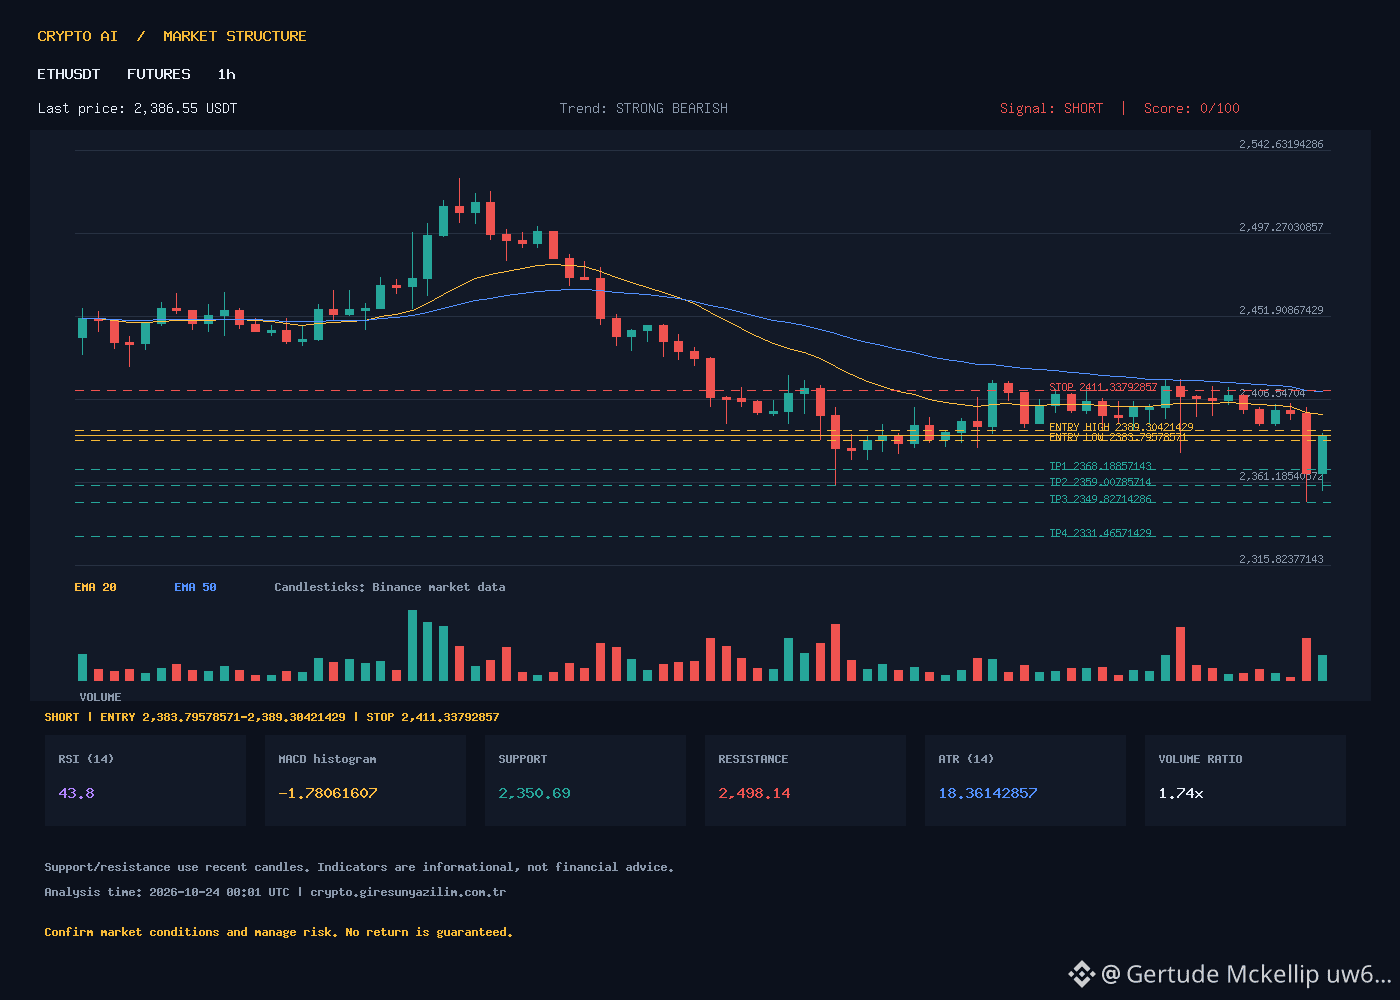
ETHUSDT 1 saatlik Kısa Sinyal | ETHUSDT 1 saatlik Short Signal
🇹🇷 TÜRKÇE
Signal: SHORT, timeframe 1 saat. Trend: STRONG BEARISH, score 0. Current price 2386.55, RSI 43.8, EMA20 2397.89, EMA50 2408.63, EMA200 2422.10, MACD -5.44, ATR 18.36, volume 167,883 (ratio 1.74), support 2350.69, resistance 2498.14.
Giriş aralığı 2383.79578571 - 2389.30421429, STOP-LOSS 2411.33792857, TP1 2368.18857143, TP2 2359.00785714, TP3 2349.82714286, TP4 2331.46571429. Bu seviyeler ATR temelli senaryodur, kesin bir tahmin değildir.
2350 desteği kırıldıysa daha düşük bir harekete yol açabilir miyiz?
🇬🇧 ENGLISH
Signal: SHORT, timeframe 1 hour. Trend: STRONG BEARISH, score 0. Current price 2386.55, RSI 43.8, EMA20 2397.89, EMA50 2408.63, EMA200 2422.10, MACD -5.44, ATR 18.36, volume 167,883 (ratio 1.74), support 2350.69, resistance 2498.14.
Entry range 2383.79578571 - 2389.30421429, STOP-LOSS 2411.33792857, TP1 2368.18857143, TP2 2359.00785714, TP3 2349.82714286, TP4 2331.46571429. These levels are ATR‑based illustrative, not guaranteed outcomes.
If price breaks below 2350 support, could it lead to further downside?
#ETHUSDT #BinanceFutures #KısaSinyal #ATR #CryptoAnaliz
55
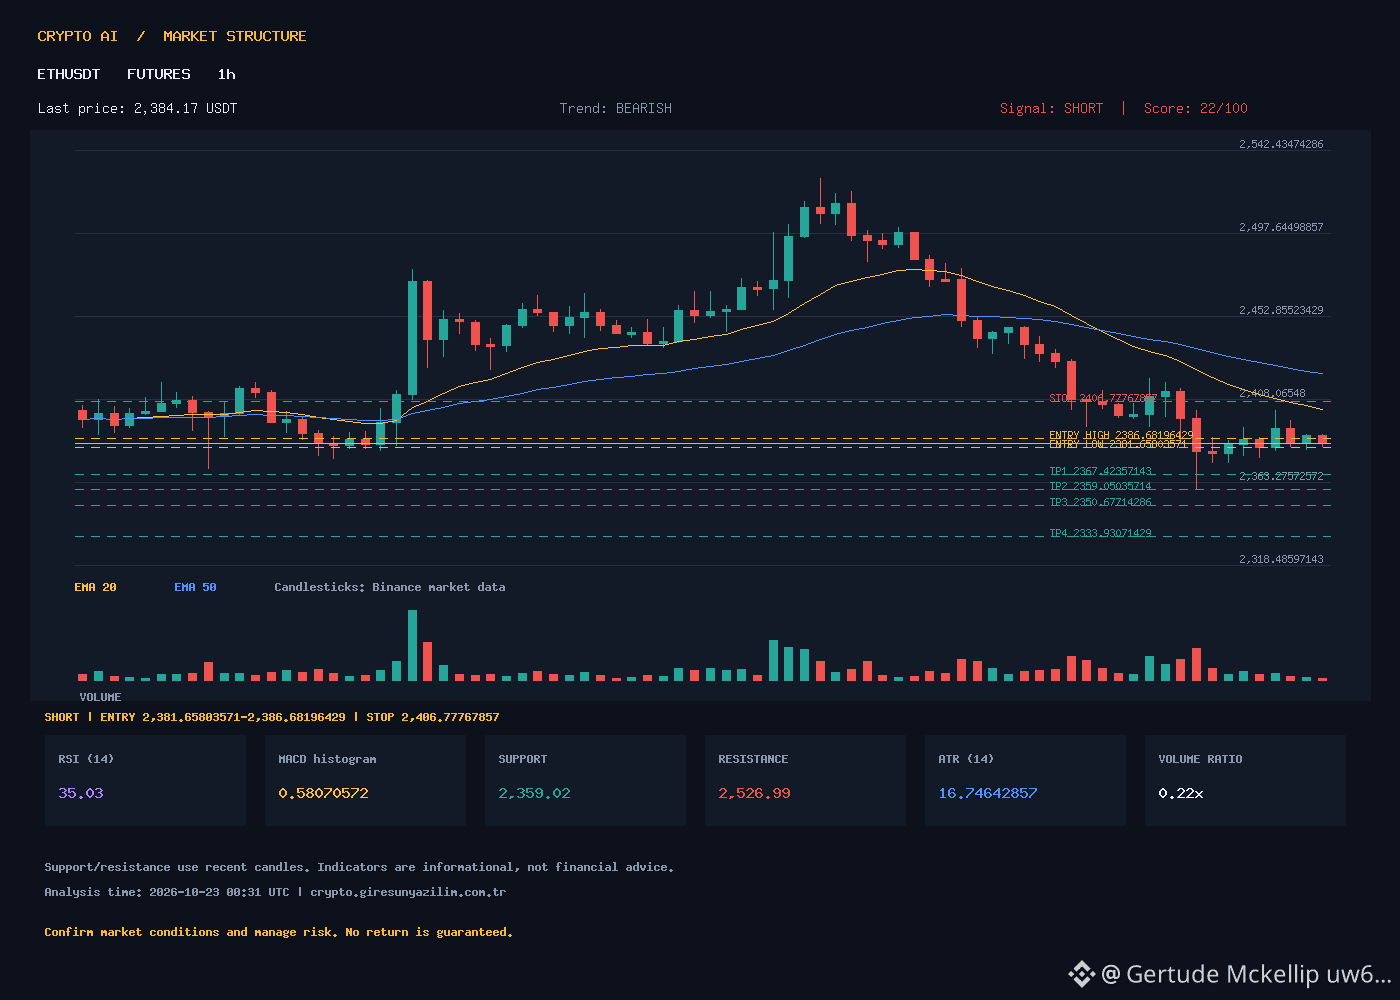
ETHUSDT Futures SHORT Setup on 1H — Bearish Momentum Continues | ETHUSDT Futures 1H Kısa Satış – Tedbir Sinyali Güçlü
🇹🇷 TÜRKÇE
ETHUSDT, 1 saatlik grafiğinde aşağı yönlü devam eden bir eğilim sergiliyor. Fiyat, EMA20 (2402.59) ve EMA50 (2422.13) altında işliyor ve EMA200 (2435.94) seviyesine doğru geri çekiliyor. RSI 35.03 seviyesinde, aşırı satım bölgesine yaklaşıyor. MACD, negatif bölgede (-16.94) ve histogram hafif pozitife döndü (0.58), yani düşüş yavaşlıyor olabilir. Ancak fiyat hâlâ destek seviyesi olan 2359.02’nin üzerinde.
Güncel fiyat: 2384.17 USDT
Trend: BEARISH (Skor: 22)
Sinyal: SHORT
Giriş aralığı: 2381.66 – 2386.68
Stop-loss: 2406.78
TP1: 2367.42
TP2: 2359.05
TP3: 2350.68
TP4: 2333.93
Bu seviyeler ATR tabanlı örnek senaryolardır; kesin sonuç garanti değildir.
Risk yönetimi kritik: Stop-loss seviyesini mutlaka koruyun.
🇬🇧 ENGLISH
ETHUSDT continues to show bearish momentum on the 1-hour chart. The price is trading below EMA20 (2402.59) and EMA50 (2422.13), trending toward EMA200 (2435.94). RSI is at 35.03, approaching oversold territory. MACD remains negative at -16.94, though the histogram shows a slight positive shift (0.58), suggesting weakening bearish momentum. The price is still above the key support level at 2359.02.
Current price: 2384.17 USDT
Trend: BEARISH (Score: 22)
Signal: SHORT
Entry range: 2381.66 – 2386.68
Stop-loss: 2406.78
TP1: 2367.42
TP2: 2359.05
TP3: 2350.68
TP4: 2333.93
These levels are ATR-based illustrative scenarios and not guaranteed outcomes.
Strict risk management is essential — always protect your position with the stop-loss.
#ETHUSDT #BinanceFutures #CryptoTrading #SHORTsignal #ATR
35

·
--
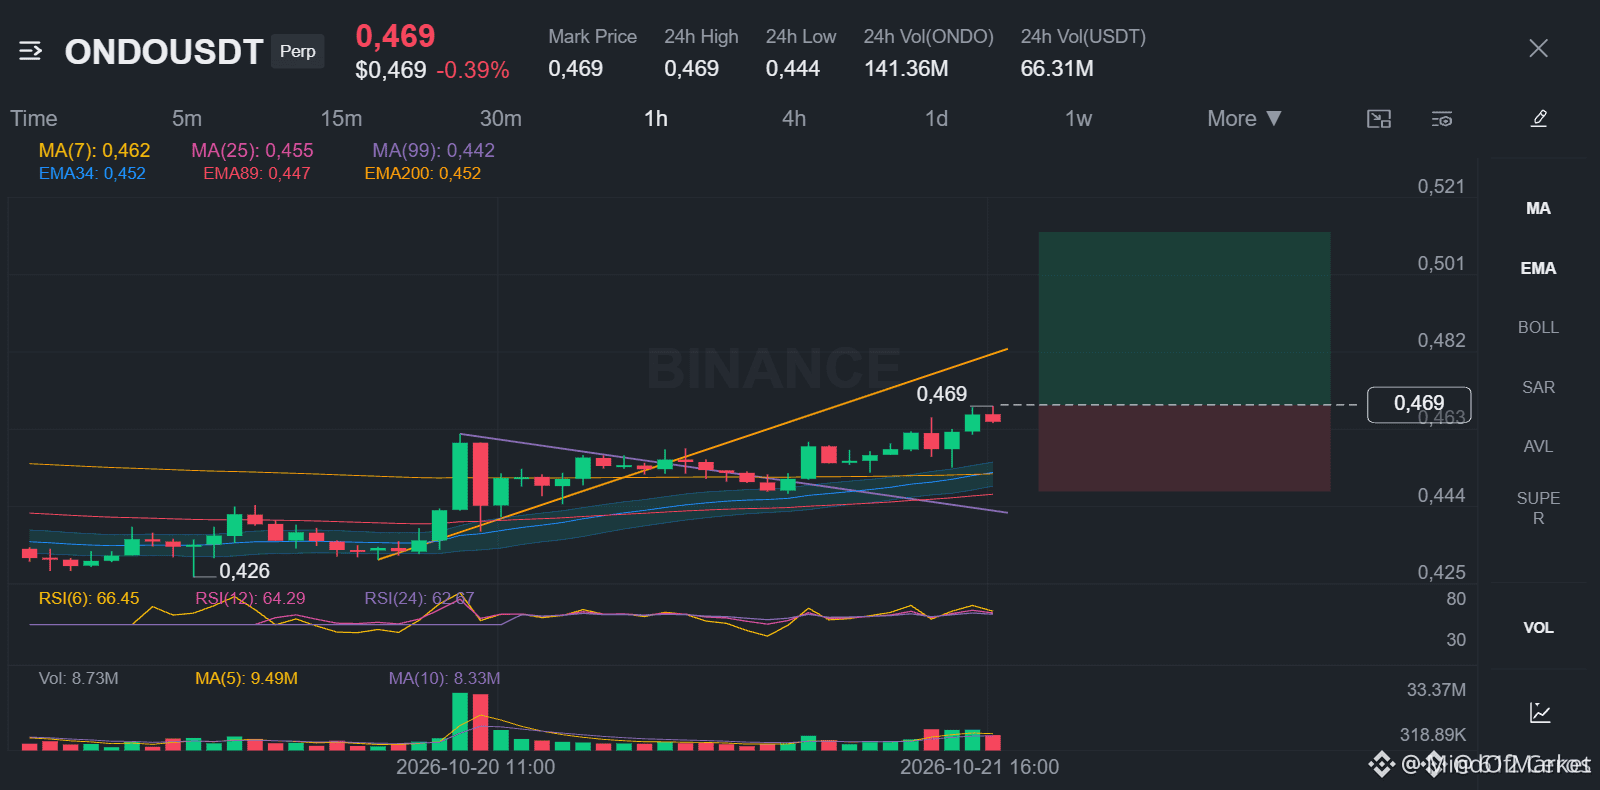
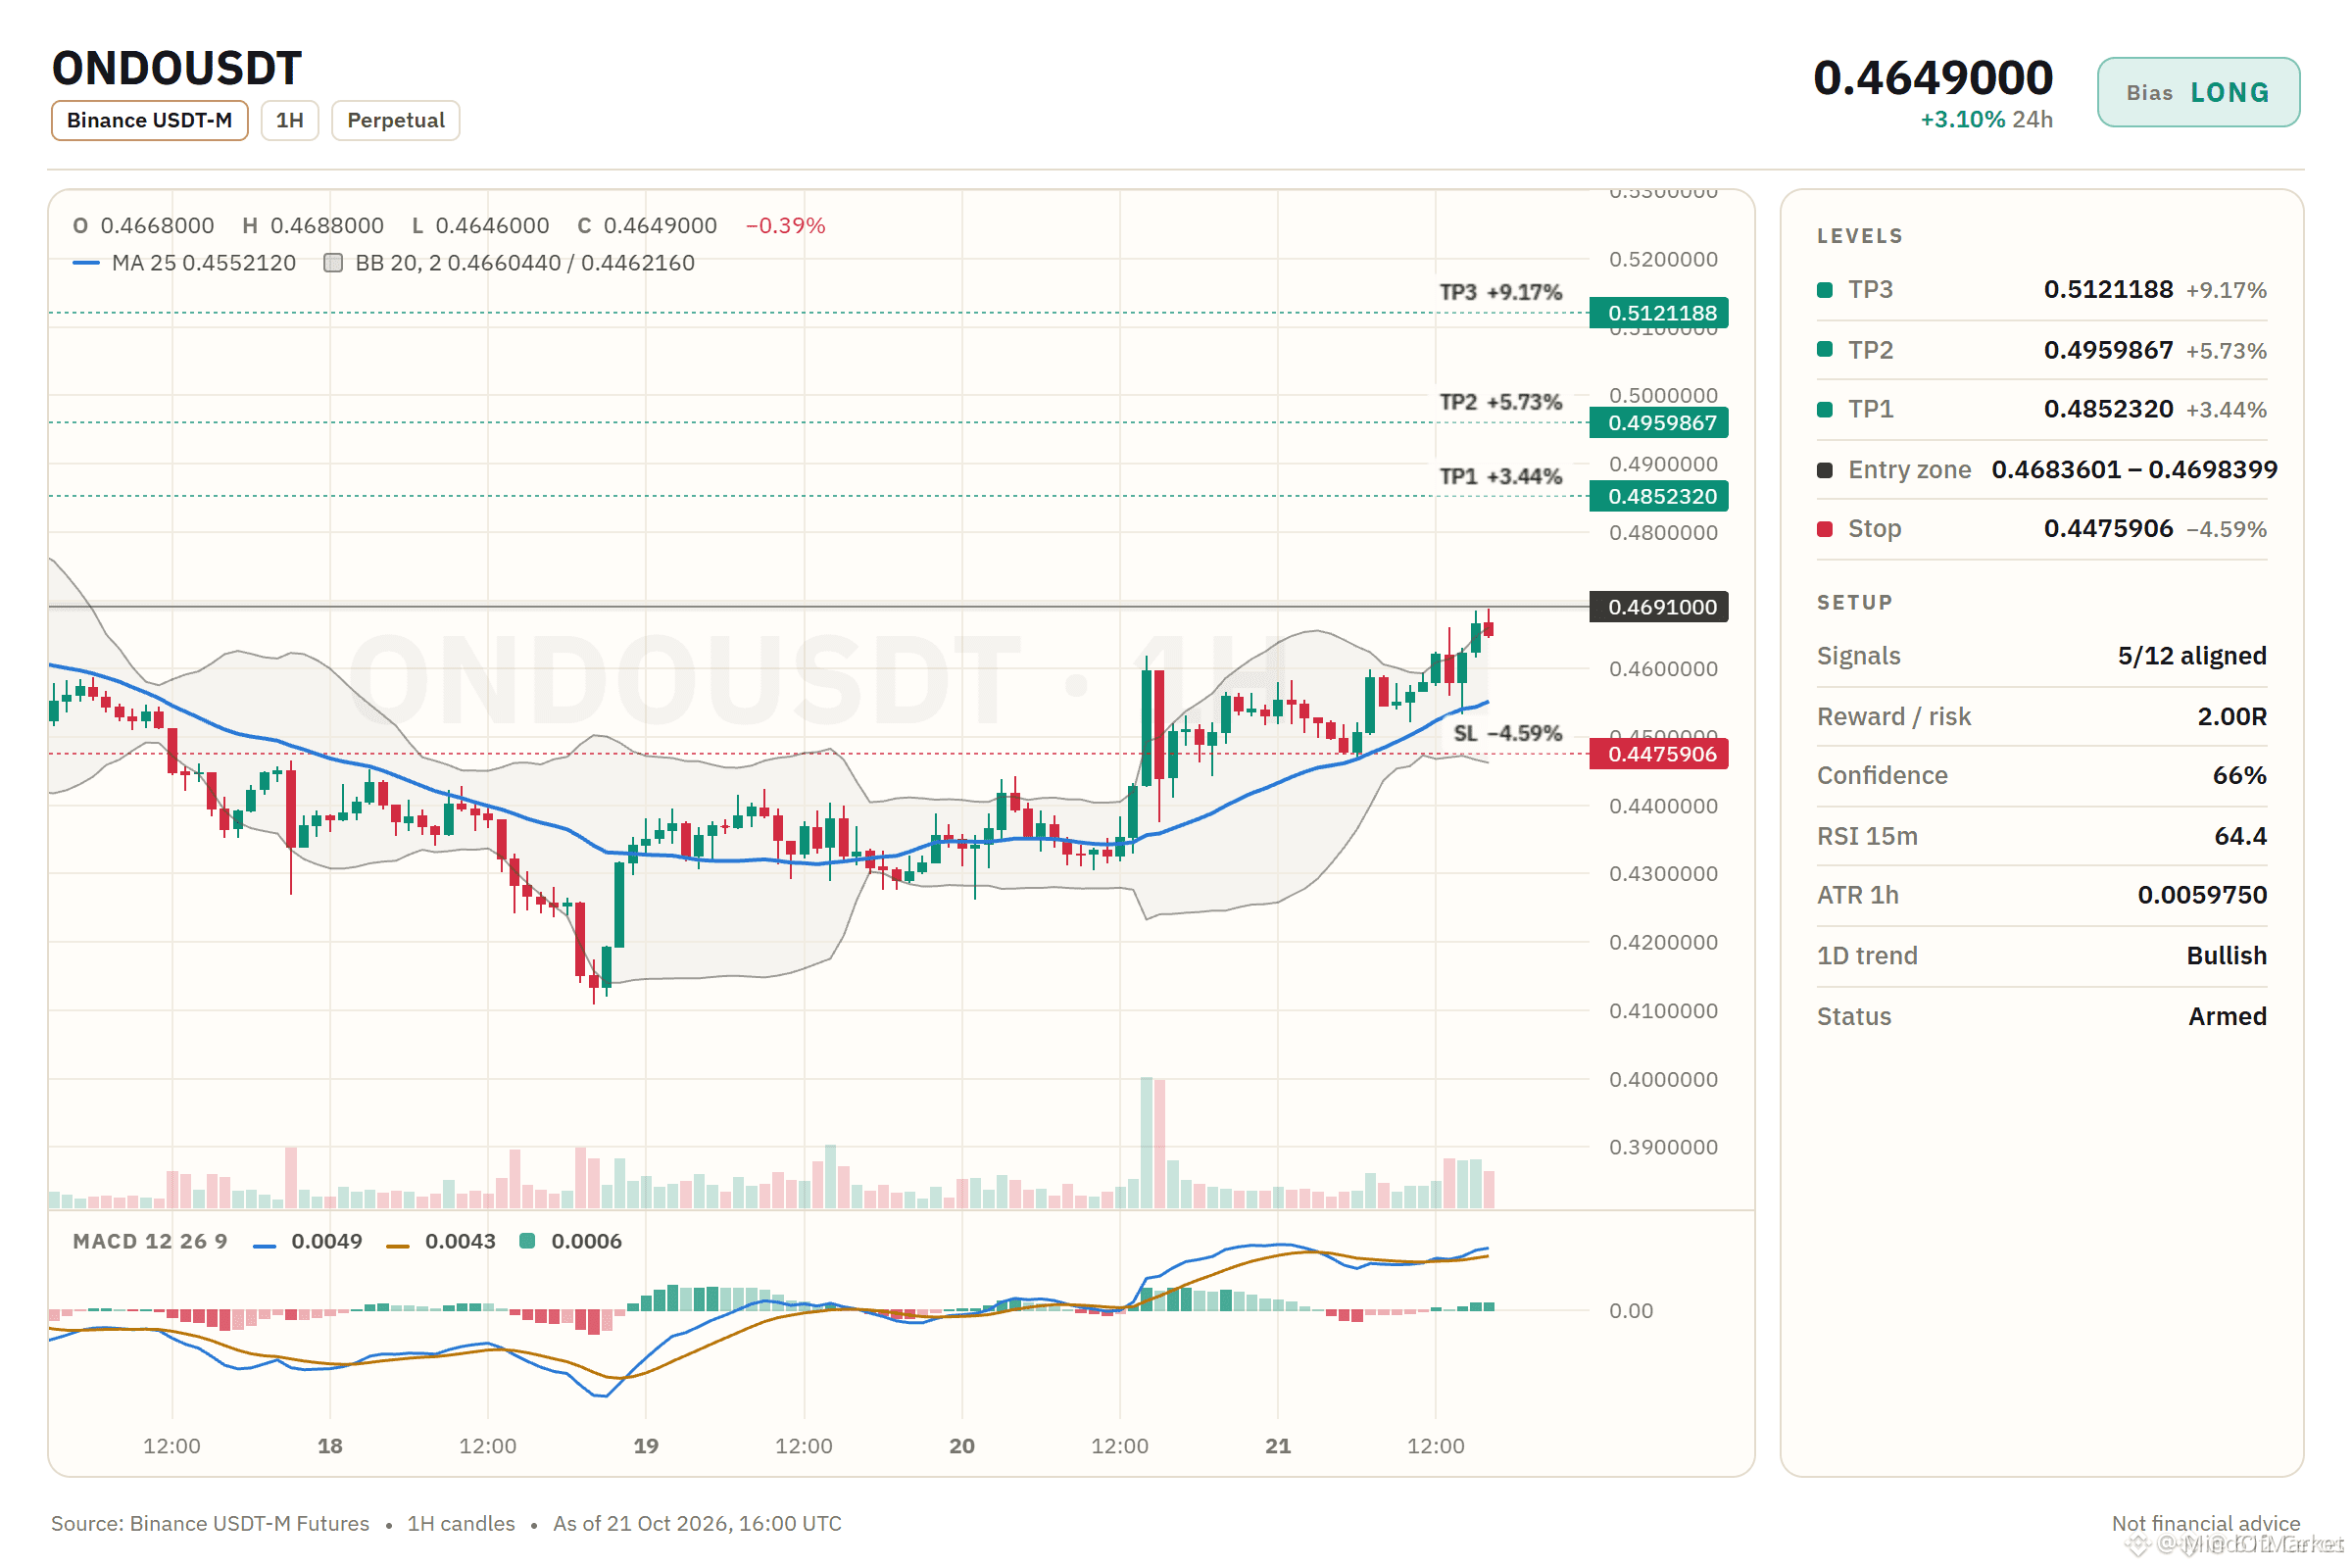
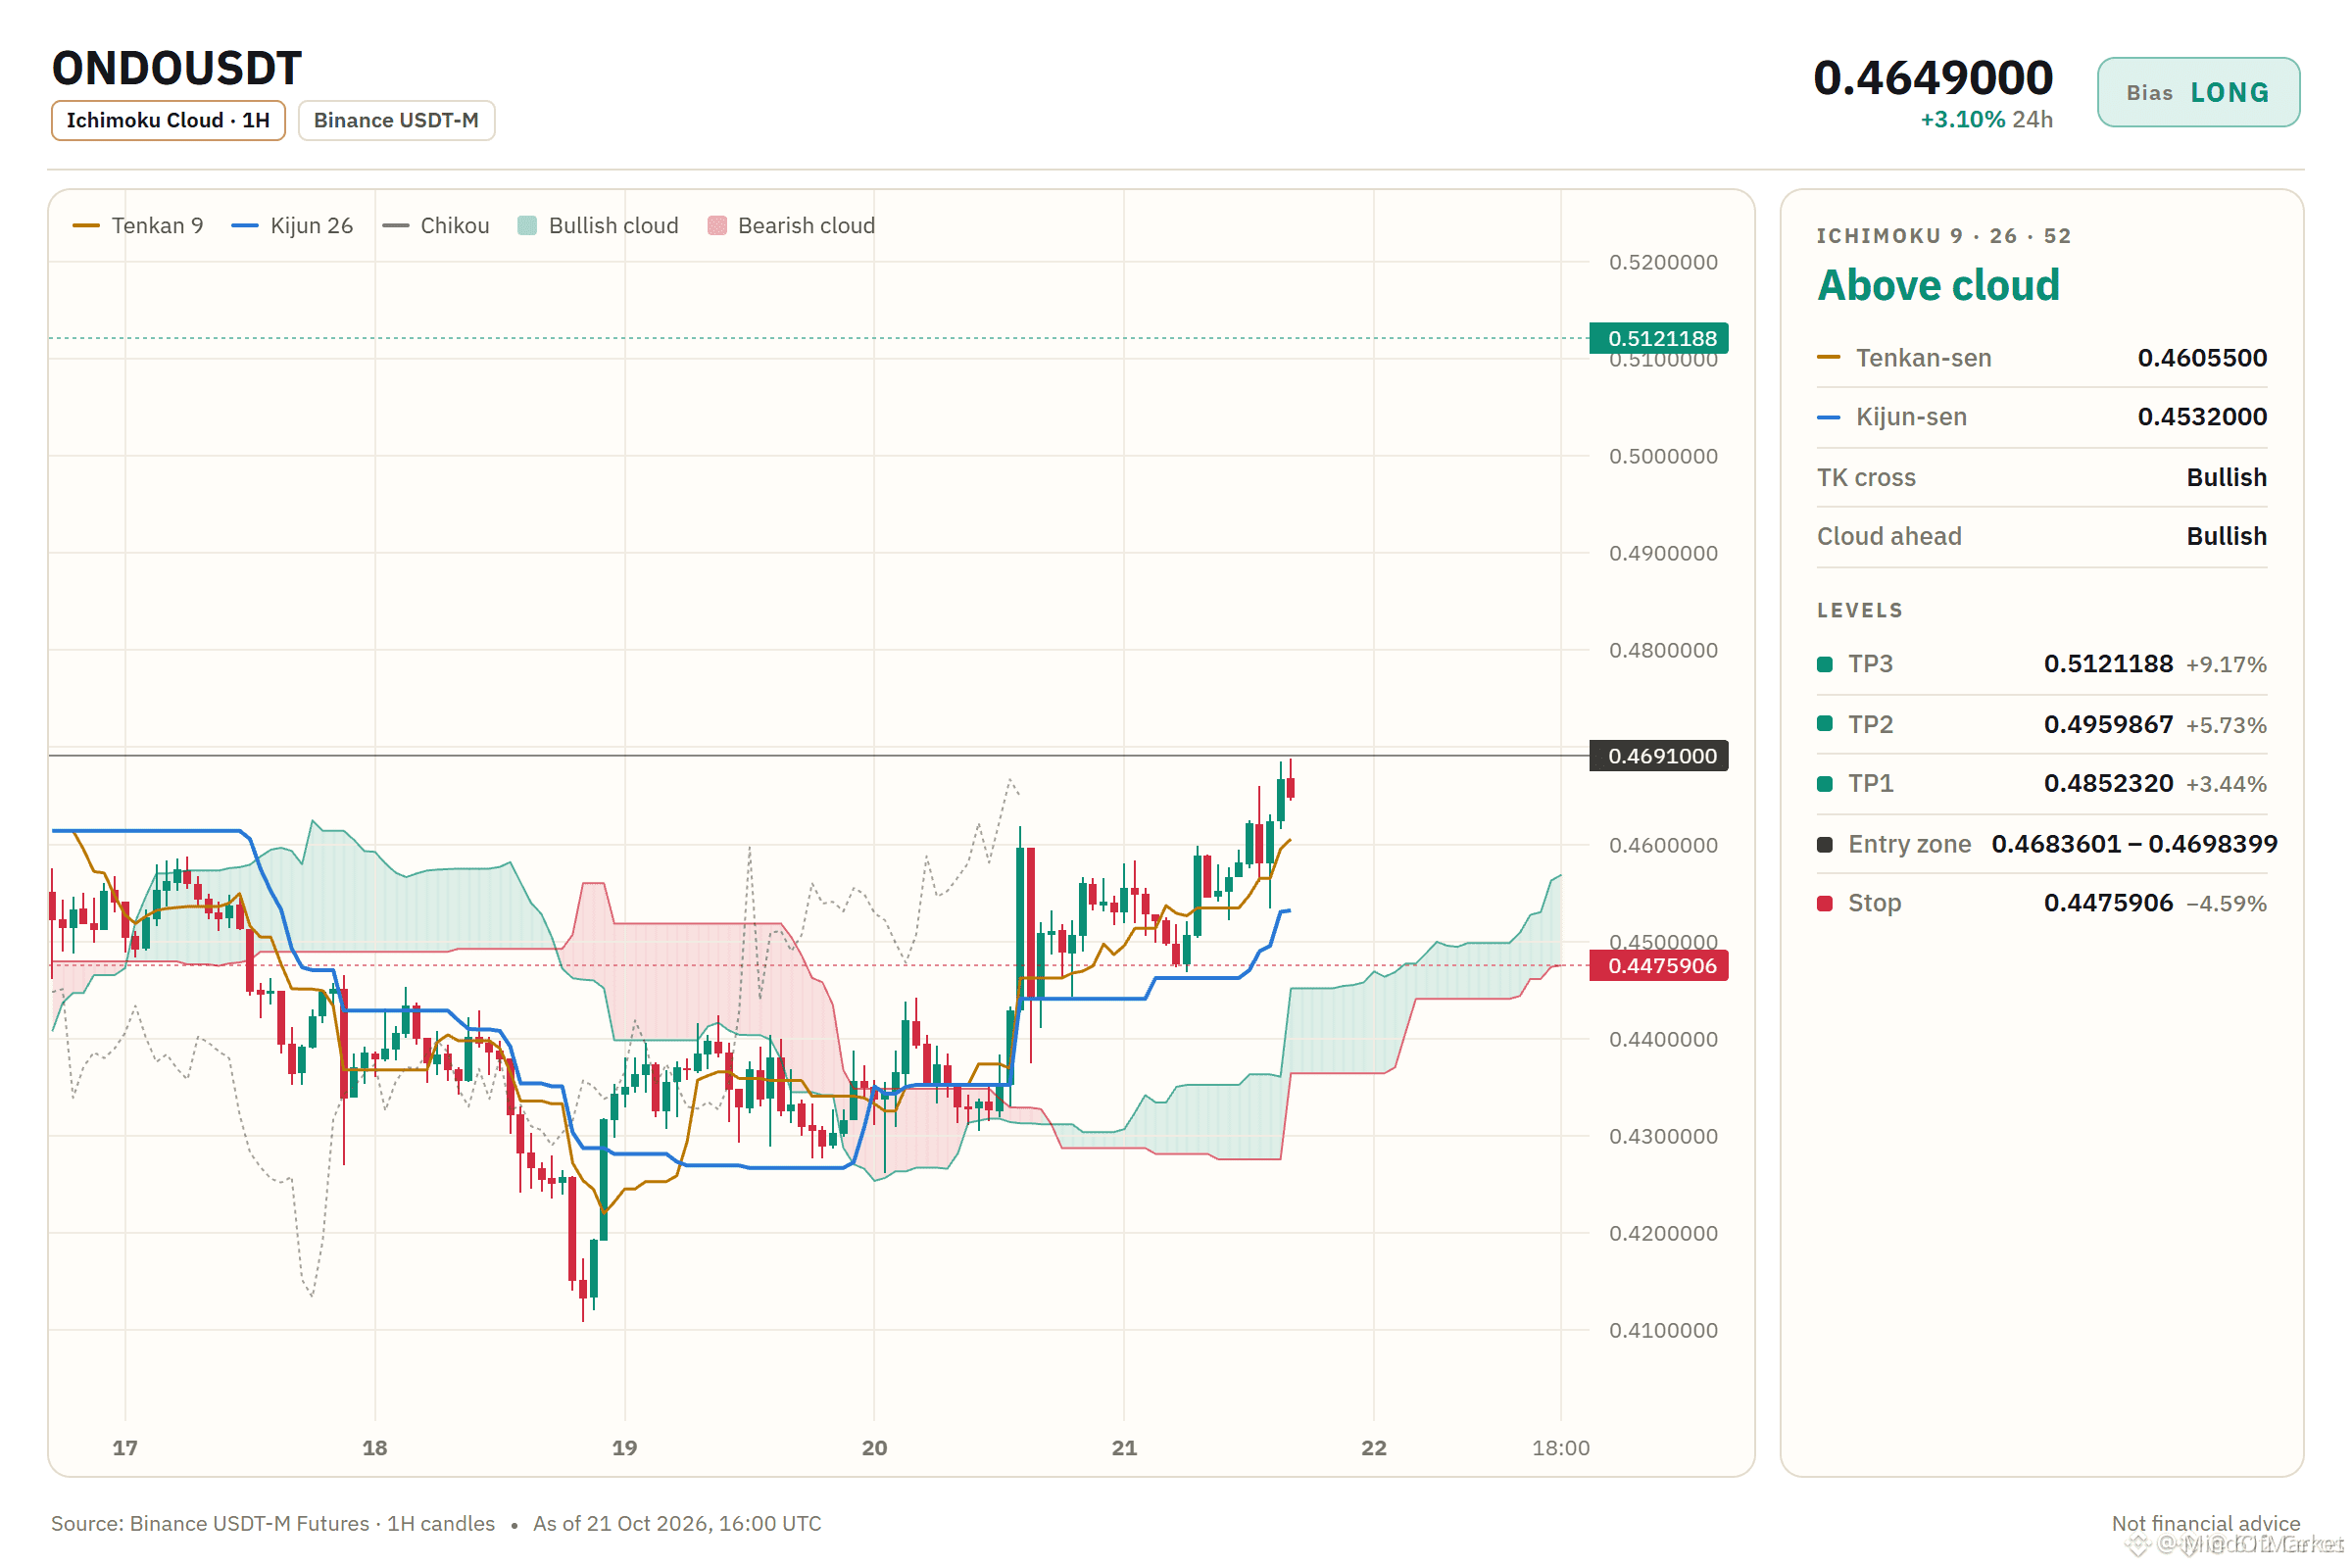
🚨 $ONDO SURGES 3 ATR ABOVE 1H AVERAGE! 📈
Entry: 0.4683601 – 0.4698399 ⚡
Target: 0.4852320 🚀
Target: 0.4959867 🚀
Target: 0.5121188 🚀
Stop Loss: 0.4475906 ⚠️
📊 The 1H EMA50 is now a firm floor, while the 4H RSI holds at 63, confirming buyer dominance. 🦈 Institutional liquidity is being siphoned above the EMA, and the ATR spike signals a fresh thrust toward the 4H trend corridor. 📈 Volume is expanding, and daily EMA50/200 remain bullish, framing a clean upward bias.
💡 If a 1H candle breaches daily EMA50 and RSI slides under 50, the pullback narrative flips—exit promptly. 💬 How are you positioning your risk on this multi‑target swing? 👇
⚠️ Not financial advice. Always manage your risk. 🛡️
🏷️ #ONDO #LongSetup #ATR #EMA #Crypto
🔥 🚀
21
Binance Square ZECUSDT 1h LONG Analizi | Binance Square ZECUSDT 1h LONG Analysis
🇹🇷 **TÜRKÇE**
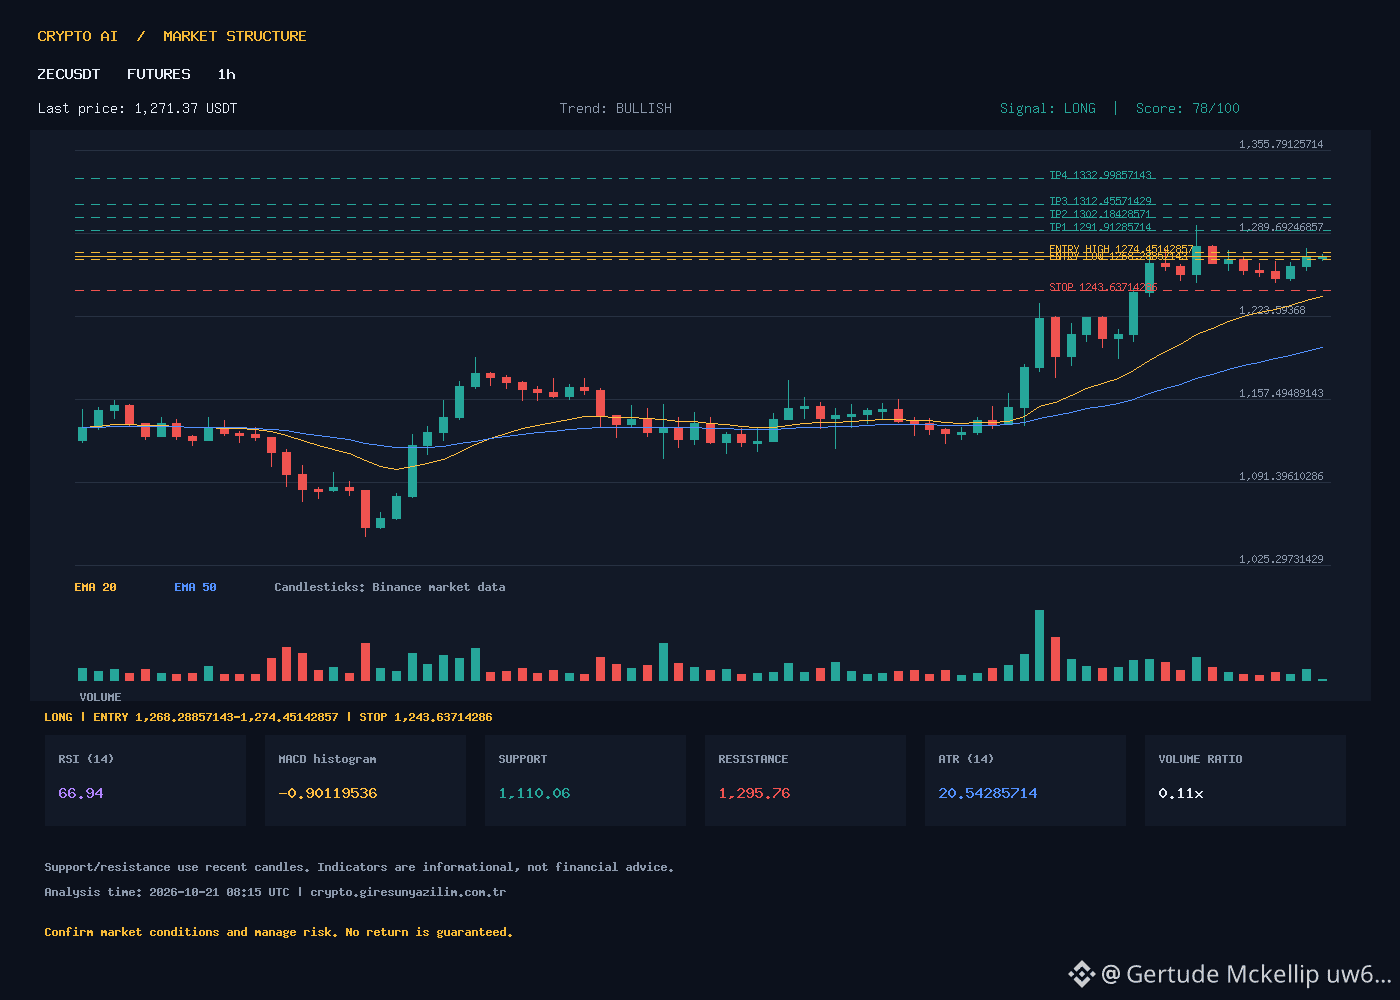
ZECUSDT 1h zaman dilimindeki sinyali **LONG** olarak belirlenmiştir. ATR tabanlı önerilen giriş aralığı **1268.28857143 – 1274.45142857**, stop loss ise **1243.63714286** seviyesinde tutulmalıdır. Dört kar hedefi şunlardır: **TP1 = 1291.91285714**, **TP2 = 1302.18428571**, **TP3 = 1312.45571429**, **TP4 = 1332.99857143**. Mevcut fiyat **1271.37**, EMA20 = 1239.32, EMA50 = 1199.43, EMA200 = 1190.37, RSI = 66.94, MACD = 27.37 (sinyal = 28.27, histogram = ‑0.90), ATR = 20.54, destek = 1110.06, direnç = 1295.76. Fiyat EMA'ların üzerinde seyrediyor ve trend skor = 78 (güçlü yükseliş), ancak MACD histogramının negatif olması ve hacim oranının düşük olması (0.11) göstergeleri arasında bir uyumsuzluk var. Bu durum, kısa vadeli baskıya işaret ediyor. **ATR tabanlı seviyeler yalnızca gösterge amaçlıdır ve garanti edilmez.**
🇬🇧 **ENGLISH**
ZECUSDT 1h signal is **LONG**. The ATR‑based entry range is **1268.28857143 – 1274.45142857**, with a stop loss at **1243.63714286**. Four take‑profit targets: **TP1 = 1291.91285714**, **TP2 = 1302.18428571**, **TP3 = 1312.45571429**, **TP4 = 1332.99857143**. Current price **1271.37**, EMA20 = 1239.32, EMA50 = 1199.43, EMA200 = 1190.37, RSI = 66.94, MACD = 27.37 (signal = 28.27, histogram = ‑0.90), ATR = 20.54, support = 1110.06, resistance = 1295.76. The price trades above the EMAs and the trend score is **78** (strong bullish), yet the negative MACD histogram and low volume ratio (0.11) suggest some short‑term weakness. These mixed signals warrant caution. **The levels are ATR‑based scenarios and not guaranteed outcomes.**
#ZECUSDT #BinanceFutures #CryptoAnalysis #TechnicalAnalysis #ATR
3

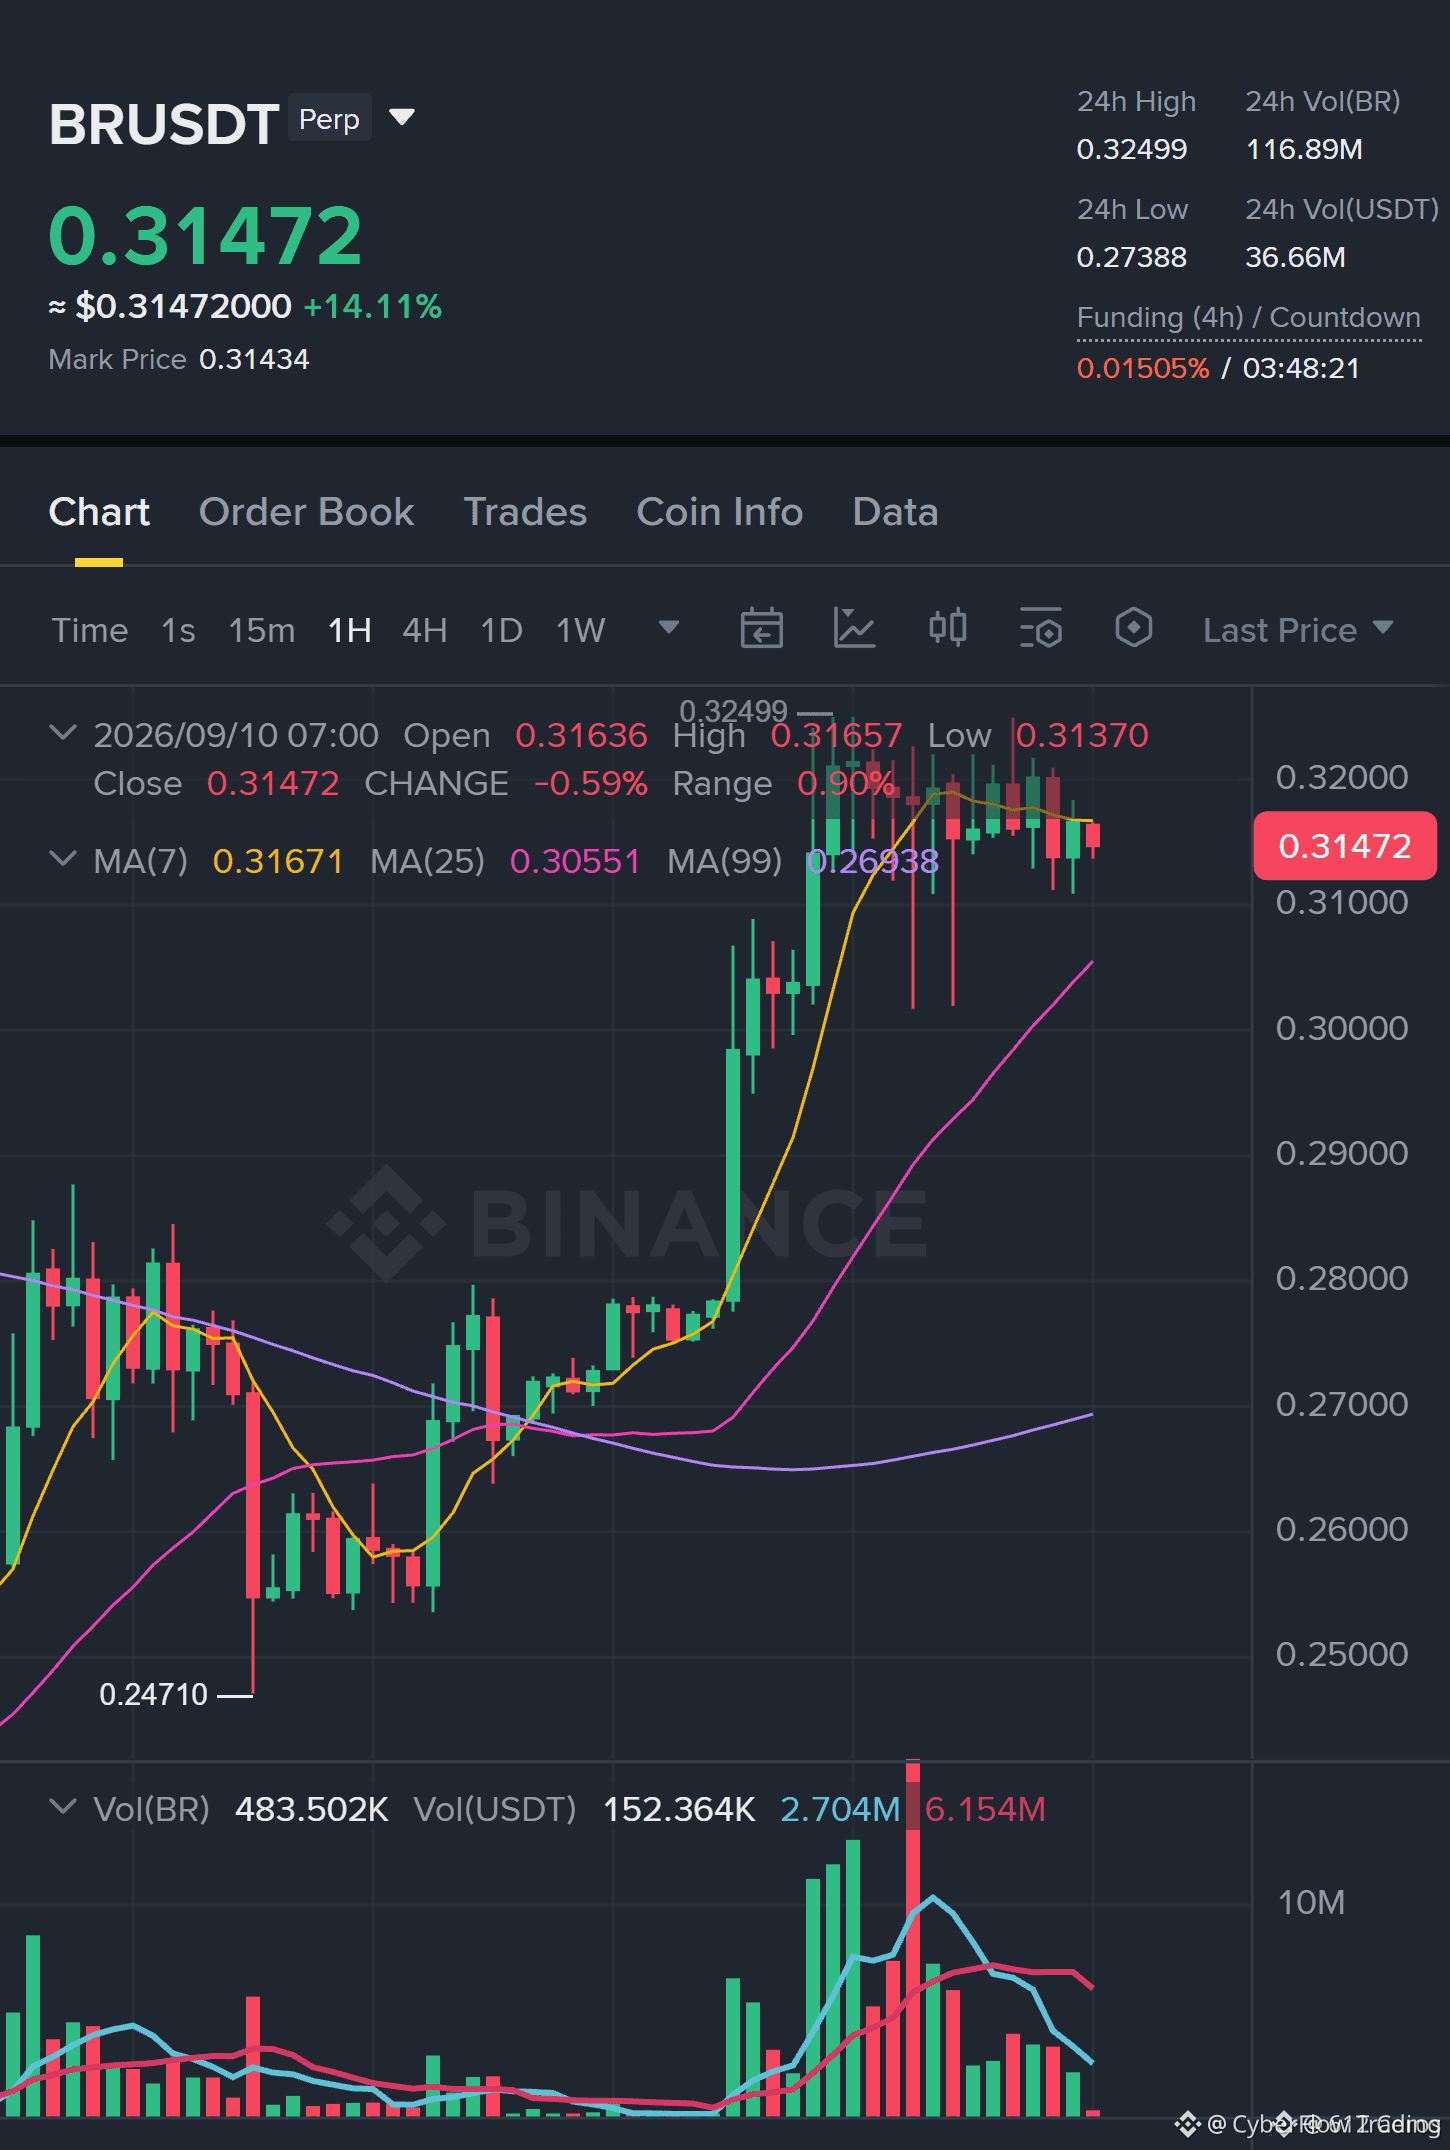
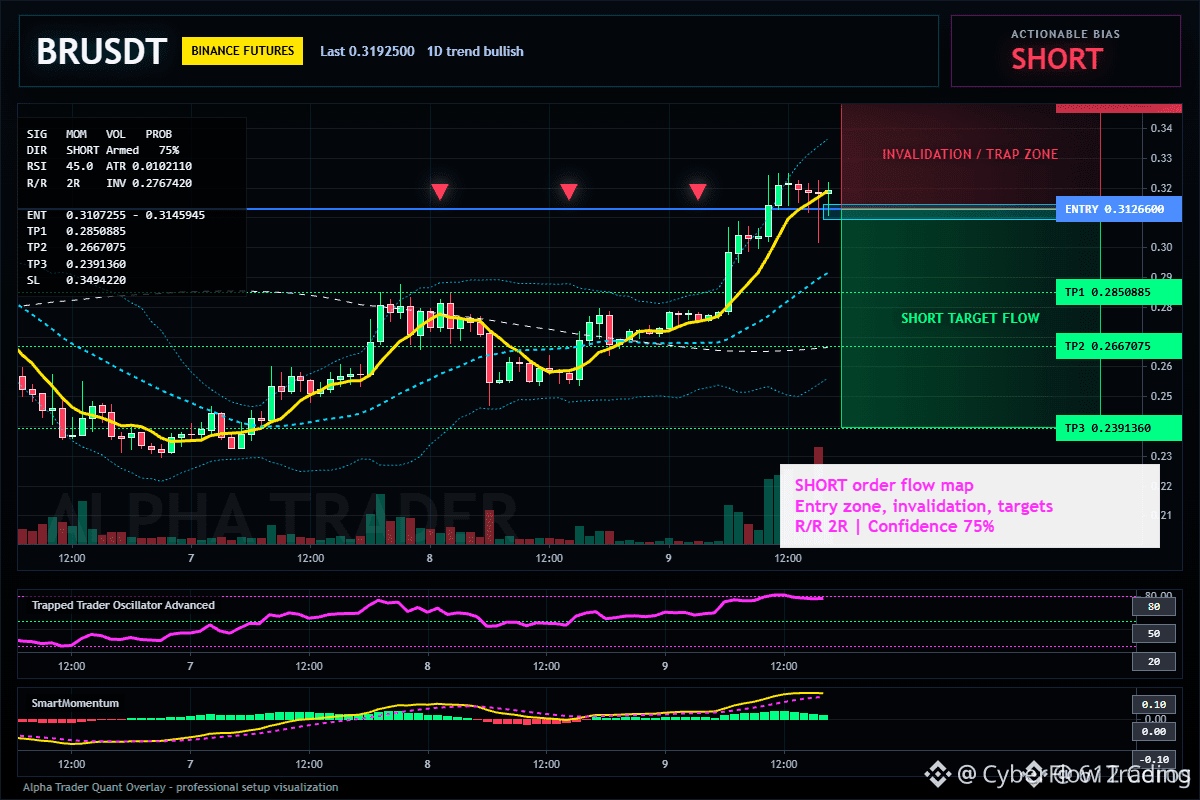
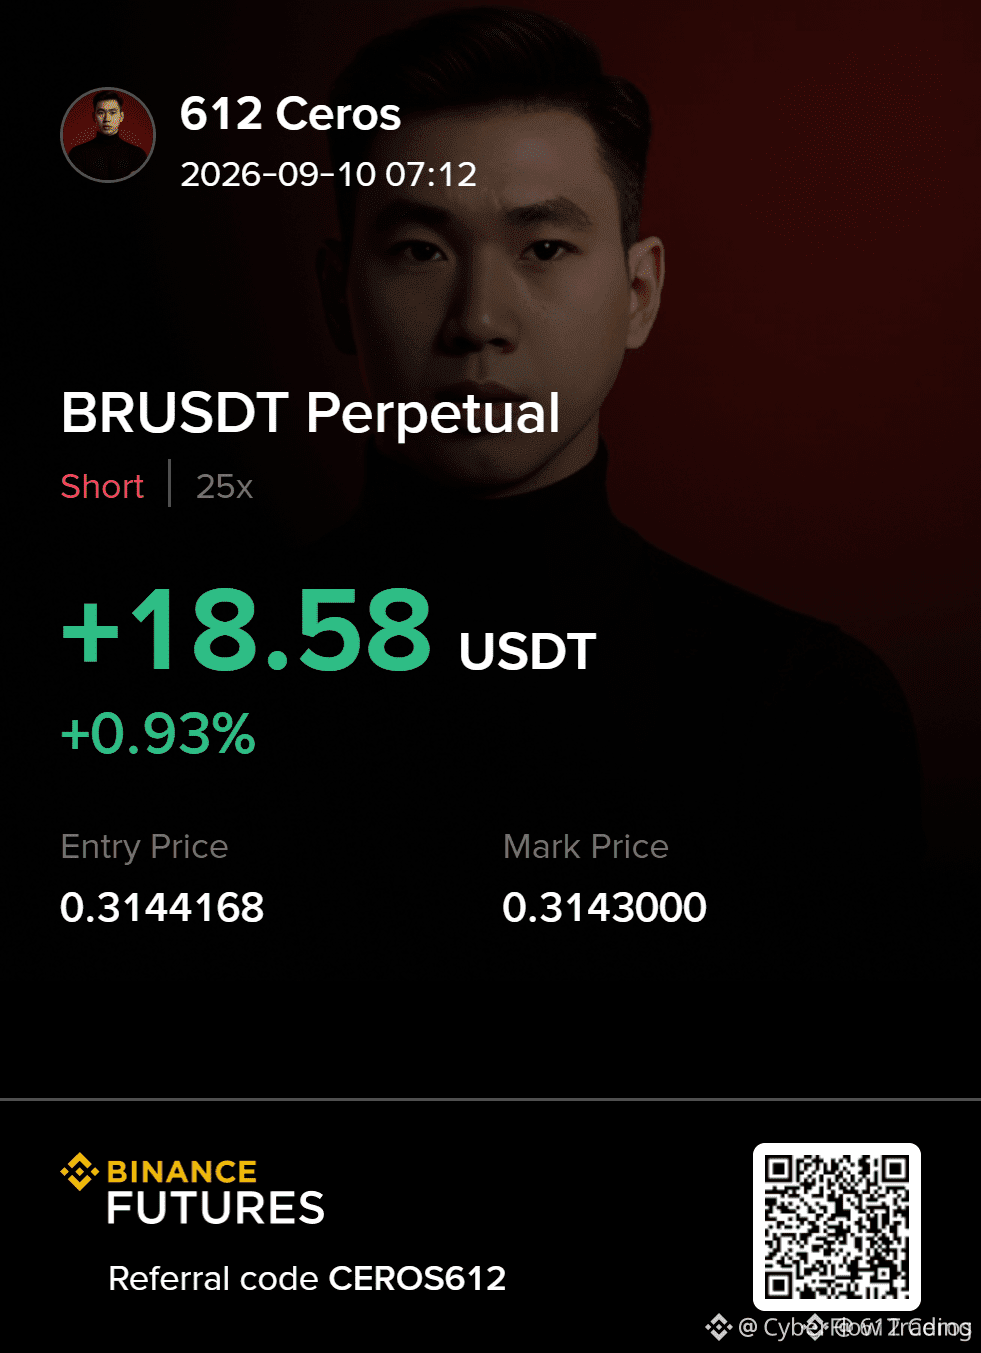
🚨 $BR SHORT SETUP HIDING BEHIND DAILY BULLISHNESS! 🦈
Entry: 0.3107255 – 0.3145945 ⚡
Target: 0.2850885 🚀
Stop Loss: 0.3494220 ⚠️
The daily chart screams bullish, yet the 1‑hour ATR band is whispering a contrarian story 📊. Smart money is stacking shorts just beyond the band, ready to flip the momentum on a clean reject.
Entry sits between 0.3107 and 0.3146 where sellers outpace buyers, and volume spikes confirm a liquidity sweep ⚡. The first swing aims for 0.2851, with deeper pockets at 0.2667 and 0.2391 if the wave holds 🌊.
Watch the 0.2767 pivot – a break could invalidate the setup and flip the script 🦈.
💬 Are you positioning for the short swing before liquidity swallows the price?
⚠️ Not financial advice. Always manage your risk. 🛡️
🏷️ #BR #ShortSetup #Crypto #ATR #Liquidity
🦈 🔥
59
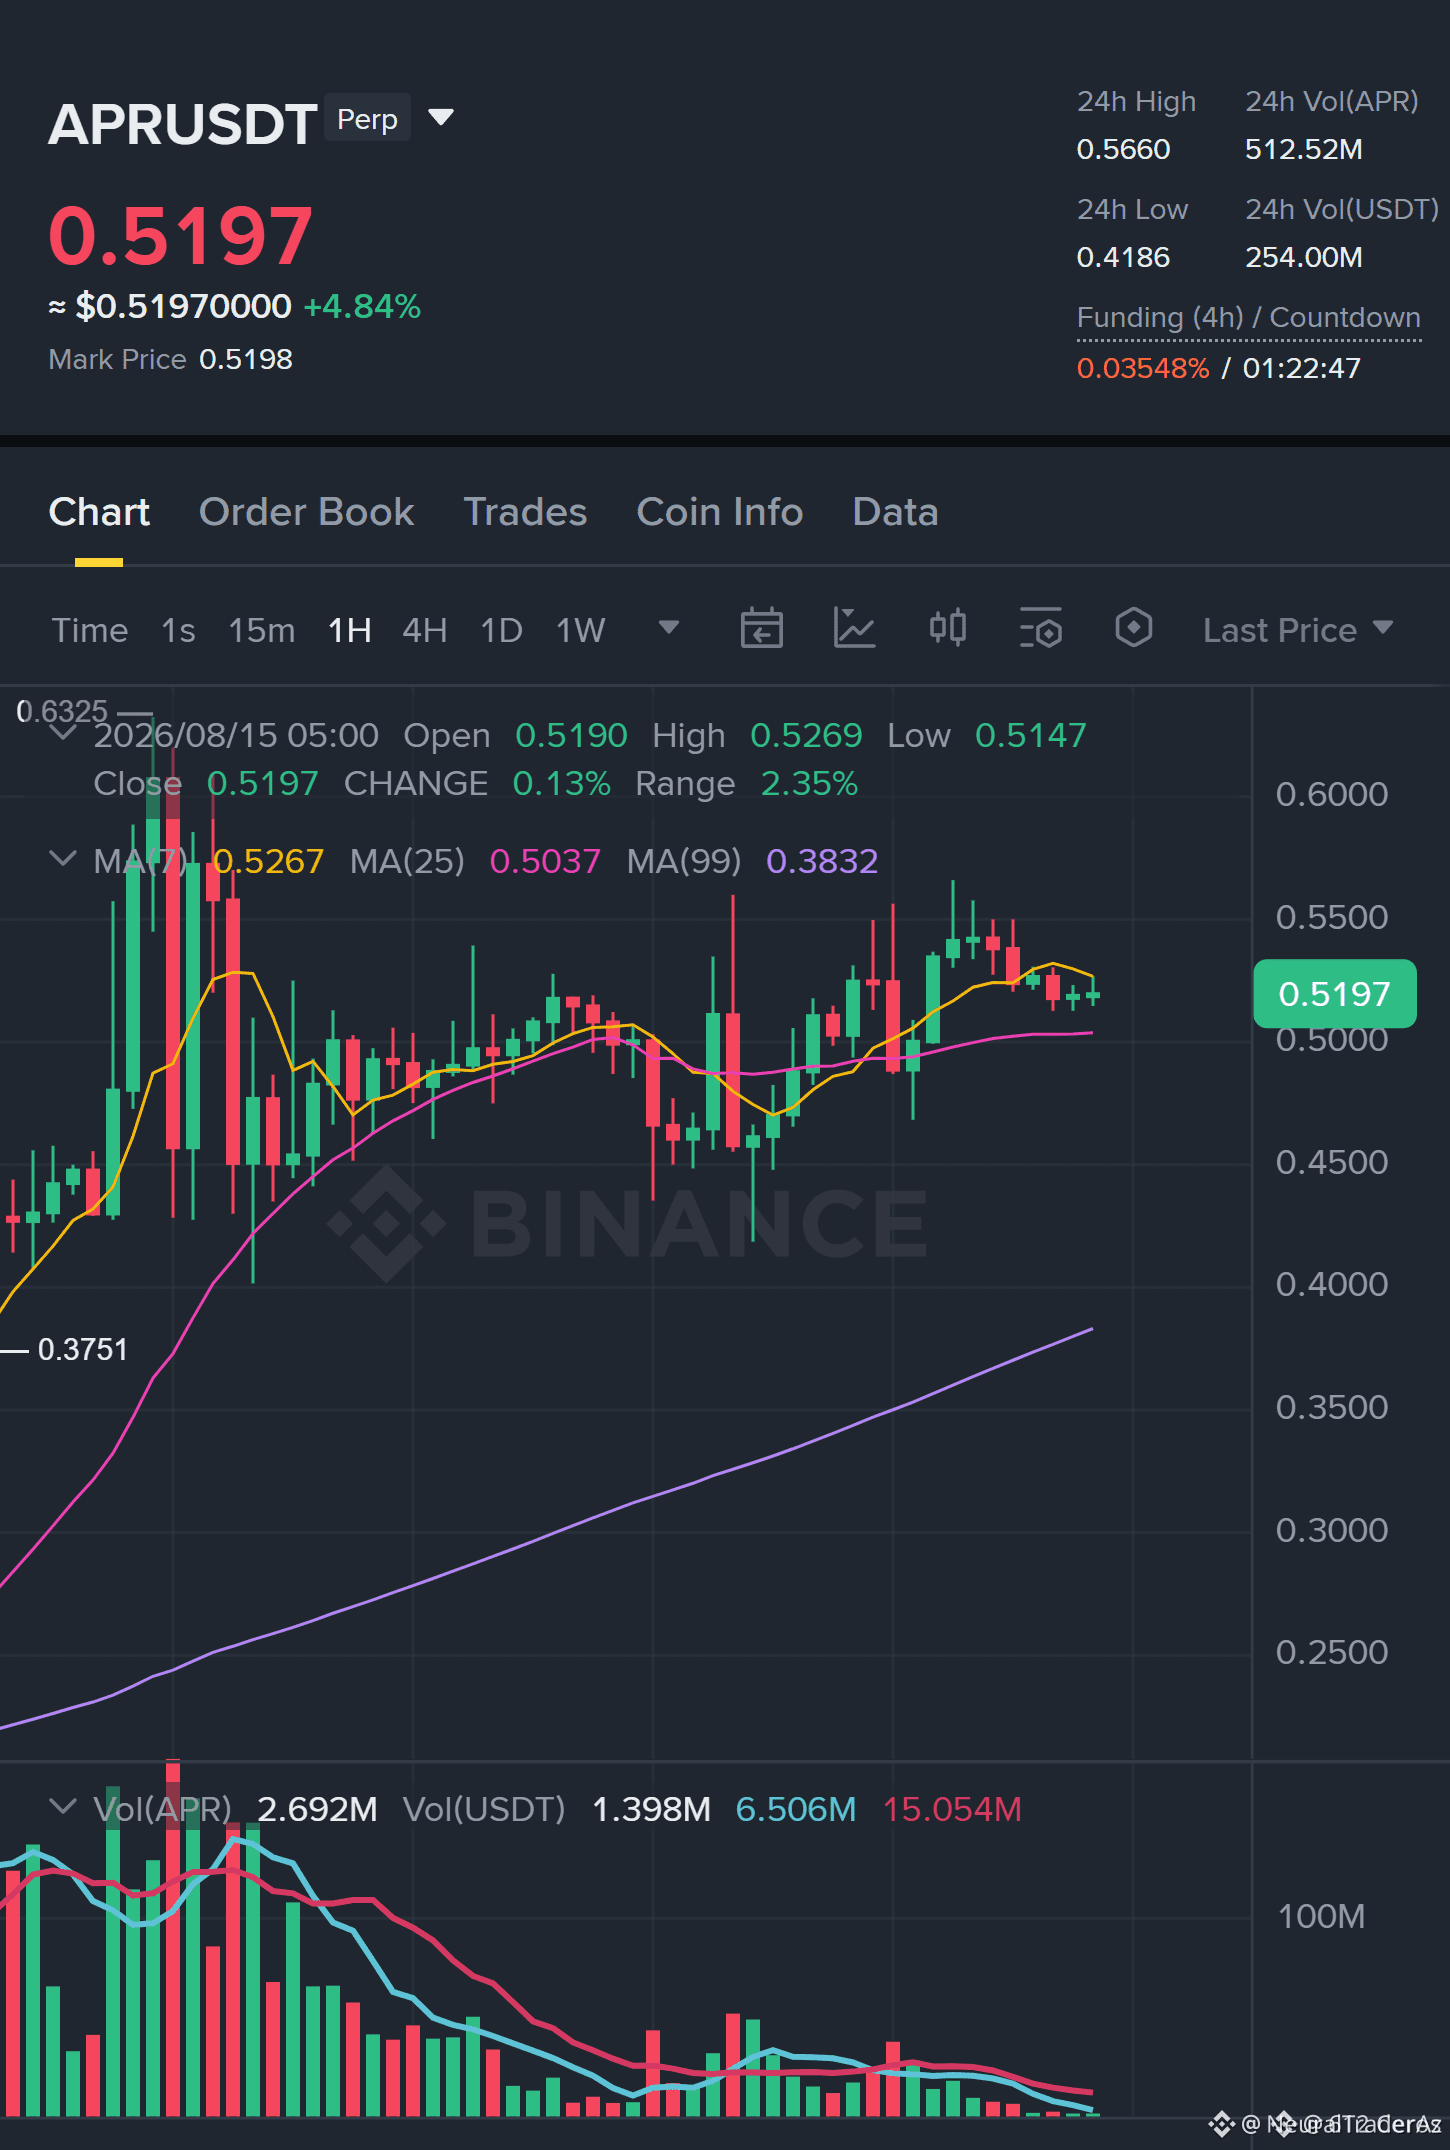
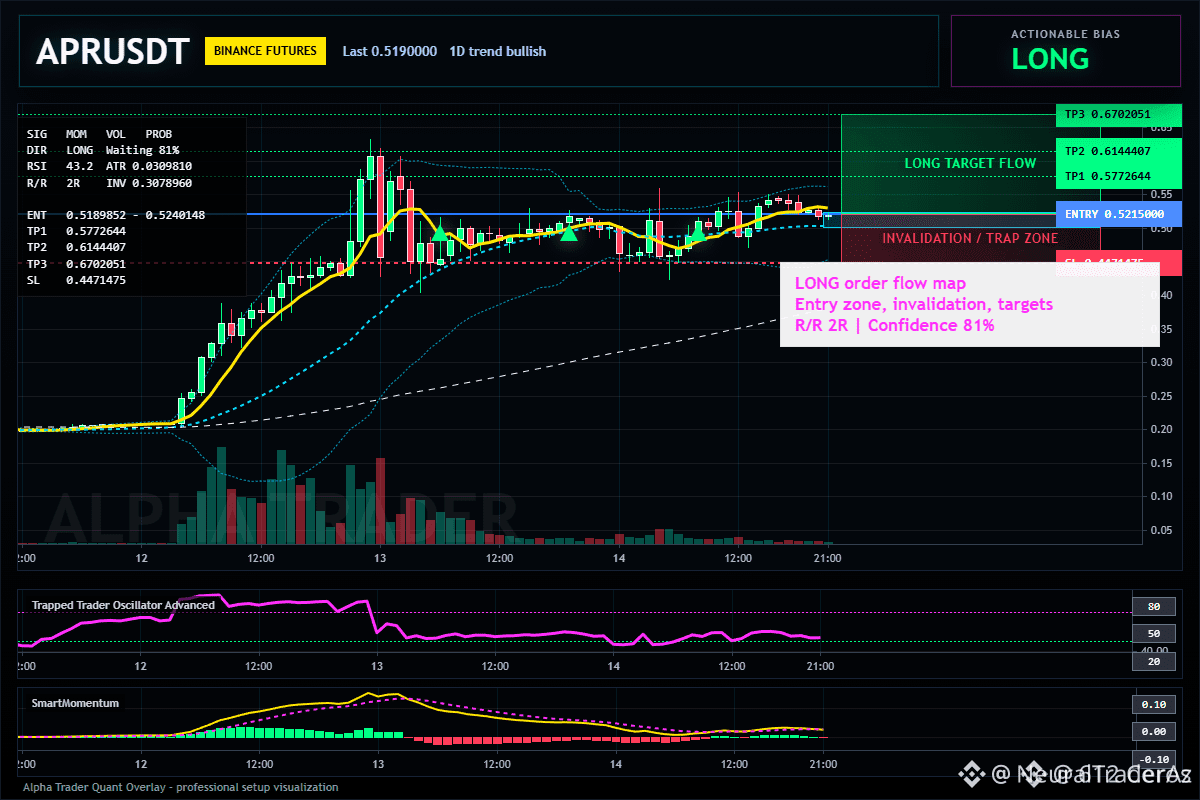
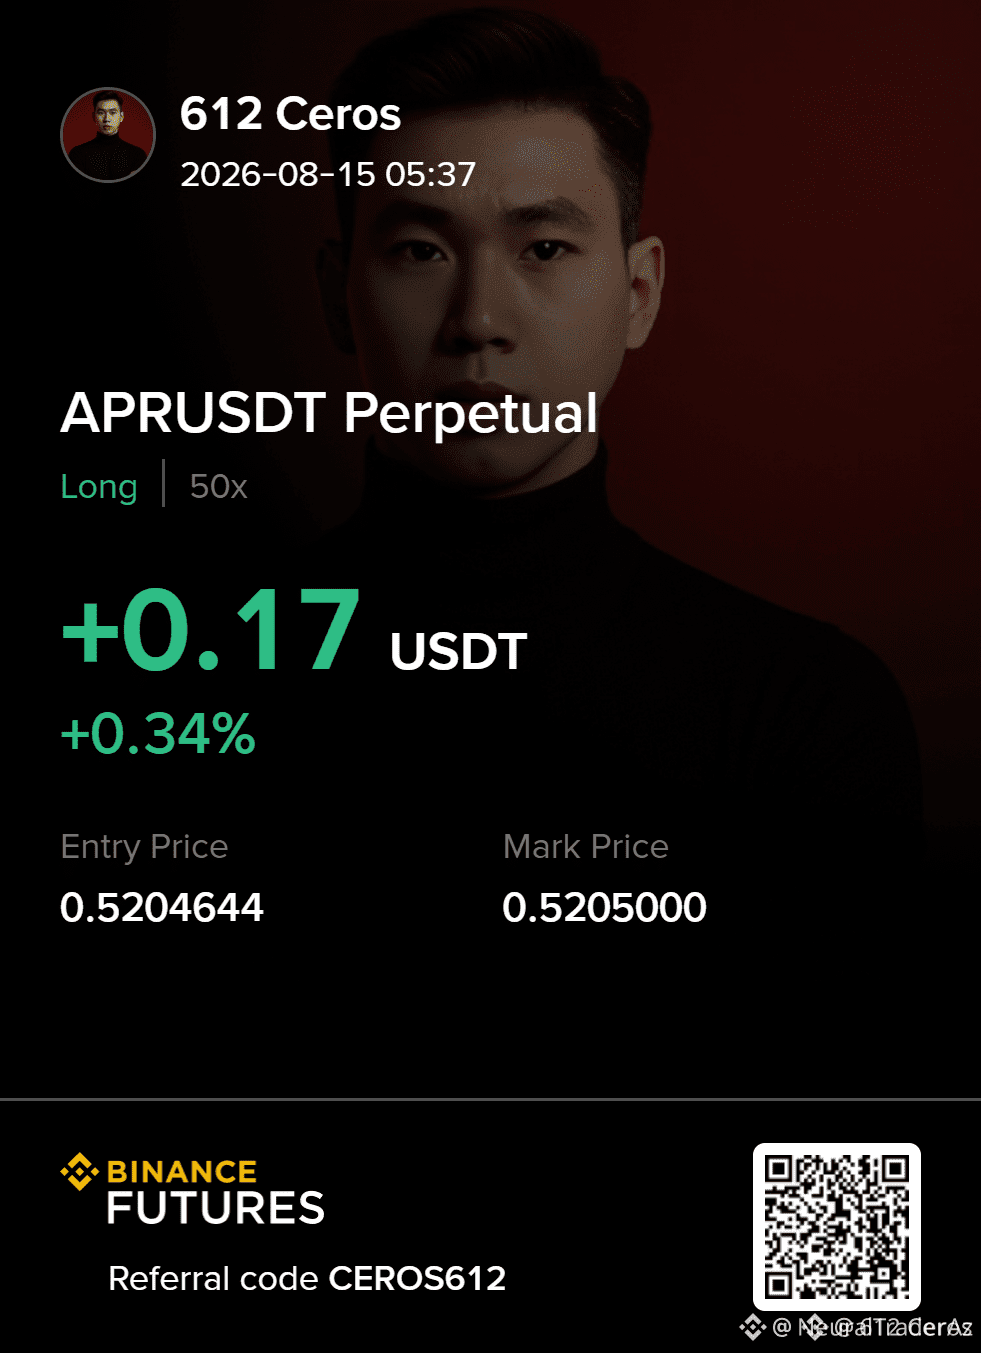
🟢 $APR 4H SPRING COILING – TREND-FOLLOWING LONG WITH DEFINED RISK! ⚡
Entry: 0.5189852 – 0.5240148 ⚡
Target: 0.5772644 / 0.6144407 / 0.6702051 🚀
Stop Loss: 0.4471475 ⚠️
While everyone hyperventilates over the 15m RSI at 43.2, the 4H tape is quietly loading a spring. 📊 This entry zone sits on a compressed 0.03 ATR — inefficiency primed for expansion, not a reversal gamble. The daily trend is bullish, and we're aligning with the regime, not fighting it. 🦈
The 0.5215 pivot is the battleground — if it holds, we're looking at a 10.7% run to TP1, then 17.8% to TP2. Risk is razor-thin at 0.4471, giving this high-grade R:R without chasing. 🔍 Is 0.5215 the last cheap ticket before 0.5772, or does the RSI bleed into a lower retest? 💬
⚠️ Not financial advice. Always manage your risk. 🛡️
🏷️ #APR #LongSetup #TrendFollowing #Crypto #ATR
🐂 🌕
174
·
--
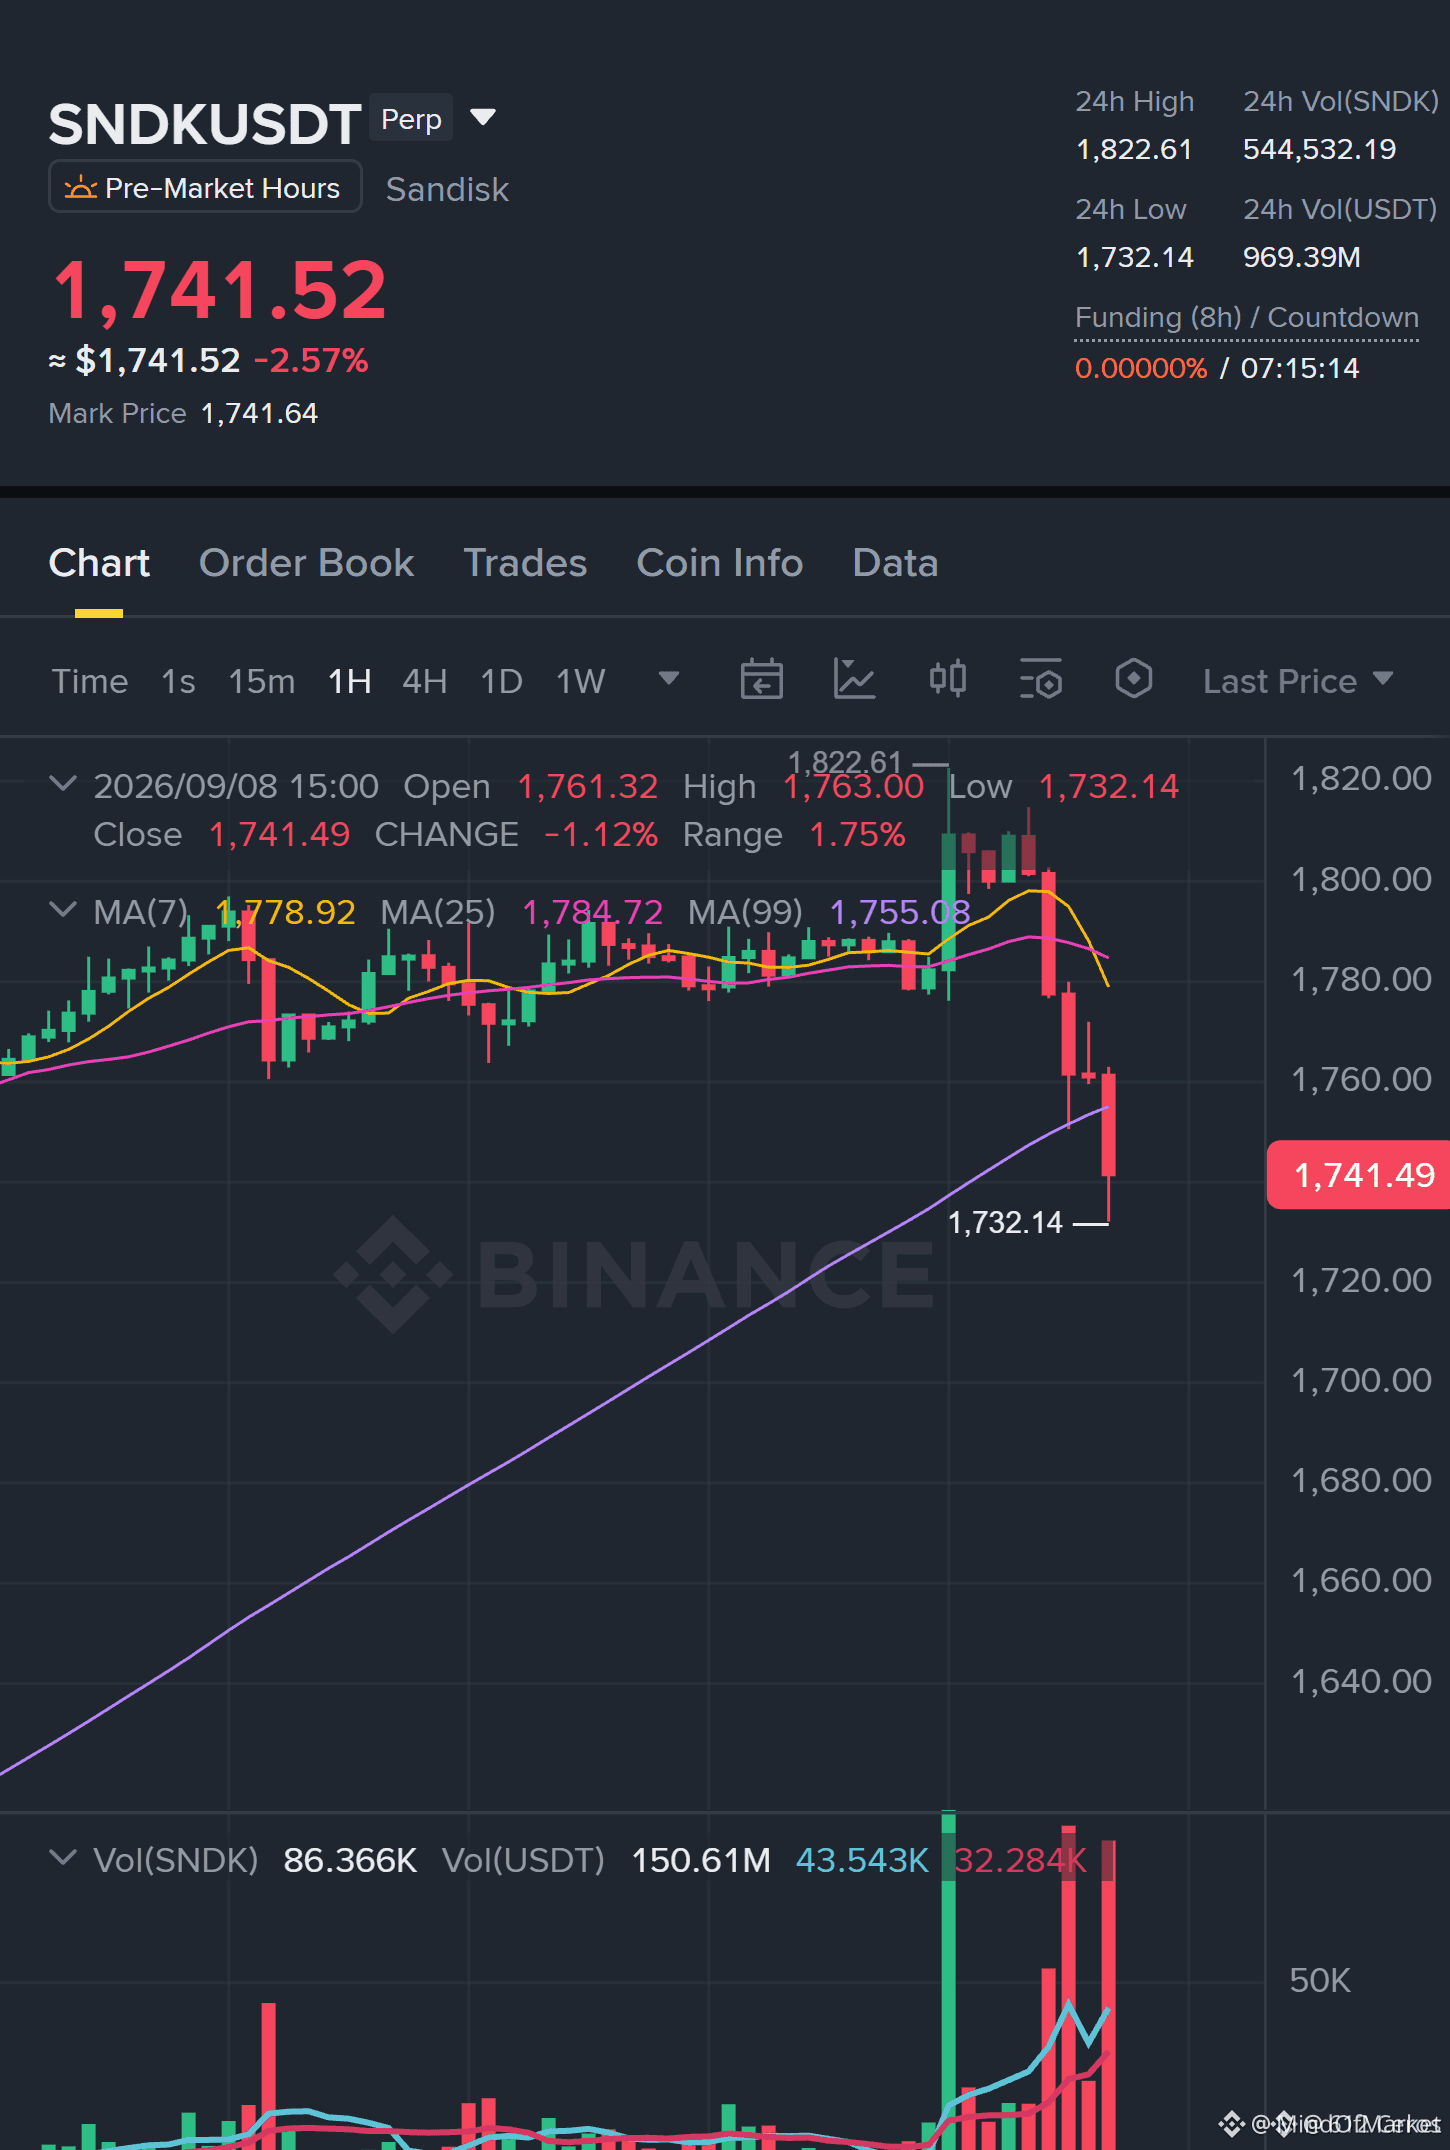
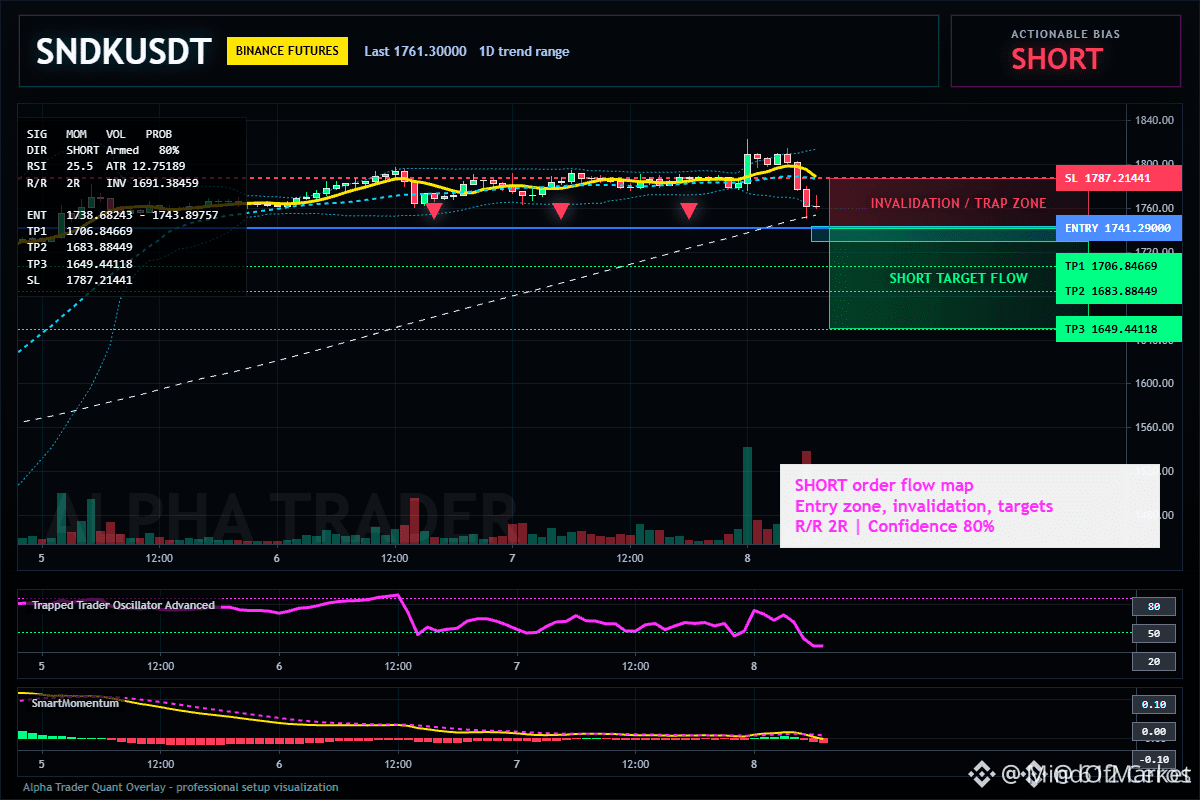
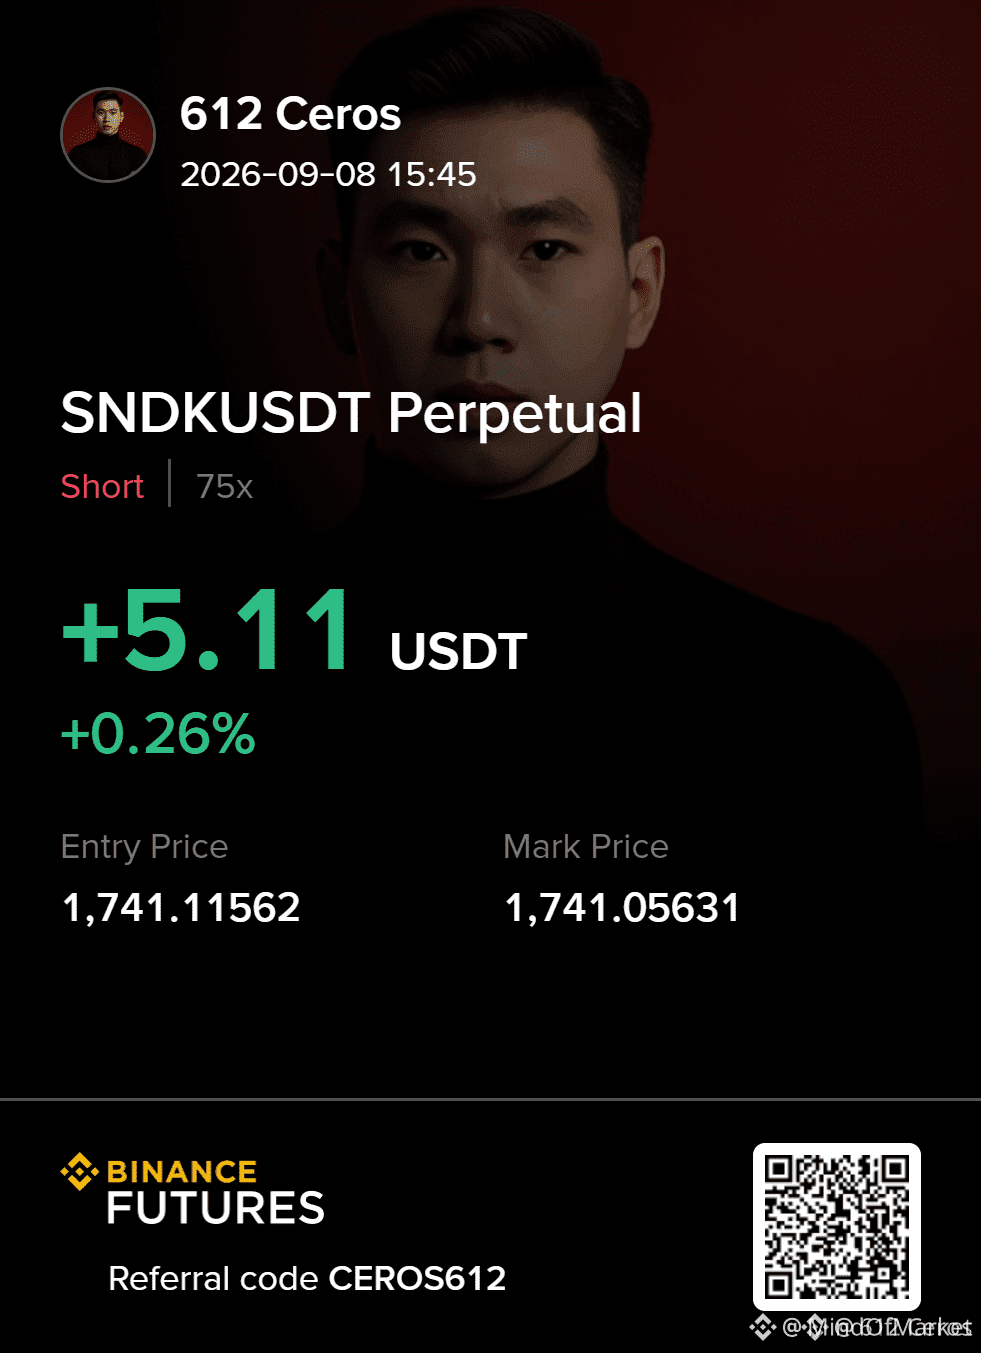
🚨 $SNDK SHORT SETUP ON 15M OVERSOLD SIGNAL – RISK REWARD ON FIRE! ⚡
Entry: 1738.68‑1743.90 ⚡
Target: 1706.85 🚀
Target: 1683.88 🎯
Target: 1649.44 💥
Stop Loss: 1787.21 ⚠️
📊 The 15‑minute RSI plunged to 25.49, flagging a deep downside stretch while the 1‑hour ATR swelled to 12.75, hinting at an imminent volatility burst. 🦈 Smart money is likely harvesting liquidity at the tight 1738‑1744 zone, primed for a sharp wrench lower.
📌 Price rests at 1741.29, cradled between entry bounds, and the hard invalidation line sits at 1691.38. Respect the stop and size down; this counter‑trend bite carries premium risk but offers a clean 1:2+ R‑R profile. 💬 Are you targeting the 1706 pivot or bracing for a squeeze at the 1691 invalidation? 👇
⚠️ Not financial advice. Always manage your risk. 🛡️
🏷️ #SNDK #ShortSetup #Crypto #ATR #RSI
🔥 💎
46
Войдите, чтобы посмотреть больше материала
Присоединяйтесь к пользователям криптовалют по всему миру на Binance Square
⚡️ Получайте новейшую и полезную информацию о криптоактивах.
💬 Нам доверяет крупнейшая в мире криптобиржа.
👍 Получите достоверные аналитические данные от верифицированных создателей контента.
Эл. почта/номер телефона
В тренде
1
#BinancePick
Просмотров: 2.9M
150,181 обсуждают
2
#EarningsSeason
Просмотров: 5.2M
25,603 обсуждают
3
#AnthropicTTMRevenueGrewAbout1200%
Просмотров: 11,039
276 обсуждают
4
#AnthropicS1ExpectedToday
Просмотров: 14,322
248 обсуждают
5
#SouthKoreaReportedlyWeighsFourthCryptoTaxDelay
Просмотров: 21,291
387 обсуждают
6
#FranklinTempletonFilesForTwoDividendToBitcoinETFs
Просмотров: 28,641
483 обсуждают
7
#StrategyMSTRSurpassesNasdaqInMarketCap
Просмотров: 22,052
347 обсуждают
8
#CanadaProposesStablecoinRedemptionWithin3BusinessDays
Просмотров: 999
34 обсуждают
9
#ElectrumWalletBugLetRogueServersStealFunds
Просмотров: 24,710
435 обсуждают
10
#ArgentineCourtDismissesLIBRACaseAgainstMilei
Просмотров: 37,535
537 обсуждают