

#anlysetrendingchart
anlysetrendingchart
Просмотров: 5
2 обсуждают
Популярные
Новые

·
--
Рост
#BinanceExplorers
📊 Mastering Binance Trading: Bullish vs. Bearish Trend Analysis (1D & 3H) 🚀📉
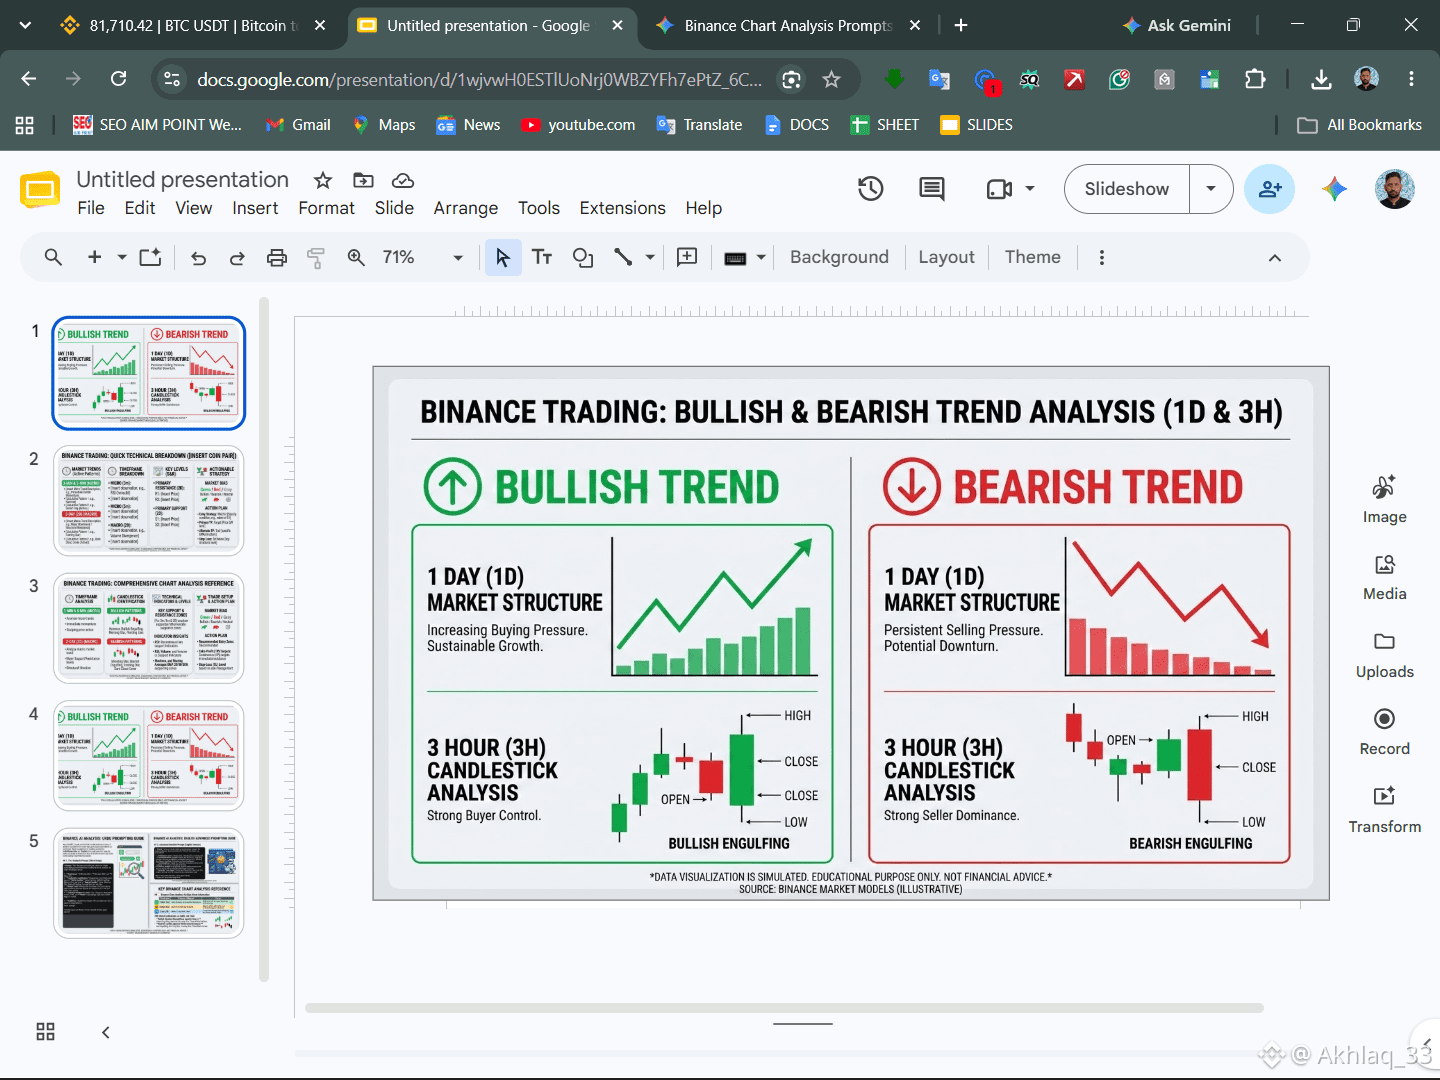
Understanding the connection between macro market structure and micro price action is essential for consistent trading success. This guide breaks down the key differences between Bullish and Bearish market environments using 1-Day (1D) and 3-Hour (3H) timeframes:
🟢 1. Bullish Trend (Uptrend)
1D Market Structure: Characterized by increasing buying pressure and sustainable upward growth. Higher highs and higher lows indicate strong buyer control on the macro scale.
3H Candlestick Analysis: Features powerful reversal patterns like the Bullish Engulfing Candle, signaling aggressive buyer takeover and ideal entry opportunities.
🔴 2. Bearish Trend (Downtrend)
1D Market Structure: Characterized by persistent selling pressure and continuous downside price action. Lower highs and lower lows confirm a structural downturn.
3H Candlestick Analysis: Highlights strong seller dominance with patterns like the Bearish Engulfing Candle, signaling potential distribution or short setups.
💡 Key Takeaway for Traders: Always align your trades with higher timeframe momentum! Use the 1D chart to establish your overall directional bias and the 3H chart for precise entry execution using key candlestick confirmations.
#anlysetrendingchart #CelestiaRises16%To2026High #StrategySharesFall9%OnFriday $BTC
{spot}(BTCUSDT)
#BinanceExplorers
📊 Mastering Binance Trading: Bullish vs. Bearish Trend Analysis (1D & 3H) 🚀📉
Understanding the connection between macro market structure and micro price action is essential for consistent trading success. This guide breaks down the key differences between Bullish and Bearish market environments using 1-Day (1D) and 3-Hour (3H) timeframes:
🟢 1. Bullish Trend (Uptrend)
1D Market Structure: Characterized by increasing buying pressure and sustainable upward growth. Higher highs and higher lows indicate strong buyer control on the macro scale.
3H Candlestick Analysis: Features powerful reversal patterns like the Bullish Engulfing Candle, signaling aggressive buyer takeover and ideal entry opportunities.
🔴 2. Bearish Trend (Downtrend)
1D Market Structure: Characterized by persistent selling pressure and continuous downside price action. Lower highs and lower lows confirm a structural downturn.
3H Candlestick Analysis: Highlights strong seller dominance with patterns like the Bearish Engulfing Candle, signaling potential distribution or short setups.
💡 Key Takeaway for Traders: Always align your trades with higher timeframe momentum! Use the 1D chart to establish your overall directional bias and the 3H chart for precise entry execution using key candlestick confirmations.
#anlysetrendingchart #CelestiaRises16%To2026High #StrategySharesFall9%OnFriday $BTC
40
Войдите, чтобы посмотреть больше материала
Присоединяйтесь к пользователям криптовалют по всему миру на Binance Square
⚡️ Получайте новейшую и полезную информацию о криптоактивах.
💬 Нам доверяет крупнейшая в мире криптобиржа.
👍 Получите достоверные аналитические данные от верифицированных создателей контента.
Эл. почта/номер телефона
В тренде
1
#BinancekzWin
Просмотров: 32,423
94 обсуждают
2
#BinancePick
Просмотров: 2.8M
146,374 обсуждают
3
#EarningsSeason
Просмотров: 5.1M
25,027 обсуждают
4
#AnthropicTTMRevenueGrewAbout1200%
Просмотров: 93
32 обсуждают
5
#AnthropicS1ExpectedToday
Просмотров: 1,165
58 обсуждают
6
#SouthKoreaReportedlyWeighsFourthCryptoTaxDelay
Просмотров: 9,555
231 обсуждают
7
#FranklinTempletonFilesForTwoDividendToBitcoinETFs
Просмотров: 15,866
352 обсуждают
8
#StrategyMSTRSurpassesNasdaqInMarketCap
Просмотров: 13,021
285 обсуждают
9
#CanadaProposesStablecoinRedemptionWithin3BusinessDays
Просмотров: 583
30 обсуждают
10
#ElectrumWalletBugLetRogueServersStealFunds
Просмотров: 17,960
393 обсуждают