
#wsot2026
wsot2026
Просмотров: 384
8 обсуждают
Популярные
Новые

·
--

Статья
🚨MAJOR INSTITUTIONAL INTEREST IN HYPERLIQUID!🐋 Healthcare of Ontario Pension Plan Trust Fund, a major Canadian pension manager with approximately $62 billion in reported assets, disclosed a $35.33 million position in Hyperliquid Strategies. According to its November 13 filing, the fund held 2,879,300 shares as of September 30, 2026. Important detail: this is an investment in the company, not proof of direct HYPE token purchases. 📊 HYPE MARKET UPDATE: - Current Price: $70.37 - 24H Change: -2.89% - 24H Low: $69.48 - 24H High: $75.32 - Market Cap: $17.85B 🏦 Institutional exposure could strengthen confidence in the Hyperliquid ecosystem, but it does not guarantee a token rally. Is this a bullish signal for $HYPE ? #WSOT2026 #TradFiForBeginners $HYPE
🚨MAJOR INSTITUTIONAL INTEREST IN HYPERLIQUID!
🐋 Healthcare of Ontario Pension Plan Trust Fund, a major Canadian pension manager with approximately $62 billion in reported assets, disclosed a $35.33 million position in Hyperliquid Strategies. According to its November 13 filing, the fund held 2,879,300 shares as of September 30, 2026. Important detail: this is an investment in the company, not proof of direct HYPE token purchases. 📊 HYPE MARKET UPDATE: - Current Price: $70.37 - 24H Change: -2.89% - 24H Low: $69.48 - 24H High: $75.32 - Market Cap: $17.85B 🏦 Institutional exposure could strengthen confidence in the Hyperliquid ecosystem, but it does not guarantee a token rally. Is this a bullish signal for $HYPE ? #WSOT2026 #TradFiForBeginners $HYPE
302
·
--
Статья
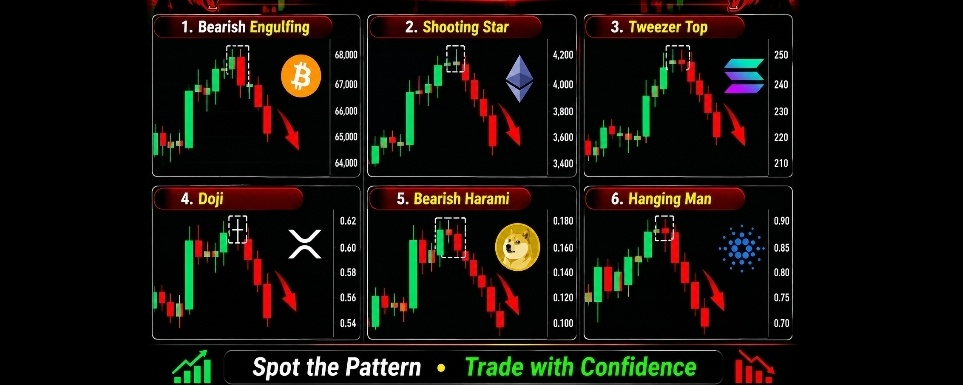
🔴 CRYPTO MARKET FACES SIXTH CONSECUTIVE RED WEEK! The crypto market is experiencing intense selling pressure, with Bitcoin heading toward its sixth consecutive weekly loss. Major cryptocurrencies are falling together, raising concerns among investors. 📉 LATEST PRICE SNAPSHOT (NOV 13): - BTC: $66,456 — down 8.99% weekly - ETH: $1,878.00 — down 12.6% weekly - SOL: $74.85 — down 10.96% weekly - XRP: Around $1.00 ⚠️ WHAT'S DRIVING THE DUMP? More than $1 billion flowed out of Bitcoin ETFs during the week, while approximately $1.56 billion in BTC positions were liquidated. A stronger dollar, higher interest-rate expectations, and weak risk appetite are adding pressure. Is this market manipulation? The synchronized decline looks alarming, but these figures alone do not prove manipulation. Could this sell-off become a major accumulation opportunity, or is more downside coming? #WSOT2026 $BTC $SOL #MANTRAPausesUnstakingFor7DaysAfterKeplrSecurityIncident #WhatWillDriveCryptoandStocks’NextRebound? #USCryptoETFsLose$1.48BInFiveDays
🔴 CRYPTO MARKET FACES SIXTH CONSECUTIVE RED WEEK!
The crypto market is experiencing intense selling pressure, with Bitcoin heading toward its sixth consecutive weekly loss. Major cryptocurrencies are falling together, raising concerns among investors. 📉 LATEST PRICE SNAPSHOT (NOV 13): - BTC: $66,456 — down 8.99% weekly - ETH: $1,878.00 — down 12.6% weekly - SOL: $74.85 — down 10.96% weekly - XRP: Around $1.00 ⚠️ WHAT'S DRIVING THE DUMP? More than $1 billion flowed out of Bitcoin ETFs during the week, while approximately $1.56 billion in BTC positions were liquidated. A stronger dollar, higher interest-rate expectations, and weak risk appetite are adding pressure. Is this market manipulation? The synchronized decline looks alarming, but these figures alone do not prove manipulation. Could this sell-off become a major accumulation opportunity, or is more downside coming? #WSOT2026 $BTC $SOL #MANTRAPausesUnstakingFor7DaysAfterKeplrSecurityIncident #WhatWillDriveCryptoandStocks’NextRebound? #USCryptoETFsLose$1.48BInFiveDays
238

·
--
🚨BREAKING: $140 BILLION IN GOLD MARKET VALUE REPORTEDLY WIPED OUT! A dramatic claim is circulating that approximately $140 billion in gold market value disappeared in just one minute, highlighting the extreme volatility shaking precious-metal markets.
Gold has faced significant selling pressure, recently falling below the important $4,000 per ounce level. On November 12, Reuters reported gold trading around $3,948.82 per ounce, as a stronger US dollar and rising expectations of Federal Reserve rate hikes weighed on prices.
IMPORTANT: The one-minute $140 billion figure has not been independently verified. Market-value losses represent estimated changes in valuation, not necessarily actual money withdrawn.
Will gold recover, or could more downside be ahead?
#WSOT2026 $XAUT #USDT🔥🔥🔥 $BTC $USDT
🚨BREAKING: $140 BILLION IN GOLD MARKET VALUE REPORTEDLY WIPED OUT! A dramatic claim is circulating that approximately $140 billion in gold market value disappeared in just one minute, highlighting the extreme volatility shaking precious-metal markets.
Gold has faced significant selling pressure, recently falling below the important $4,000 per ounce level. On November 12, Reuters reported gold trading around $3,948.82 per ounce, as a stronger US dollar and rising expectations of Federal Reserve rate hikes weighed on prices.
IMPORTANT: The one-minute $140 billion figure has not been independently verified. Market-value losses represent estimated changes in valuation, not necessarily actual money withdrawn.
Will gold recover, or could more downside be ahead?
#WSOT2026 $XAUT #USDT🔥🔥🔥 $BTC $USDT
Gold has faced significant selling pressure, recently falling below the important $4,000 per ounce level. On November 12, Reuters reported gold trading around $3,948.82 per ounce, as a stronger US dollar and rising expectations of Federal Reserve rate hikes weighed on prices.
IMPORTANT: The one-minute $140 billion figure has not been independently verified. Market-value losses represent estimated changes in valuation, not necessarily actual money withdrawn.
Will gold recover, or could more downside be ahead?
#WSOT2026 $XAUT #USDT🔥🔥🔥 $BTC $USDT

289

·
--
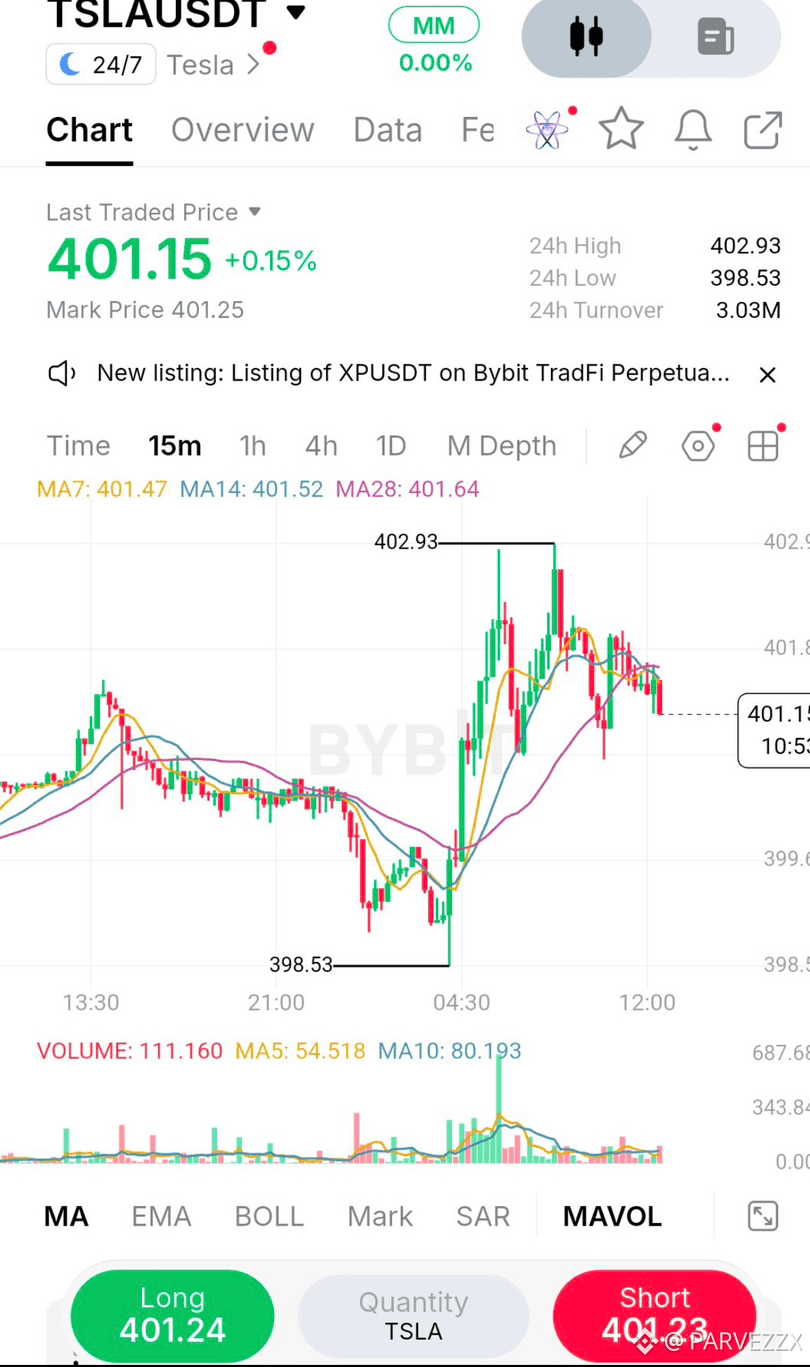
I watched that sharp spike off 398.53 and chose not to chase it. Right now, on the 15m TSLAUSDT chart, price is compressing between 400.50 and the 402.93 high. What stands out is the faded volume following the initial impulse usually a sign buyers are exhausted and a pullback is brewing.
When volume dries up at the highs, it rarely means the move is over; it usually means the market is taking a breath. But if that breath turns into a heavy sell-off without buyers stepping in, the structure shifts quickly. I've been burned before by assuming every tight consolidation is just a pause before continuation. That's why I'm letting the chart come to me instead of forcing an entry mid-range.
I'm waiting for a lower-risk test of structure rather than buying the top. A pullback into 399.50-
400.50 would let me align with the 15m moving averages (currently pinching around 401.50) and the midpoint of that impulse leg. If price pushes straight to 406 without a retest, I simply miss the trade. I'm okay with that. There will be another setup.
Bias: LONG
Entry Zone: $399.50 - $400.50
Confirmation: A bullish 15m close (rejection wick) inside the zone.
Stop / Invalidation: $398.40 (Just below the recent swing low)
TP1: $402.50
TP2: $406.00
R:R: 1:2
The main risk? A complete rejection at 402.93 leaving a double top, or a slow bleed that slices right through 398.53. I won't blindly catch a falling knife; I need to see buyers step in first. My personal rule here: waiting for a retest typically provides a tighter stop and better R:R than entering mid-range. Are you buying this breakout or waiting for the dip?
$TSLAB $BTC
#IMPACTbyTrade #WSOT2026
{spot}(TSLABUSDT)
{future}(BTCUSDT)
I watched that sharp spike off 398.53 and chose not to chase it. Right now, on the 15m TSLAUSDT chart, price is compressing between 400.50 and the 402.93 high. What stands out is the faded volume following the initial impulse usually a sign buyers are exhausted and a pullback is brewing.
When volume dries up at the highs, it rarely means the move is over; it usually means the market is taking a breath. But if that breath turns into a heavy sell-off without buyers stepping in, the structure shifts quickly. I've been burned before by assuming every tight consolidation is just a pause before continuation. That's why I'm letting the chart come to me instead of forcing an entry mid-range.
I'm waiting for a lower-risk test of structure rather than buying the top. A pullback into 399.50-
400.50 would let me align with the 15m moving averages (currently pinching around 401.50) and the midpoint of that impulse leg. If price pushes straight to 406 without a retest, I simply miss the trade. I'm okay with that. There will be another setup.
Bias: LONG
Entry Zone: $399.50 - $400.50
Confirmation: A bullish 15m close (rejection wick) inside the zone.
Stop / Invalidation: $398.40 (Just below the recent swing low)
TP1: $402.50
TP2: $406.00
R:R: 1:2
The main risk? A complete rejection at 402.93 leaving a double top, or a slow bleed that slices right through 398.53. I won't blindly catch a falling knife; I need to see buyers step in first. My personal rule here: waiting for a retest typically provides a tighter stop and better R:R than entering mid-range. Are you buying this breakout or waiting for the dip?
$TSLAB $BTC
#IMPACTbyTrade #WSOT2026
When volume dries up at the highs, it rarely means the move is over; it usually means the market is taking a breath. But if that breath turns into a heavy sell-off without buyers stepping in, the structure shifts quickly. I've been burned before by assuming every tight consolidation is just a pause before continuation. That's why I'm letting the chart come to me instead of forcing an entry mid-range.
I'm waiting for a lower-risk test of structure rather than buying the top. A pullback into 399.50-
400.50 would let me align with the 15m moving averages (currently pinching around 401.50) and the midpoint of that impulse leg. If price pushes straight to 406 without a retest, I simply miss the trade. I'm okay with that. There will be another setup.
Bias: LONG
Entry Zone: $399.50 - $400.50
Confirmation: A bullish 15m close (rejection wick) inside the zone.
Stop / Invalidation: $398.40 (Just below the recent swing low)
TP1: $402.50
TP2: $406.00
R:R: 1:2
The main risk? A complete rejection at 402.93 leaving a double top, or a slow bleed that slices right through 398.53. I won't blindly catch a falling knife; I need to see buyers step in first. My personal rule here: waiting for a retest typically provides a tighter stop and better R:R than entering mid-range. Are you buying this breakout or waiting for the dip?
$TSLAB $BTC
#IMPACTbyTrade #WSOT2026
99
Войдите, чтобы посмотреть больше материала
Присоединяйтесь к пользователям криптовалют по всему миру на Binance Square
⚡️ Получайте новейшую и полезную информацию о криптоактивах.
💬 Нам доверяет крупнейшая в мире криптобиржа.
👍 Получите достоверные аналитические данные от верифицированных создателей контента.
Эл. почта/номер телефона
В тренде
1
#CryptoSelloffTriggersMultipleWhaleLiquidations
Просмотров: 244,526
2,117 обсуждают
2
#HuangReportedlyConsidersReturnToNvidia
Просмотров: 4,081
95 обсуждают
3
#BitcoinSpotETFsPost$1.065BOutflowsForThirdStraightWeek
Просмотров: 0
1 обсуждают
4
#About64000BitcoinMiningMachinesReportedlyHijacked
Просмотров: 2,527
80 обсуждают
5
#USSpotXRPETFsSeeLargestWeeklyOutflowIn8Months
Просмотров: 202,583
1,717 обсуждают
6
#WillFOMCMinutesReinforceRateHikeExpectations?
Просмотров: 74,170
867 обсуждают
7
#BitcoinActiveSupplyInProfitDropsBelow45%
Просмотров: 277,268
1,944 обсуждают
8
#TONStrategyReports$23.97MQ3NetLoss
Просмотров: 23,590
161 обсуждают
9
#KavaSaysAbnormalActivityLimitedToKavaLend
Просмотров: 183,897
1,115 обсуждают
10
#WORPTLetsTouristsConvertCryptoToThaiBaht
Просмотров: 73,744
464 обсуждают