
#volumeprofile
volumeprofile
Просмотров: 52,539
184 обсуждают
Популярные
Новые

·
--
Bitcoin lost the $62K level buyers defended last weekend. So where is the next real support?
BTC slipped to $61,256 on the Binance perp on Friday, its lowest since July, as Fed officials kept a bigger December hike on the table. CoinGlass counted $528M in liquidations in 24 hours, about 80% longs.
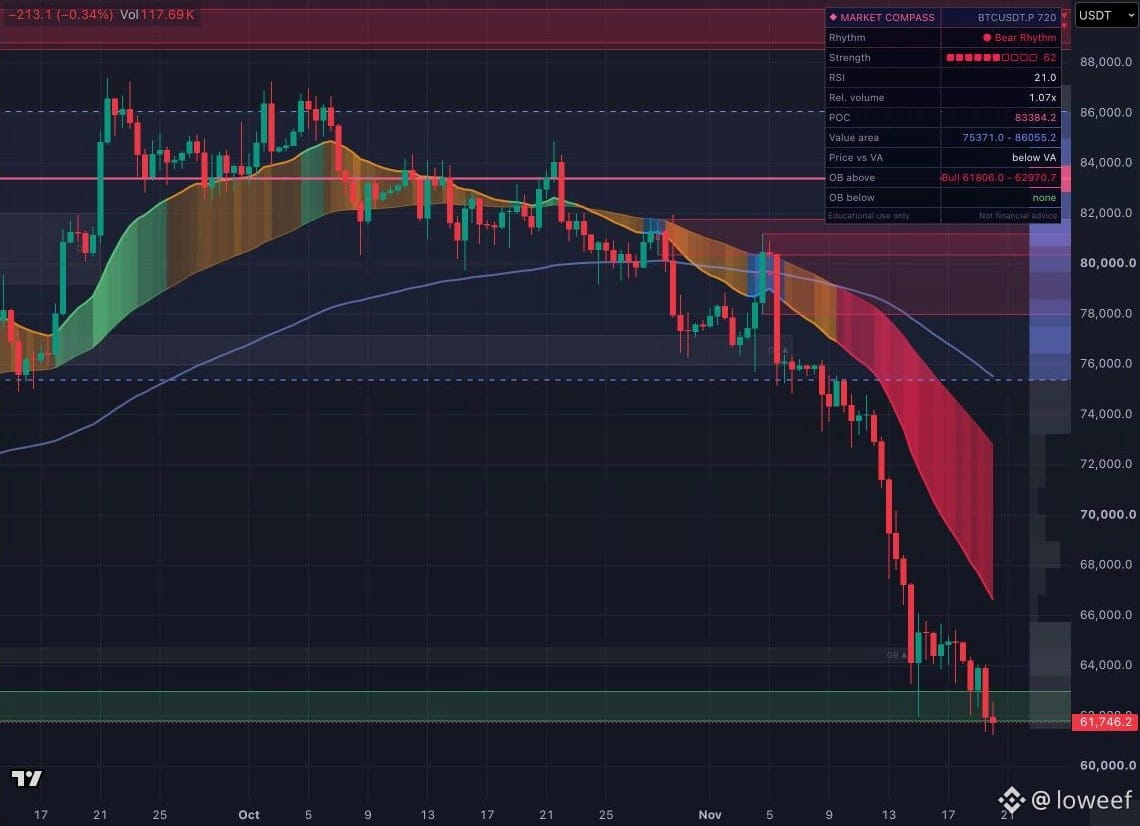
Chart: BTC perp, 12H, with Market Compass, a TradingView indicator built on volume profile and order blocks. Price sits far below the value area ($75.4K-$86.1K), the bullish order block at $61.8K-$63.0K is now overhead, none shows below, and 12H RSI reads 21.
How I read it: the Nov 13-14 drop crossed $72K to $65.5K in two days, a band that holds only about 10% of the last 30 days' volume, and $61.3K is the lowest print of that window. So support from here depends on new buyers, not an old level. Oversold can bounce, but a bounce that stalls inside $61.8K-$63.0K confirms that zone flipped to resistance. A 12H close back above $63K would be the first sign it hasn't.
Is $60K a real floor, or just a round number?
$BTC #BTCBelow$62KAmidHikeFearsAndShiftToAnthropic #bitcoin #volumeprofile
Bitcoin lost the $62K level buyers defended last weekend. So where is the next real support?
BTC slipped to $61,256 on the Binance perp on Friday, its lowest since July, as Fed officials kept a bigger December hike on the table. CoinGlass counted $528M in liquidations in 24 hours, about 80% longs.
Chart: BTC perp, 12H, with Market Compass, a TradingView indicator built on volume profile and order blocks. Price sits far below the value area ($75.4K-$86.1K), the bullish order block at $61.8K-$63.0K is now overhead, none shows below, and 12H RSI reads 21.
How I read it: the Nov 13-14 drop crossed $72K to $65.5K in two days, a band that holds only about 10% of the last 30 days' volume, and $61.3K is the lowest print of that window. So support from here depends on new buyers, not an old level. Oversold can bounce, but a bounce that stalls inside $61.8K-$63.0K confirms that zone flipped to resistance. A 12H close back above $63K would be the first sign it hasn't.
Is $60K a real floor, or just a round number?
$BTC #BTCBelow$62KAmidHikeFearsAndShiftToAnthropic #bitcoin #volumeprofile
BTC slipped to $61,256 on the Binance perp on Friday, its lowest since July, as Fed officials kept a bigger December hike on the table. CoinGlass counted $528M in liquidations in 24 hours, about 80% longs.
Chart: BTC perp, 12H, with Market Compass, a TradingView indicator built on volume profile and order blocks. Price sits far below the value area ($75.4K-$86.1K), the bullish order block at $61.8K-$63.0K is now overhead, none shows below, and 12H RSI reads 21.
How I read it: the Nov 13-14 drop crossed $72K to $65.5K in two days, a band that holds only about 10% of the last 30 days' volume, and $61.3K is the lowest print of that window. So support from here depends on new buyers, not an old level. Oversold can bounce, but a bounce that stalls inside $61.8K-$63.0K confirms that zone flipped to resistance. A 12H close back above $63K would be the first sign it hasn't.
Is $60K a real floor, or just a round number?
$BTC #BTCBelow$62KAmidHikeFearsAndShiftToAnthropic #bitcoin #volumeprofile
100
·
--
At which price did the market trade the most? Here is how to read it on a chart.
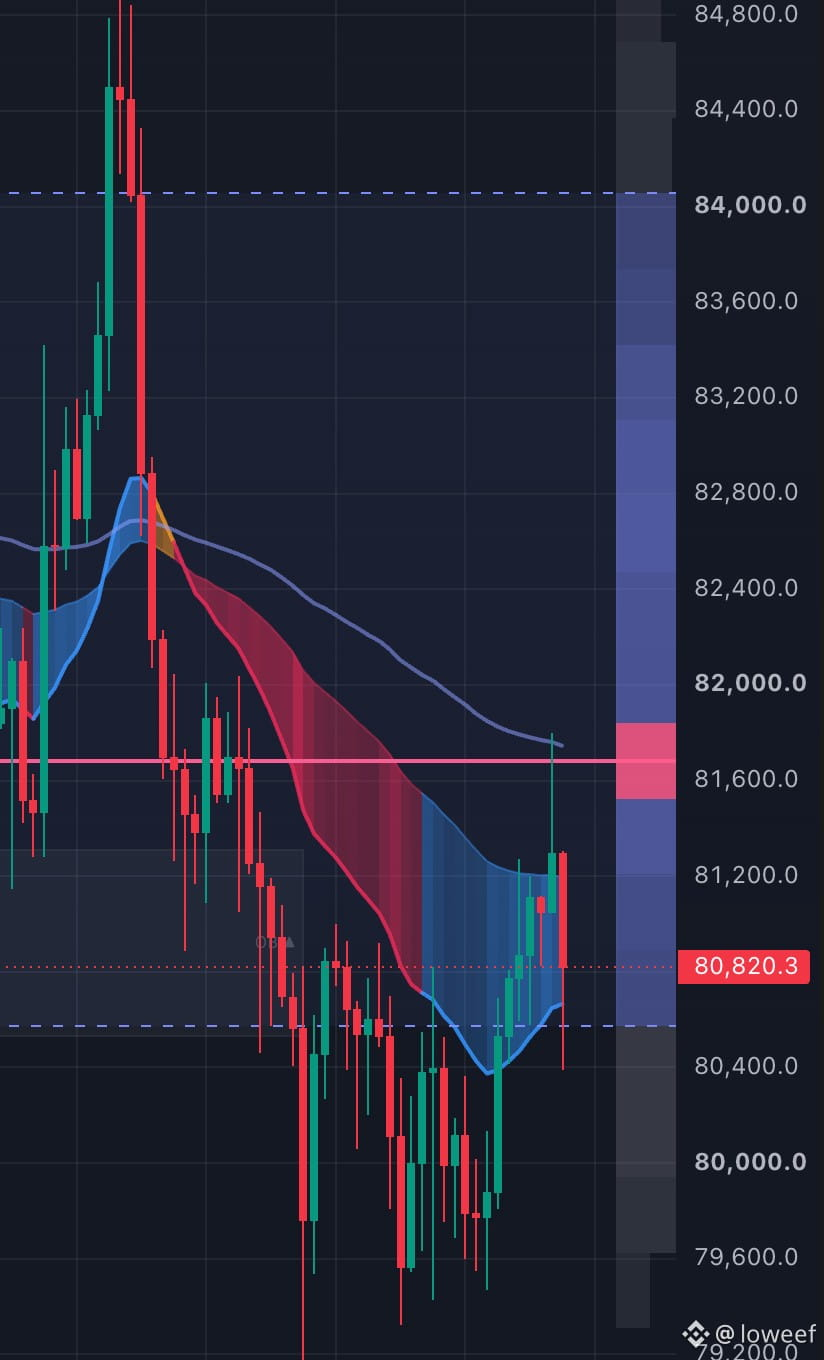
The image shows Market Compass, a TradingView indicator. On the right edge, volume is stacked horizontally by price instead of per candle: that is the volume profile. The longest bar marks the point of control (POC), drawn across the chart as a pink line.
What to look at:
The POC: the price with the most traded volume in the range.
Thin areas in the profile (low volume nodes): price tends to cross them quickly.
Where price sits now: above, below or inside the heavy area.
How I use it: I treat the POC as the price the market agreed on, not as a wall. If price leaves a high volume area and keeps building volume outside it, I stop expecting a return to the old balance. If it leaves on thin volume, a trip back is far more likely.
Do you use volume profile in your analysis, or do you stick to candle volume?
$BTC #VolumeProfile #TechnicalAnalysis
At which price did the market trade the most? Here is how to read it on a chart.
The image shows Market Compass, a TradingView indicator. On the right edge, volume is stacked horizontally by price instead of per candle: that is the volume profile. The longest bar marks the point of control (POC), drawn across the chart as a pink line.
What to look at:
The POC: the price with the most traded volume in the range.
Thin areas in the profile (low volume nodes): price tends to cross them quickly.
Where price sits now: above, below or inside the heavy area.
How I use it: I treat the POC as the price the market agreed on, not as a wall. If price leaves a high volume area and keeps building volume outside it, I stop expecting a return to the old balance. If it leaves on thin volume, a trip back is far more likely.
Do you use volume profile in your analysis, or do you stick to candle volume?
$BTC #VolumeProfile #TechnicalAnalysis
The image shows Market Compass, a TradingView indicator. On the right edge, volume is stacked horizontally by price instead of per candle: that is the volume profile. The longest bar marks the point of control (POC), drawn across the chart as a pink line.
What to look at:
The POC: the price with the most traded volume in the range.
Thin areas in the profile (low volume nodes): price tends to cross them quickly.
Where price sits now: above, below or inside the heavy area.
How I use it: I treat the POC as the price the market agreed on, not as a wall. If price leaves a high volume area and keeps building volume outside it, I stop expecting a return to the old balance. If it leaves on thin volume, a trip back is far more likely.
Do you use volume profile in your analysis, or do you stick to candle volume?
$BTC #VolumeProfile #TechnicalAnalysis
115

$AAPLB $MSFTB 📊 BITCOIN ANALYSIS | POC RETEST BEFORE THE NEXT BULLISH MOVE?
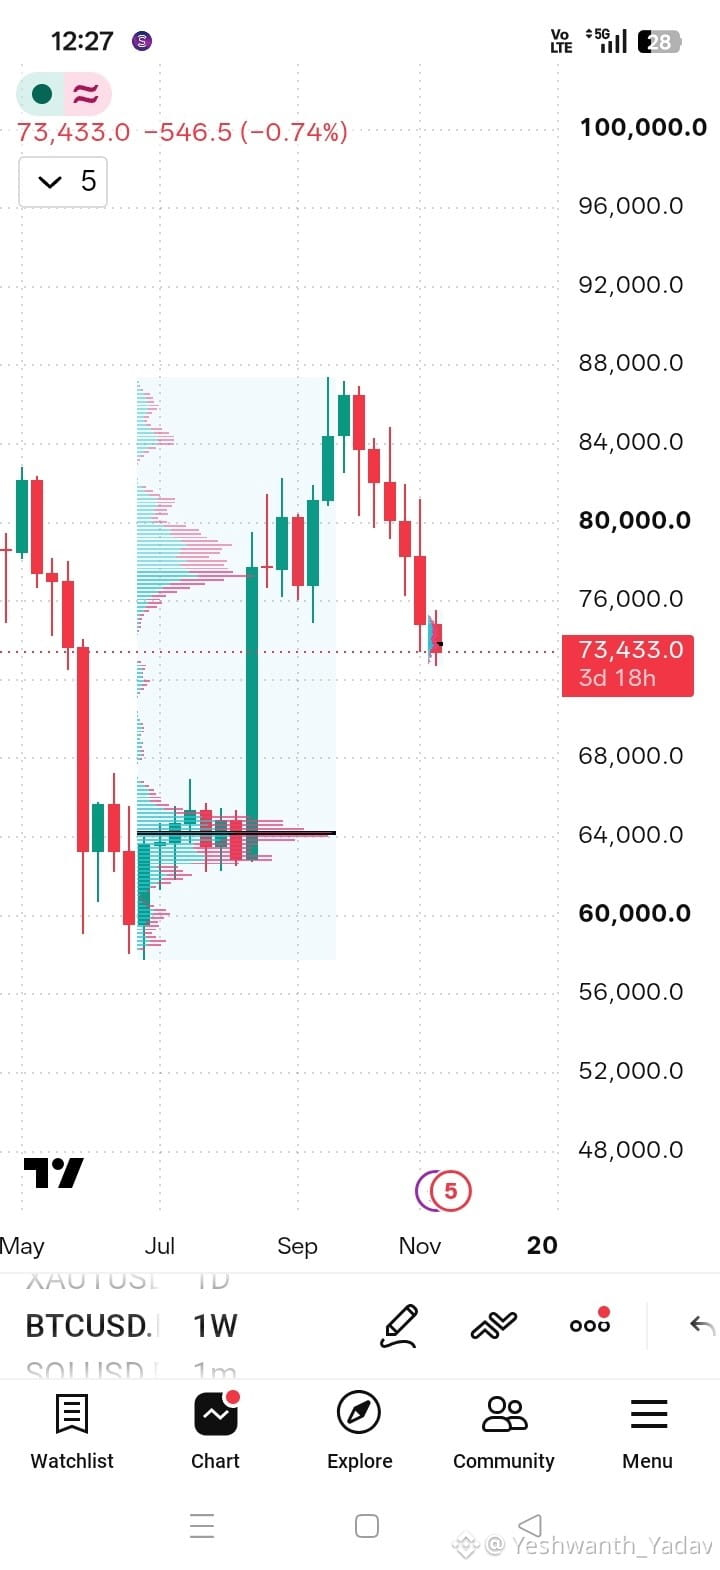
Bitcoin is showing an interesting structure on the 1W timeframe.
My analysis is based on Volume Profile and market structure.
🔍 What I'm Watching:
1️⃣ Point of Control (POC): The major volume concentration is around the $64K zone.
2️⃣ Potential Retest: BTC may move lower to revisit this high-volume area, where significant trading activity previously occurred.
3️⃣ Bullish Possibility: If the POC zone acts as support and buyers step in with strong confirmation, we could see the beginning of another bullish expansion.
📈 My Trading Thesis:
POC Retest → Buyer Confirmation → Potential Bullish Continuation.
⚠️ What Would Confirm My Bias?
- Strong bullish price action around the POC.
- Increased buying volume.
- A confirmed rejection of lower prices.
No confirmation, no trade.
Remember: This is a market hypothesis, not a guaranteed prediction. The POC is an area of interest, not automatic support.
🎯 I'm watching the volume, waiting for the market to reveal its next move.
What's your view? Will BTC revisit the $64K POC before its next bullish expansion?
#Bitcoin #BTC #volumeprofile $MSFTB
$AAPLB $MSFTB 📊 BITCOIN ANALYSIS | POC RETEST BEFORE THE NEXT BULLISH MOVE?
Bitcoin is showing an interesting structure on the 1W timeframe.
My analysis is based on Volume Profile and market structure.
🔍 What I'm Watching:
1️⃣ Point of Control (POC): The major volume concentration is around the $64K zone.
2️⃣ Potential Retest: BTC may move lower to revisit this high-volume area, where significant trading activity previously occurred.
3️⃣ Bullish Possibility: If the POC zone acts as support and buyers step in with strong confirmation, we could see the beginning of another bullish expansion.
📈 My Trading Thesis:
POC Retest → Buyer Confirmation → Potential Bullish Continuation.
⚠️ What Would Confirm My Bias?
- Strong bullish price action around the POC.
- Increased buying volume.
- A confirmed rejection of lower prices.
No confirmation, no trade.
Remember: This is a market hypothesis, not a guaranteed prediction. The POC is an area of interest, not automatic support.
🎯 I'm watching the volume, waiting for the market to reveal its next move.
What's your view? Will BTC revisit the $64K POC before its next bullish expansion?
#Bitcoin #BTC #volumeprofile $MSFTB
Bitcoin is showing an interesting structure on the 1W timeframe.
My analysis is based on Volume Profile and market structure.
🔍 What I'm Watching:
1️⃣ Point of Control (POC): The major volume concentration is around the $64K zone.
2️⃣ Potential Retest: BTC may move lower to revisit this high-volume area, where significant trading activity previously occurred.
3️⃣ Bullish Possibility: If the POC zone acts as support and buyers step in with strong confirmation, we could see the beginning of another bullish expansion.
📈 My Trading Thesis:
POC Retest → Buyer Confirmation → Potential Bullish Continuation.
⚠️ What Would Confirm My Bias?
- Strong bullish price action around the POC.
- Increased buying volume.
- A confirmed rejection of lower prices.
No confirmation, no trade.
Remember: This is a market hypothesis, not a guaranteed prediction. The POC is an area of interest, not automatic support.
🎯 I'm watching the volume, waiting for the market to reveal its next move.
What's your view? Will BTC revisit the $64K POC before its next bullish expansion?
#Bitcoin #BTC #volumeprofile $MSFTB
1
1
177

·
--
Падение
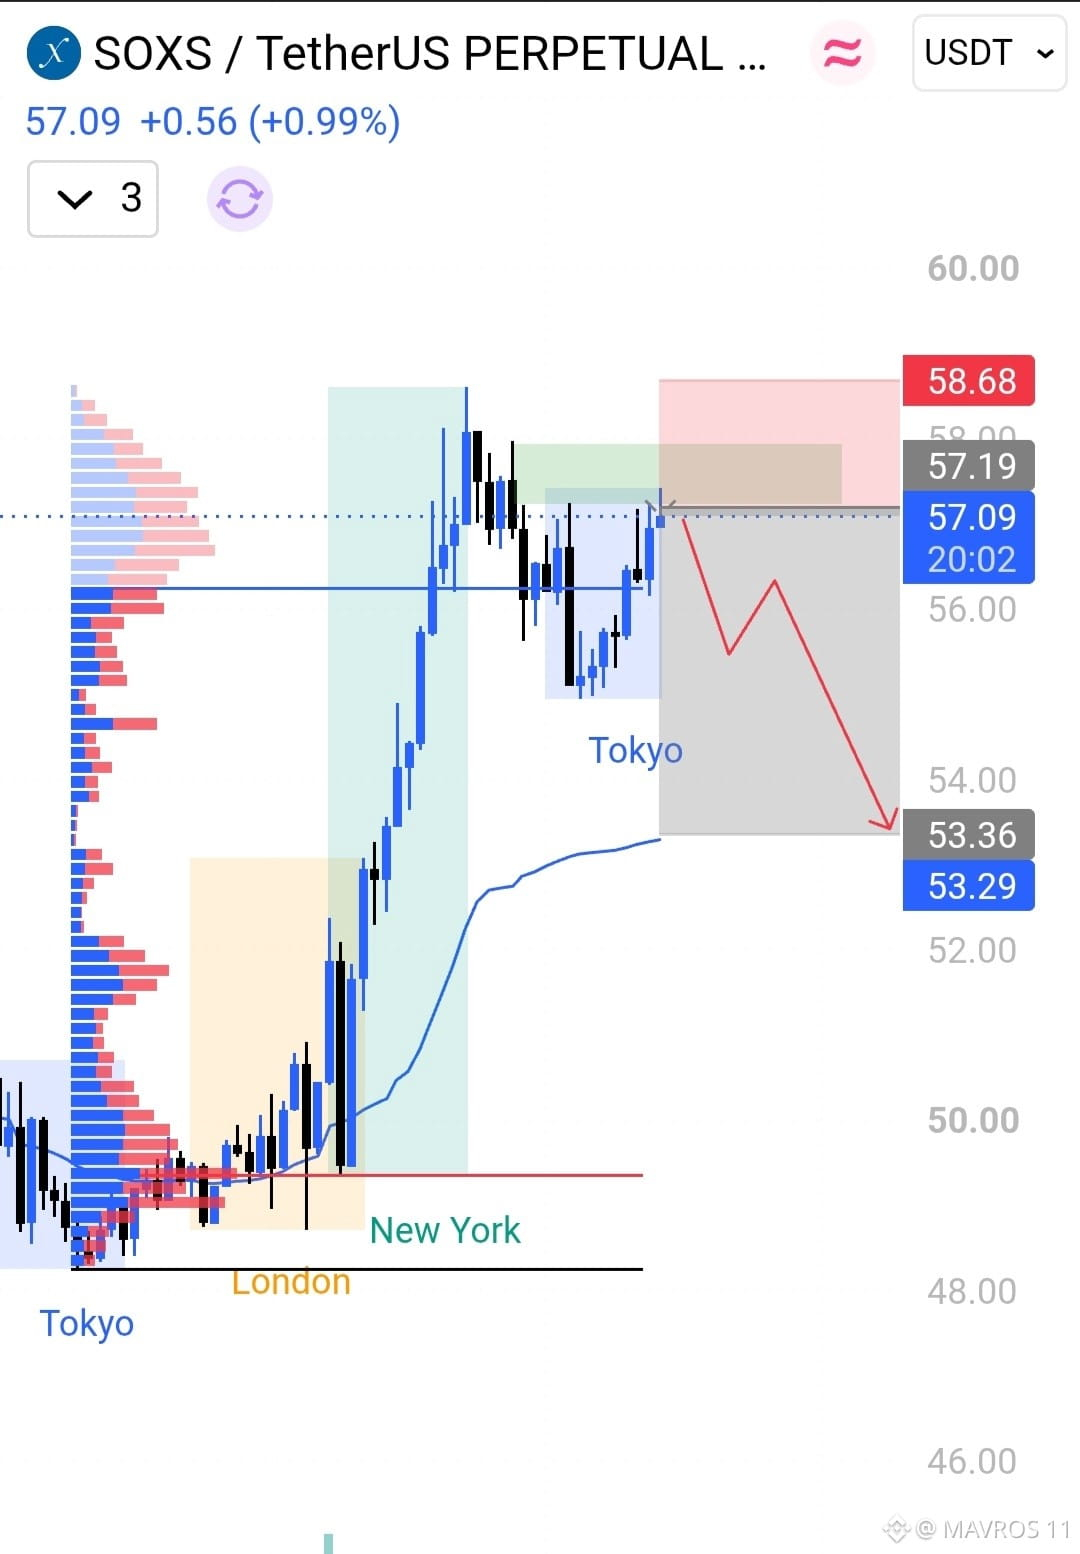
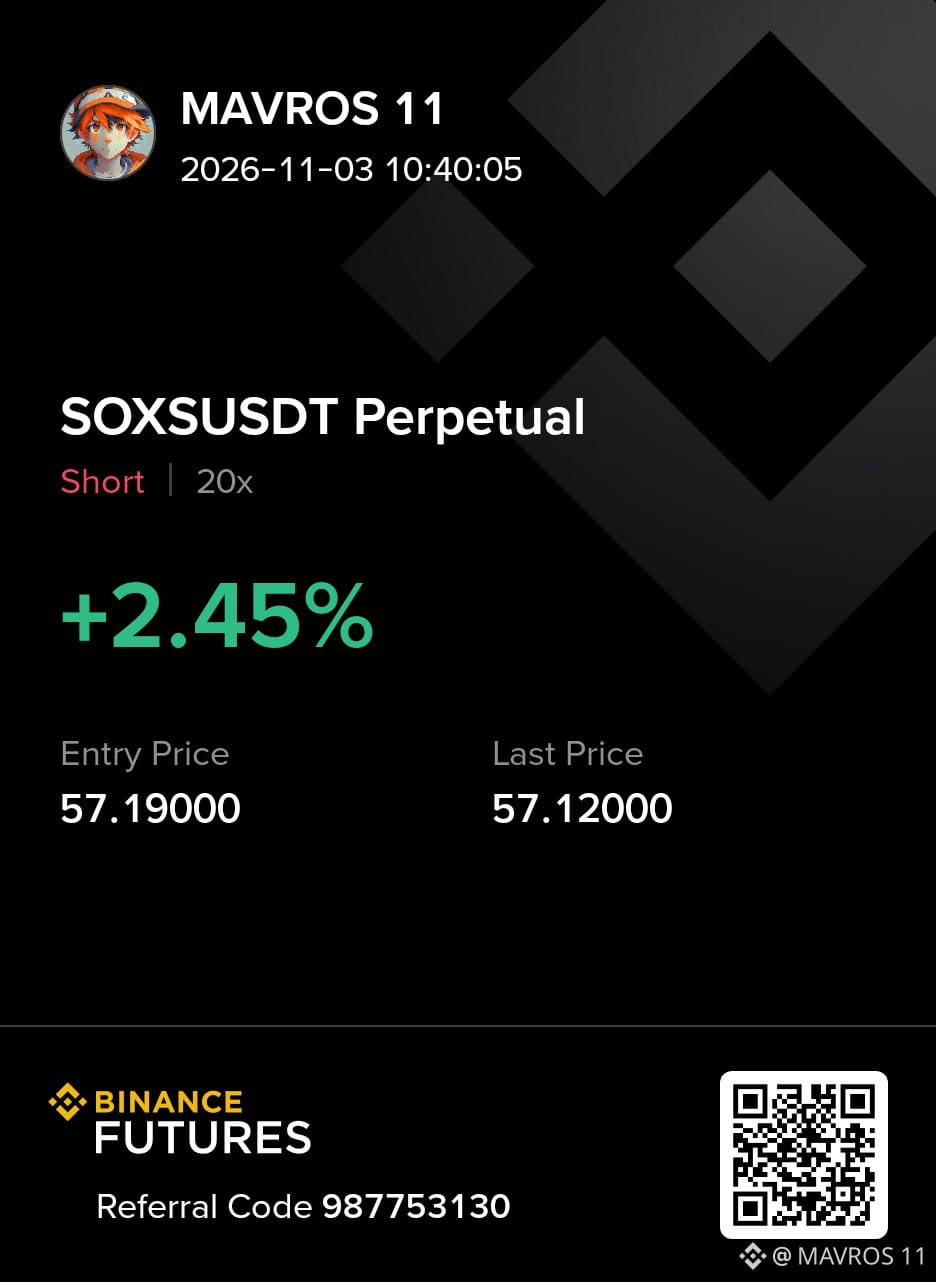
Guy's My simple Volume Profile setup on $SOXS looking for a bigger move down!
If the rejection continues, my downside target is around $53.36. Let's see if sellers can take control from here.
SHORT SIGNAL
Entry: $57.09 – $57.50
Stop Loss: $58.68
TP1: $56.00
TP2: $54.50
TP3: $53.36
This is based on my simple Volume Profile strategy. I'll be watching the reaction around resistance closely.
trade is here 👇 👉 $SOXS $SKDD
{future}(SOXSUSDT)
#SOXS #SOXSUSDT #VolumeProfile
Guy's My simple Volume Profile setup on $SOXS looking for a bigger move down!
If the rejection continues, my downside target is around $53.36. Let's see if sellers can take control from here.
SHORT SIGNAL
Entry: $57.09 – $57.50
Stop Loss: $58.68
TP1: $56.00
TP2: $54.50
TP3: $53.36
This is based on my simple Volume Profile strategy. I'll be watching the reaction around resistance closely.
trade is here 👇 👉 $SOXS $SKDD
#SOXS #SOXSUSDT #VolumeProfile
If the rejection continues, my downside target is around $53.36. Let's see if sellers can take control from here.
SHORT SIGNAL
Entry: $57.09 – $57.50
Stop Loss: $58.68
TP1: $56.00
TP2: $54.50
TP3: $53.36
This is based on my simple Volume Profile strategy. I'll be watching the reaction around resistance closely.
trade is here 👇 👉 $SOXS $SKDD
#SOXS #SOXSUSDT #VolumeProfile
144

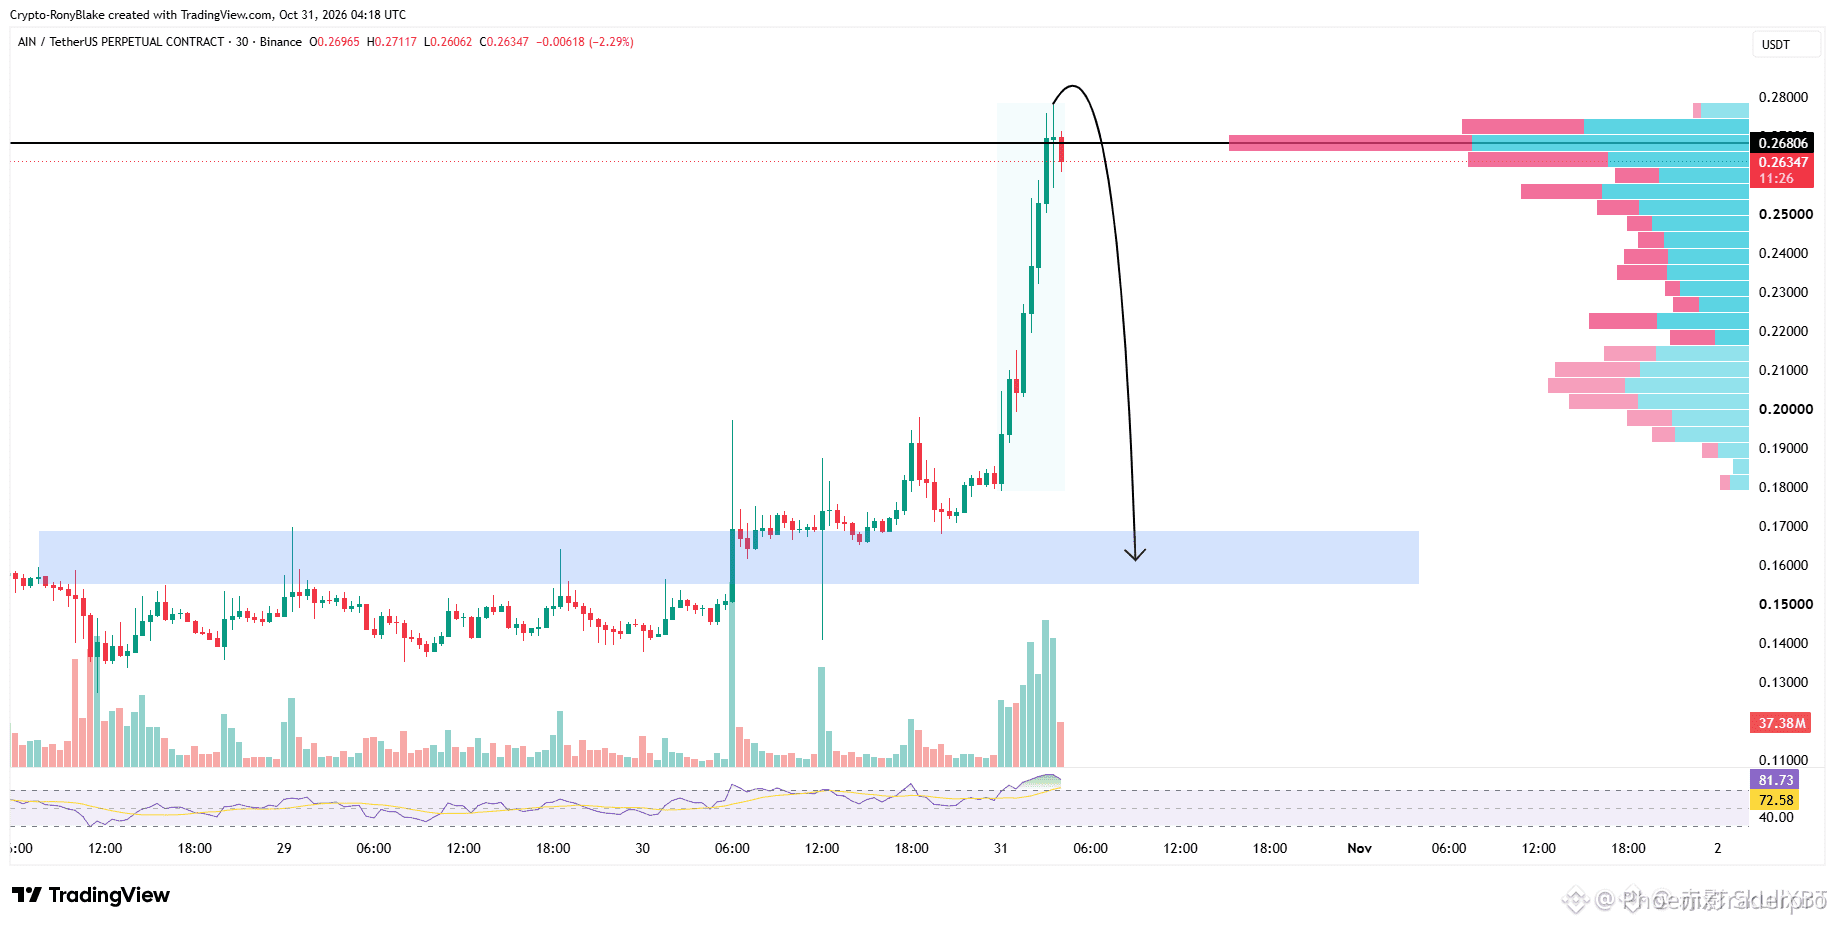
🚨 $AIN TAPS MAJOR OVERHEAD RESISTANCE WITH VOLUME PROFILE FLASHING HEAVY DISTRIBUTION 📉
Target: 0.23 / 0.20 / 0.17 🎯
While retail traders see open skies with zero visible swing resistance, the volume profile reveals a completely different reality. 📊 Hidden order flow shows massive overhead seller defense stacked directly at the peak of this move.
This setup is not about guessing tops in thin air; it comes down to tracking institutional absorption as buy-side momentum dries up. 💡 If price action continues respecting this distribution block, the stage is set for a clean momentum divergence back toward liquidity. 🔍
🤔 Are you positioning for this rollover toward the lower levels, or expecting buyers to punch through?
⚠️ Not financial advice. Always manage your risk. 🛡️
🏷️ #AIN #ShortSetup #VolumeProfile #CryptoTrading
🎯 🦈
🚨 $AIN TAPS MAJOR OVERHEAD RESISTANCE WITH VOLUME PROFILE FLASHING HEAVY DISTRIBUTION 📉
Target: 0.23 / 0.20 / 0.17 🎯
While retail traders see open skies with zero visible swing resistance, the volume profile reveals a completely different reality. 📊 Hidden order flow shows massive overhead seller defense stacked directly at the peak of this move.
This setup is not about guessing tops in thin air; it comes down to tracking institutional absorption as buy-side momentum dries up. 💡 If price action continues respecting this distribution block, the stage is set for a clean momentum divergence back toward liquidity. 🔍
🤔 Are you positioning for this rollover toward the lower levels, or expecting buyers to punch through?
⚠️ Not financial advice. Always manage your risk. 🛡️
🏷️ #AIN #ShortSetup #VolumeProfile #CryptoTrading
🎯 🦈
Target: 0.23 / 0.20 / 0.17 🎯
While retail traders see open skies with zero visible swing resistance, the volume profile reveals a completely different reality. 📊 Hidden order flow shows massive overhead seller defense stacked directly at the peak of this move.
This setup is not about guessing tops in thin air; it comes down to tracking institutional absorption as buy-side momentum dries up. 💡 If price action continues respecting this distribution block, the stage is set for a clean momentum divergence back toward liquidity. 🔍
🤔 Are you positioning for this rollover toward the lower levels, or expecting buyers to punch through?
⚠️ Not financial advice. Always manage your risk. 🛡️
🏷️ #AIN #ShortSetup #VolumeProfile #CryptoTrading
🎯 🦈
15

$CAP AND $RESOLV SHOW TEXTBOOK ACCUMULATION PATTERNS 🔥
Volume profile and price compression on lower timeframes indicate large participants are building positions. The range has tightened into a wedge that historically precedes volatile expansion. On a top-tier exchange, the bid-ask spread has narrowed by 40% in the last six hours, reflecting tightening liquidity.
Is this the base for the next leg higher or just noise before a shakeout?
Not financial advice. Always manage your risk.
#CAP #Accumulation #CryptoSetup #VolumeProfile
🔥
$CAP AND $RESOLV SHOW TEXTBOOK ACCUMULATION PATTERNS 🔥
Volume profile and price compression on lower timeframes indicate large participants are building positions. The range has tightened into a wedge that historically precedes volatile expansion. On a top-tier exchange, the bid-ask spread has narrowed by 40% in the last six hours, reflecting tightening liquidity.
Is this the base for the next leg higher or just noise before a shakeout?
Not financial advice. Always manage your risk.
#CAP #Accumulation #CryptoSetup #VolumeProfile
🔥
Volume profile and price compression on lower timeframes indicate large participants are building positions. The range has tightened into a wedge that historically precedes volatile expansion. On a top-tier exchange, the bid-ask spread has narrowed by 40% in the last six hours, reflecting tightening liquidity.
Is this the base for the next leg higher or just noise before a shakeout?
Not financial advice. Always manage your risk.
#CAP #Accumulation #CryptoSetup #VolumeProfile
🔥
271

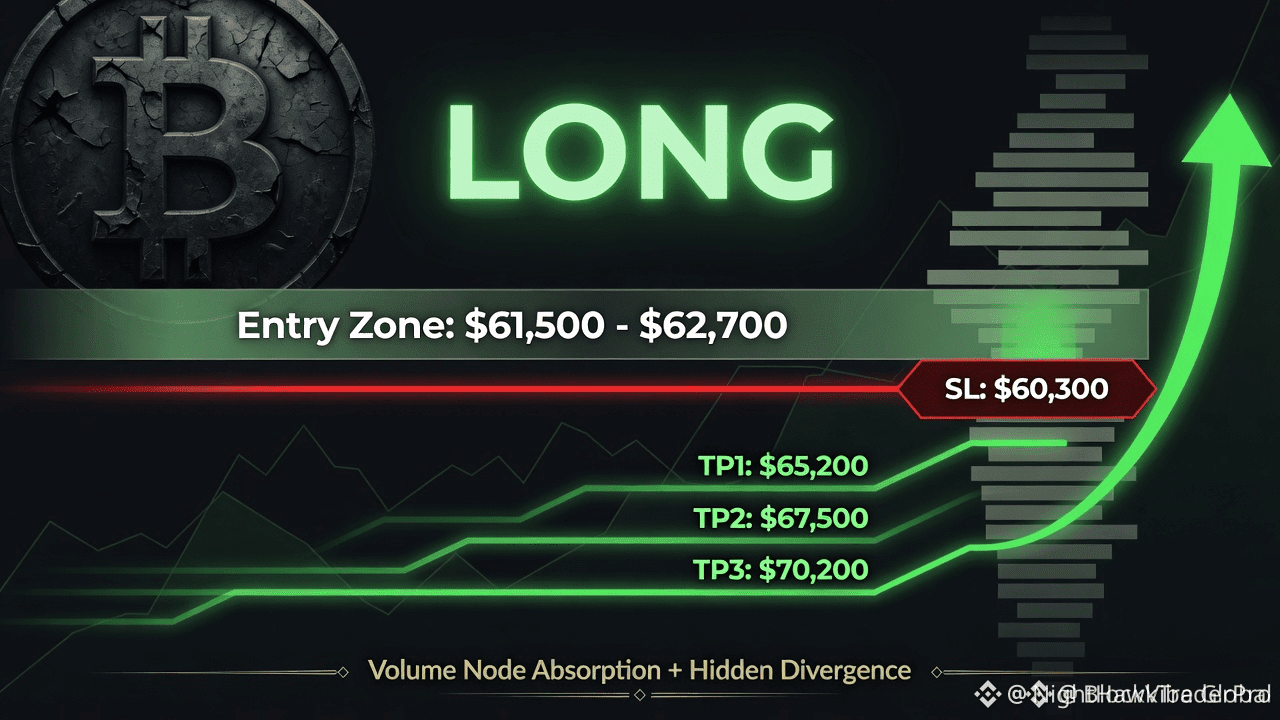
$BTC IS ABSORBING AT THE VOLUME NODE – THE SETUP IS LOADING 🔥
Entry: $61,500 - $62,700 🔥
Target: $65,200 🚀
Stop Loss: $60,300 ⚠️
Price is sitting right inside a high-volume node where aggressive absorption has been confirmed. A hidden bullish divergence just printed on the lower timeframe, and the SL sits cleanly below the invalidation wick. Each TP aligns with liquidity voids above, meaning institutional bids are defending this zone.
The volume profile histogram and higher-low structure both point to one thing — someone is accumulating hard. Are you loading bids at this node or waiting for the breakout candle?
Not financial advice. Always manage your risk.
#BTC #LongSetup #VolumeProfile #Breakout
🔥
$BTC IS ABSORBING AT THE VOLUME NODE – THE SETUP IS LOADING 🔥
Entry: $61,500 - $62,700 🔥
Target: $65,200 🚀
Stop Loss: $60,300 ⚠️
Price is sitting right inside a high-volume node where aggressive absorption has been confirmed. A hidden bullish divergence just printed on the lower timeframe, and the SL sits cleanly below the invalidation wick. Each TP aligns with liquidity voids above, meaning institutional bids are defending this zone.
The volume profile histogram and higher-low structure both point to one thing — someone is accumulating hard. Are you loading bids at this node or waiting for the breakout candle?
Not financial advice. Always manage your risk.
#BTC #LongSetup #VolumeProfile #Breakout
🔥
Entry: $61,500 - $62,700 🔥
Target: $65,200 🚀
Stop Loss: $60,300 ⚠️
Price is sitting right inside a high-volume node where aggressive absorption has been confirmed. A hidden bullish divergence just printed on the lower timeframe, and the SL sits cleanly below the invalidation wick. Each TP aligns with liquidity voids above, meaning institutional bids are defending this zone.
The volume profile histogram and higher-low structure both point to one thing — someone is accumulating hard. Are you loading bids at this node or waiting for the breakout candle?
Not financial advice. Always manage your risk.
#BTC #LongSetup #VolumeProfile #Breakout
🔥
71

·
--
$POL auction rotation shows buyers absorbing inside value area between VAL at 0.07719 and VAH at 0.07912, with a thin book environment. Entry at 0.07768 with bullish delta divergence confirms absorption. Targets TP1 at 0.07912 and TP2 at 0.07937 for..
$POL
$CITY
. #Polygon #VolumeProfile
$POL auction rotation shows buyers absorbing inside value area between VAL at 0.07719 and VAH at 0.07912, with a thin book environment. Entry at 0.07768 with bullish delta divergence confirms absorption. Targets TP1 at 0.07912 and TP2 at 0.07937 for..
$POL
$CITY
. #Polygon #VolumeProfile
$POL
$CITY
. #Polygon #VolumeProfile
1
213

·
--
Падение
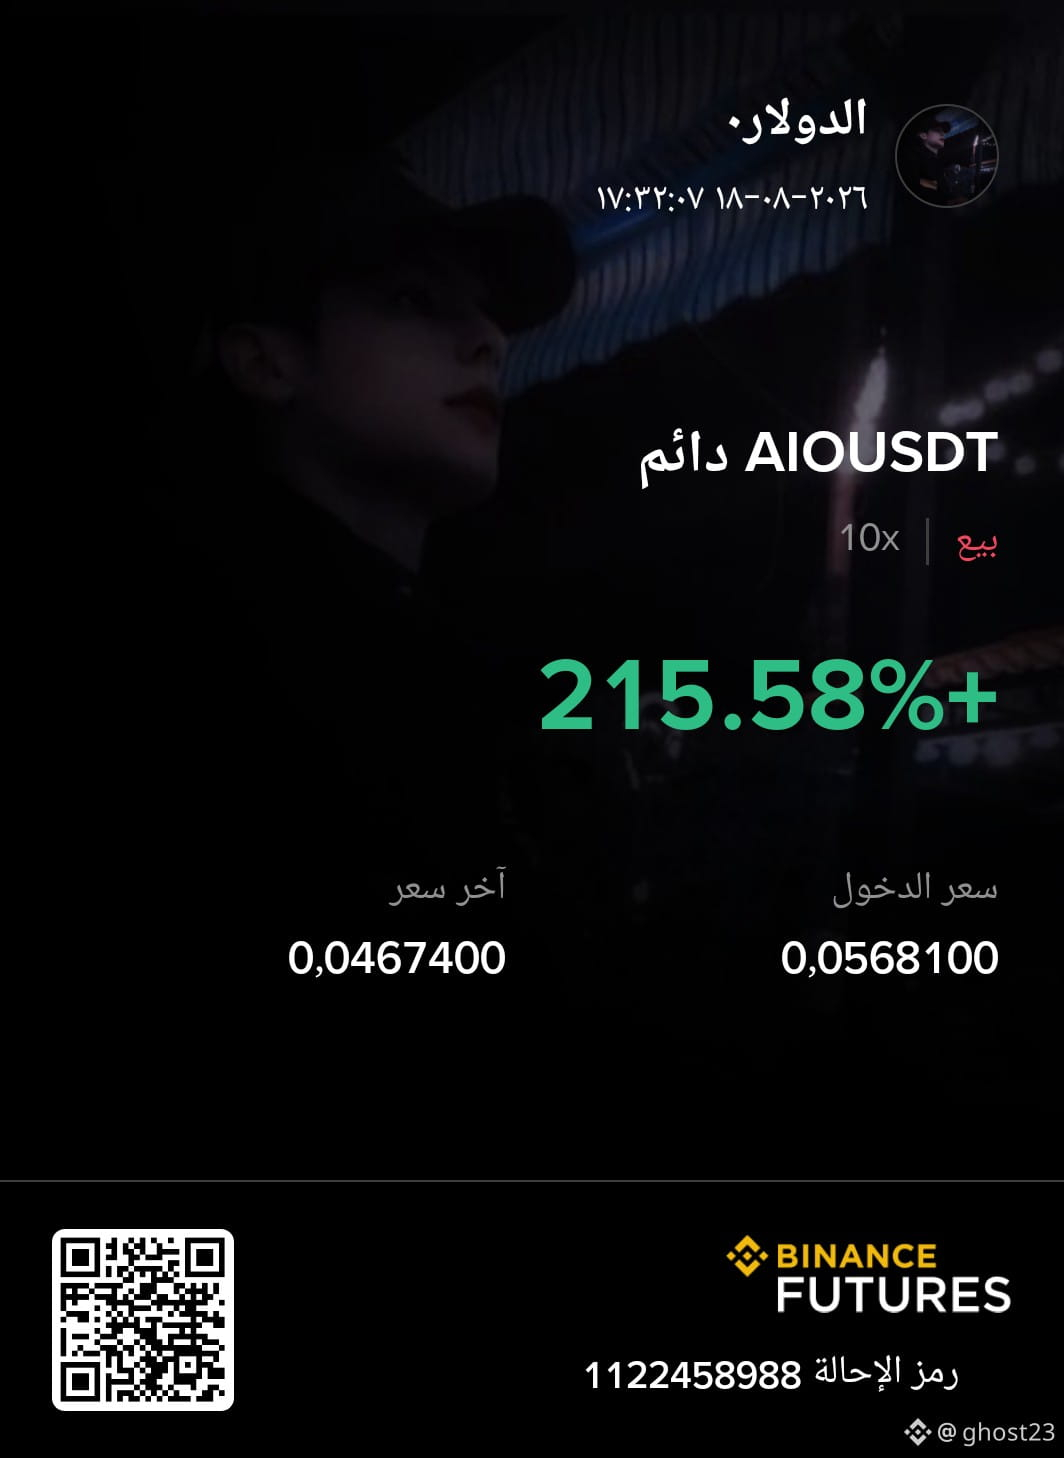
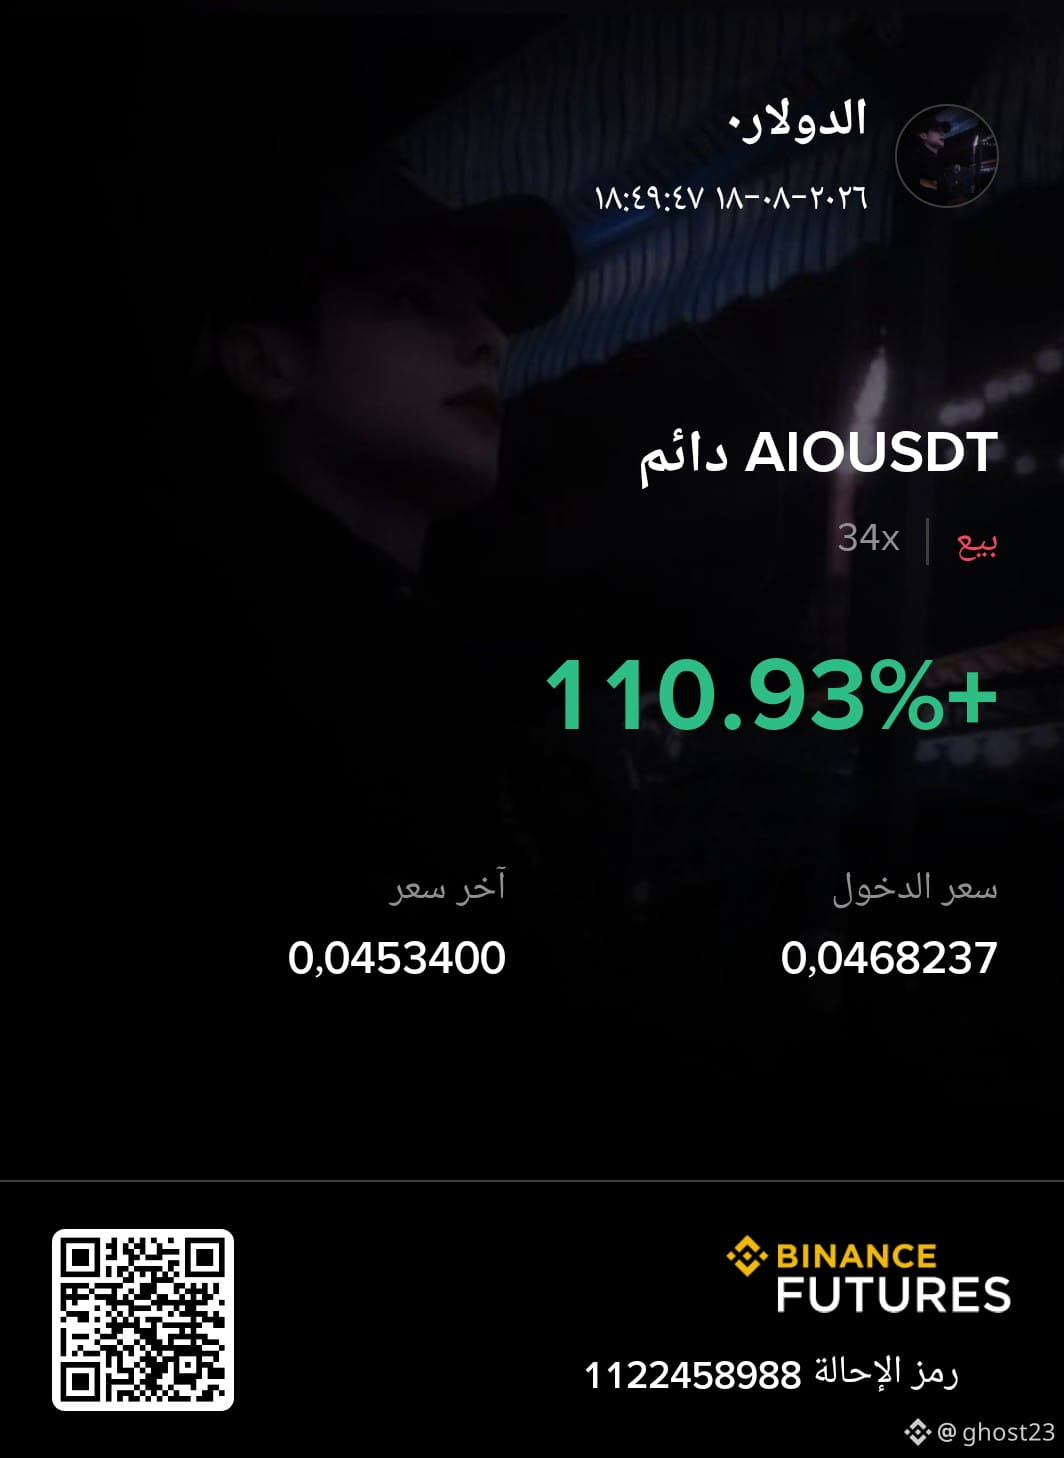
3 أيام من القنص المستمر على AIO/USDT! 🎯🔥
صفقة بعد صفقة.. الأرباح تتوالى (+110%، +215%) بنفس الدقة والالتزام! 📉⚡
عندما تقرأ الشارت بناءً على السيولة والـ Volume Profile، يتحول التداول من مجرد حظ إلى تنفيذ احترافي لسيناريو محدد. لا نلاحق السوق، بل ننتظر وصول السعر لمناطقنا ونقتنص الحركة!
المعادلة بسيطة: انضباط + إدارة مخاطر = نتائج مستمرة. 🚀💪 😁
#AIOUSDT #$AIO #TradingResults #VolumeProfile #BinanceSquare #TradingResu
3 أيام من القنص المستمر على AIO/USDT! 🎯🔥
صفقة بعد صفقة.. الأرباح تتوالى (+110%، +215%) بنفس الدقة والالتزام! 📉⚡
عندما تقرأ الشارت بناءً على السيولة والـ Volume Profile، يتحول التداول من مجرد حظ إلى تنفيذ احترافي لسيناريو محدد. لا نلاحق السوق، بل ننتظر وصول السعر لمناطقنا ونقتنص الحركة!
المعادلة بسيطة: انضباط + إدارة مخاطر = نتائج مستمرة. 🚀💪 😁
#AIOUSDT #$AIO #TradingResults #VolumeProfile #BinanceSquare #TradingResu
صفقة بعد صفقة.. الأرباح تتوالى (+110%، +215%) بنفس الدقة والالتزام! 📉⚡
عندما تقرأ الشارت بناءً على السيولة والـ Volume Profile، يتحول التداول من مجرد حظ إلى تنفيذ احترافي لسيناريو محدد. لا نلاحق السوق، بل ننتظر وصول السعر لمناطقنا ونقتنص الحركة!
المعادلة بسيطة: انضباط + إدارة مخاطر = نتائج مستمرة. 🚀💪 😁
#AIOUSDT #$AIO #TradingResults #VolumeProfile #BinanceSquare #TradingResu
372

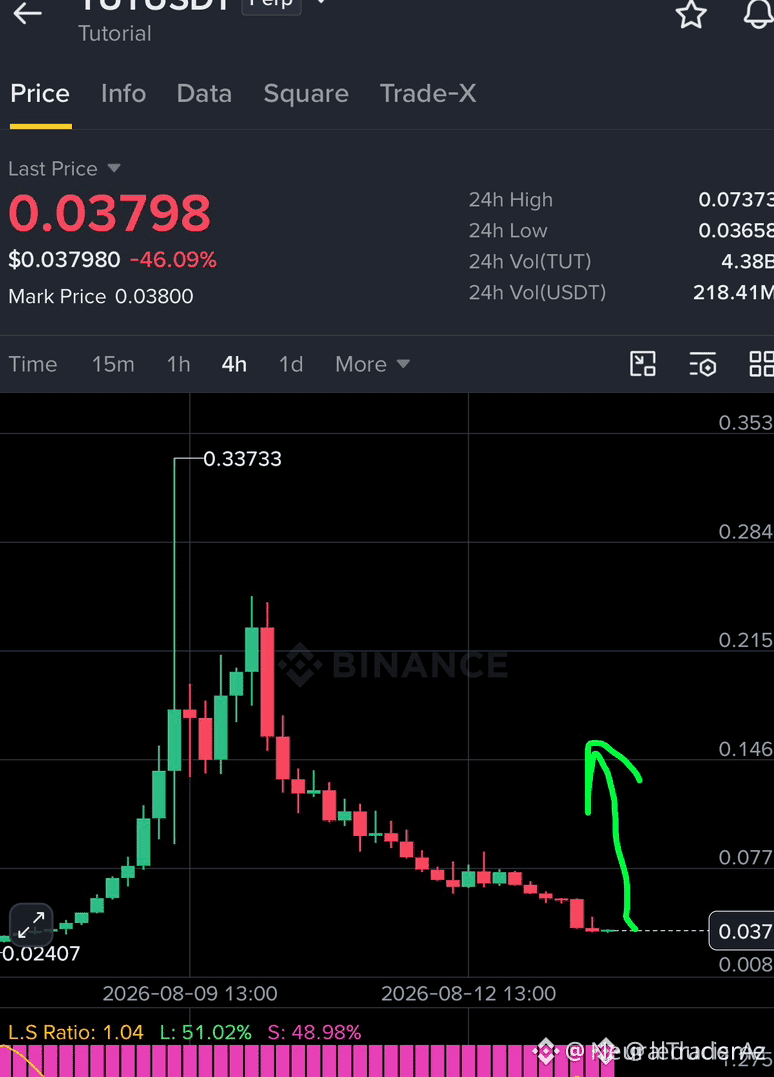
$TUT IGNITES OFF THE FLOOR — DEAD ZONE TURNS INTO A VOLUME BOMB 🔥🚀
Bottomed-out weeks of damp consolidation had most writing this one off. The tape tells a different story now — a vertical structure with conviction behind it. When liquidity thins at the lows and a flush volume spike lands like that, it usually marks the shift in control. This is the footprint you want to see before a breakout sequence. 🧐
The push is climbing through prior overhead supply with buyers stepping in aggressively. Momentum like this often runs in waves — first leg is only the warm-up. The market is basically telegraphing intent right in the open book. Watch how price holds any retest of the newly reclaimed zone. That tells you if this run has another gear. 📊
Smart money doesn't accumulate quietly in a vacuum — it leaves tracks in the volume profile. This one's got a trail you can follow. Where do you see the next liquidity pool getting swept on this ascent? Drop your read below. 👇
⚠️ Not financial advice. Always manage your risk. 🛡️
🏷️ $TUT #CryptoSignals #VolumeProfile #SmartMoney #TradingSetup
💎📈
$TUT IGNITES OFF THE FLOOR — DEAD ZONE TURNS INTO A VOLUME BOMB 🔥🚀
Bottomed-out weeks of damp consolidation had most writing this one off. The tape tells a different story now — a vertical structure with conviction behind it. When liquidity thins at the lows and a flush volume spike lands like that, it usually marks the shift in control. This is the footprint you want to see before a breakout sequence. 🧐
The push is climbing through prior overhead supply with buyers stepping in aggressively. Momentum like this often runs in waves — first leg is only the warm-up. The market is basically telegraphing intent right in the open book. Watch how price holds any retest of the newly reclaimed zone. That tells you if this run has another gear. 📊
Smart money doesn't accumulate quietly in a vacuum — it leaves tracks in the volume profile. This one's got a trail you can follow. Where do you see the next liquidity pool getting swept on this ascent? Drop your read below. 👇
⚠️ Not financial advice. Always manage your risk. 🛡️
🏷️ $TUT #CryptoSignals #VolumeProfile #SmartMoney #TradingSetup
💎📈
Bottomed-out weeks of damp consolidation had most writing this one off. The tape tells a different story now — a vertical structure with conviction behind it. When liquidity thins at the lows and a flush volume spike lands like that, it usually marks the shift in control. This is the footprint you want to see before a breakout sequence. 🧐
The push is climbing through prior overhead supply with buyers stepping in aggressively. Momentum like this often runs in waves — first leg is only the warm-up. The market is basically telegraphing intent right in the open book. Watch how price holds any retest of the newly reclaimed zone. That tells you if this run has another gear. 📊
Smart money doesn't accumulate quietly in a vacuum — it leaves tracks in the volume profile. This one's got a trail you can follow. Where do you see the next liquidity pool getting swept on this ascent? Drop your read below. 👇
⚠️ Not financial advice. Always manage your risk. 🛡️
🏷️ $TUT #CryptoSignals #VolumeProfile #SmartMoney #TradingSetup
💎📈
1
232

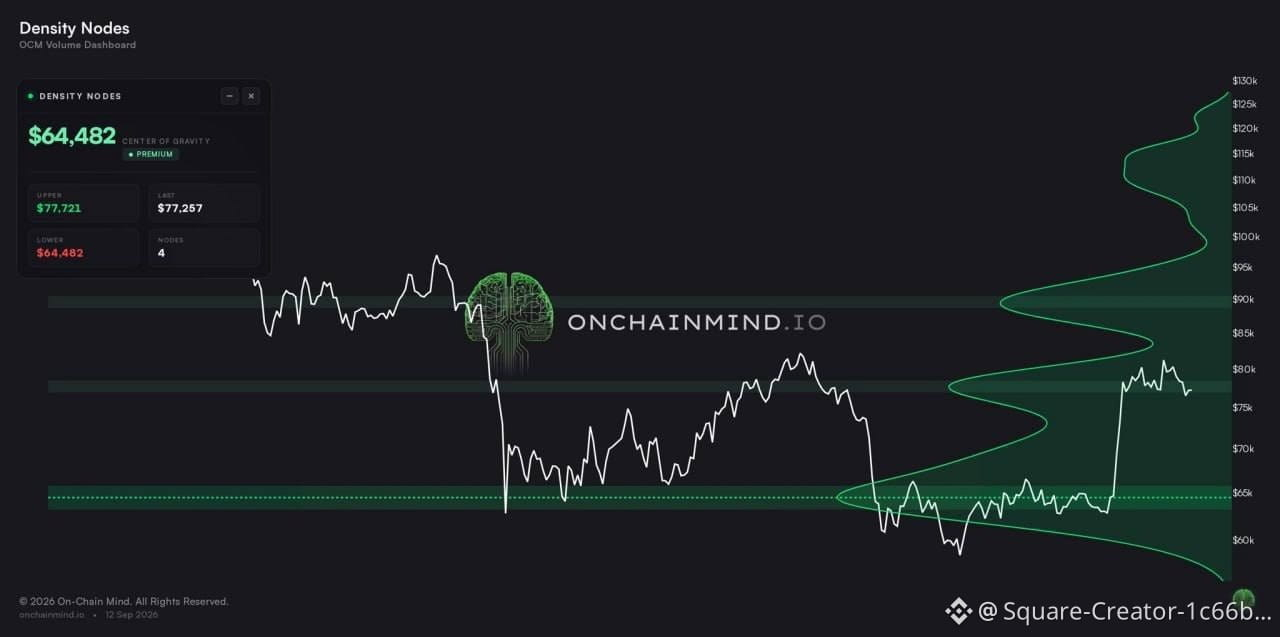
💰 لا يزال مركز الثقل لكثافة أحجام تداول بيتكوين (BTC) عند مستوى 64,000 دولار، وهو مستوى منطقي بالنظر إلى حجم التداول المتراكم حوله.
حاليًا، يتداول السعر ضمن العقدة التالية الأكبر قرب 77,000 دولار، ما يجعلها منطقة محورية لمراقبة تفاعل السعر والسيولة.
📈 في حال امتد الزخم الصاعد من هذه المنطقة، فقد يصبح مستوى 90,000 دولار منطقة محتملة يستقر حولها السعر لاحقًا.
⚠️ هذه قراءة مبنية على توزيع أحجام التداول والسيولة، وليست ضمانًا لاتجاه السعر. تبقى حركة BTC مرتبطة بالطلب الفعلي، أحجام التداول، والظروف العامة للسوق.
$BTC
{future}(BTCUSDT)
#BTC #Bitcoin #VolumeProfile #CryptoAnalysis #تحليل_فني #بيتكوين #العملات_الرقمية #سوق_الكريبتو #تداول
💰 لا يزال مركز الثقل لكثافة أحجام تداول بيتكوين (BTC) عند مستوى 64,000 دولار، وهو مستوى منطقي بالنظر إلى حجم التداول المتراكم حوله.
حاليًا، يتداول السعر ضمن العقدة التالية الأكبر قرب 77,000 دولار، ما يجعلها منطقة محورية لمراقبة تفاعل السعر والسيولة.
📈 في حال امتد الزخم الصاعد من هذه المنطقة، فقد يصبح مستوى 90,000 دولار منطقة محتملة يستقر حولها السعر لاحقًا.
⚠️ هذه قراءة مبنية على توزيع أحجام التداول والسيولة، وليست ضمانًا لاتجاه السعر. تبقى حركة BTC مرتبطة بالطلب الفعلي، أحجام التداول، والظروف العامة للسوق.
$BTC
#BTC #Bitcoin #VolumeProfile #CryptoAnalysis #تحليل_فني #بيتكوين #العملات_الرقمية #سوق_الكريبتو #تداول
حاليًا، يتداول السعر ضمن العقدة التالية الأكبر قرب 77,000 دولار، ما يجعلها منطقة محورية لمراقبة تفاعل السعر والسيولة.
📈 في حال امتد الزخم الصاعد من هذه المنطقة، فقد يصبح مستوى 90,000 دولار منطقة محتملة يستقر حولها السعر لاحقًا.
⚠️ هذه قراءة مبنية على توزيع أحجام التداول والسيولة، وليست ضمانًا لاتجاه السعر. تبقى حركة BTC مرتبطة بالطلب الفعلي، أحجام التداول، والظروف العامة للسوق.
$BTC
#BTC #Bitcoin #VolumeProfile #CryptoAnalysis #تحليل_فني #بيتكوين #العملات_الرقمية #سوق_الكريبتو #تداول
84

·
--
Статья
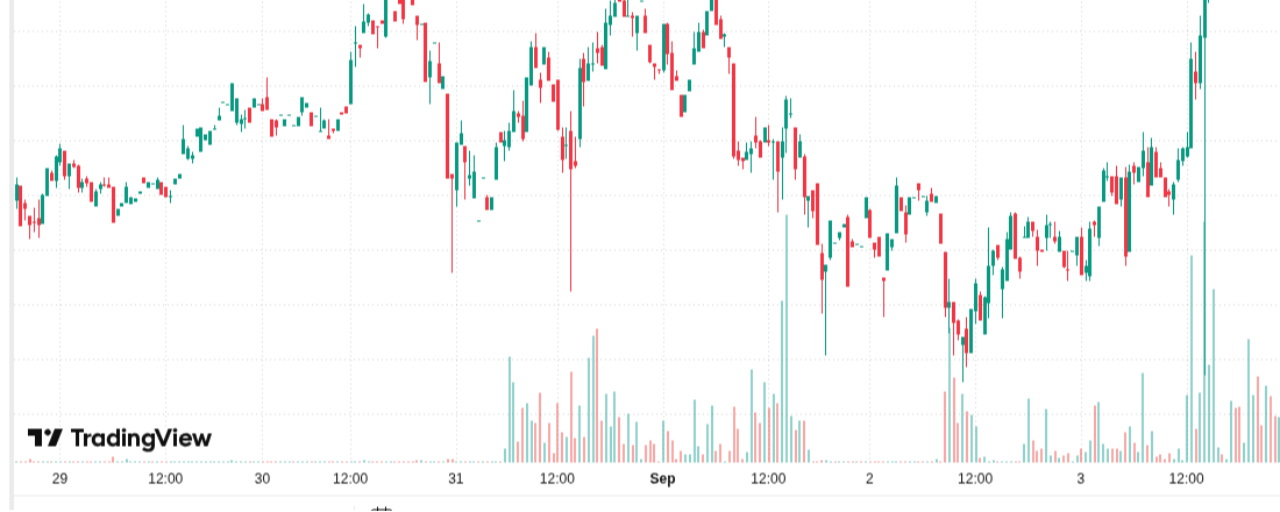
The Chart Pattern That Tells You Where the "Smart Money" Actually IsMost people look at a candle and see price. Professionals look at the same chart and see an auction — and today's $BTC profile is a genuinely clean example of how to read one.
Volume Profile maps how much trading actually happened at each price level, not just where price visited. The tallest bar is the Point of Control (POC) — right now that's $79,724, where maximum agreement between buyers and sellers has piled up. Above and below that, you get High-Volume Nodes (HVNs) — like today's zones at $81,353 and $78,641 — where price tends to compress and chop because there's plenty of liquidity for big orders to fill quietly. In between sits a Low-Volume Node (LVN) around $80,500 — a thin gap where almost nothing traded. Price treats LVNs like a vacuum: once it enters one, it usually sprints straight through rather than lingering, because there's no liquidity to slow it down.
Here's the part retail skips: POC migration. If BTC breaks above $81,353 and holds there for 48 hours, the obvious move is to assume the breakout is real. But watch where the POC actually sits during that move. If the tallest volume bar stays pinned at $79,724 even while price trades higher, that's institutions refusing to transact at the new level — a bearish divergence warning of a fakeout. If the POC itself shifts up to match price, that's confirmation real capital is accepting the new range.
Shape matters too. A balanced "D-shape" profile (POC centered, symmetric) gets mean-reverted — sell the ceiling, buy the floor, target the POC. A "P-shape," fat on top and thin on the bottom, marks a short squeeze where the thin tail becomes support. A "b-shape," fat on the bottom and thin on top, marks long liquidation, where that thin upper stalk becomes tough resistance on any bounce.
One more concept worth filing away: the Naked POC. When a session prints a sharp volume peak and price gaps away without ever revisiting it, that level becomes a "virgin" magnet — a pile of historical institutional orders left untouched. If BTC ever corrects hard from today's Greed levels, those old NPOCs are exactly where desks look first for high-probability dip zones.
So next time price breaks a level and everyone's celebrating — are you watching the candle, or are you checking whether the volume actually followed it there?
#smartmoney #volumeprofile
The Chart Pattern That Tells You Where the "Smart Money" Actually Is
Most people look at a candle and see price. Professionals look at the same chart and see an auction — and today's $BTC profile is a genuinely clean example of how to read one.
Volume Profile maps how much trading actually happened at each price level, not just where price visited. The tallest bar is the Point of Control (POC) — right now that's $79,724, where maximum agreement between buyers and sellers has piled up. Above and below that, you get High-Volume Nodes (HVNs) — like today's zones at $81,353 and $78,641 — where price tends to compress and chop because there's plenty of liquidity for big orders to fill quietly. In between sits a Low-Volume Node (LVN) around $80,500 — a thin gap where almost nothing traded. Price treats LVNs like a vacuum: once it enters one, it usually sprints straight through rather than lingering, because there's no liquidity to slow it down.
Here's the part retail skips: POC migration. If BTC breaks above $81,353 and holds there for 48 hours, the obvious move is to assume the breakout is real. But watch where the POC actually sits during that move. If the tallest volume bar stays pinned at $79,724 even while price trades higher, that's institutions refusing to transact at the new level — a bearish divergence warning of a fakeout. If the POC itself shifts up to match price, that's confirmation real capital is accepting the new range.
Shape matters too. A balanced "D-shape" profile (POC centered, symmetric) gets mean-reverted — sell the ceiling, buy the floor, target the POC. A "P-shape," fat on top and thin on the bottom, marks a short squeeze where the thin tail becomes support. A "b-shape," fat on the bottom and thin on top, marks long liquidation, where that thin upper stalk becomes tough resistance on any bounce.
One more concept worth filing away: the Naked POC. When a session prints a sharp volume peak and price gaps away without ever revisiting it, that level becomes a "virgin" magnet — a pile of historical institutional orders left untouched. If BTC ever corrects hard from today's Greed levels, those old NPOCs are exactly where desks look first for high-probability dip zones.
So next time price breaks a level and everyone's celebrating — are you watching the candle, or are you checking whether the volume actually followed it there?
#smartmoney #volumeprofile
Volume Profile maps how much trading actually happened at each price level, not just where price visited. The tallest bar is the Point of Control (POC) — right now that's $79,724, where maximum agreement between buyers and sellers has piled up. Above and below that, you get High-Volume Nodes (HVNs) — like today's zones at $81,353 and $78,641 — where price tends to compress and chop because there's plenty of liquidity for big orders to fill quietly. In between sits a Low-Volume Node (LVN) around $80,500 — a thin gap where almost nothing traded. Price treats LVNs like a vacuum: once it enters one, it usually sprints straight through rather than lingering, because there's no liquidity to slow it down.
Here's the part retail skips: POC migration. If BTC breaks above $81,353 and holds there for 48 hours, the obvious move is to assume the breakout is real. But watch where the POC actually sits during that move. If the tallest volume bar stays pinned at $79,724 even while price trades higher, that's institutions refusing to transact at the new level — a bearish divergence warning of a fakeout. If the POC itself shifts up to match price, that's confirmation real capital is accepting the new range.
Shape matters too. A balanced "D-shape" profile (POC centered, symmetric) gets mean-reverted — sell the ceiling, buy the floor, target the POC. A "P-shape," fat on top and thin on the bottom, marks a short squeeze where the thin tail becomes support. A "b-shape," fat on the bottom and thin on top, marks long liquidation, where that thin upper stalk becomes tough resistance on any bounce.
One more concept worth filing away: the Naked POC. When a session prints a sharp volume peak and price gaps away without ever revisiting it, that level becomes a "virgin" magnet — a pile of historical institutional orders left untouched. If BTC ever corrects hard from today's Greed levels, those old NPOCs are exactly where desks look first for high-probability dip zones.
So next time price breaks a level and everyone's celebrating — are you watching the candle, or are you checking whether the volume actually followed it there?
#smartmoney #volumeprofile
72

·
--
Статья
auction market theoryالحلقة 3: Volume Profile، خريطة المزاد
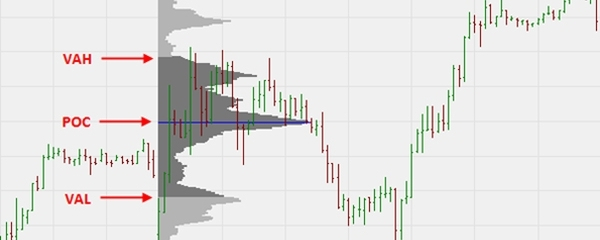
بعد أن فهمنا القيمة، كيف نراها؟ عبر أداة Volume Profile ، وهي تعرض الحجم الأفقي عند كل مستوى سعري لا عند كل شمعة.
• HVN: منطقة حجم مرتفع، يقبل السوق عندها السعر وغالبًا يتوقف أو يتذبذب.
• LVN: منطقة حجم منخفض، يرفضها السوق فيعبرها السعر بسرعة.
💡 الاستفادة العملية: LVN قد تكون مناطق تسارع، وHVN قد تكون مناطق تجمّع.
❓ هل جربت Volume Profile من قبل؟
#VolumeProfile #BTC走势分析
auction market theory
الحلقة 3: Volume Profile، خريطة المزاد
بعد أن فهمنا القيمة، كيف نراها؟ عبر أداة Volume Profile ، وهي تعرض الحجم الأفقي عند كل مستوى سعري لا عند كل شمعة.
• HVN: منطقة حجم مرتفع، يقبل السوق عندها السعر وغالبًا يتوقف أو يتذبذب.
• LVN: منطقة حجم منخفض، يرفضها السوق فيعبرها السعر بسرعة.
💡 الاستفادة العملية: LVN قد تكون مناطق تسارع، وHVN قد تكون مناطق تجمّع.
❓ هل جربت Volume Profile من قبل؟
#VolumeProfile #BTC走势分析
بعد أن فهمنا القيمة، كيف نراها؟ عبر أداة Volume Profile ، وهي تعرض الحجم الأفقي عند كل مستوى سعري لا عند كل شمعة.
• HVN: منطقة حجم مرتفع، يقبل السوق عندها السعر وغالبًا يتوقف أو يتذبذب.
• LVN: منطقة حجم منخفض، يرفضها السوق فيعبرها السعر بسرعة.
💡 الاستفادة العملية: LVN قد تكون مناطق تسارع، وHVN قد تكون مناطق تجمّع.
❓ هل جربت Volume Profile من قبل؟
#VolumeProfile #BTC走势分析
103


$FIL
{future}(FILUSDT)
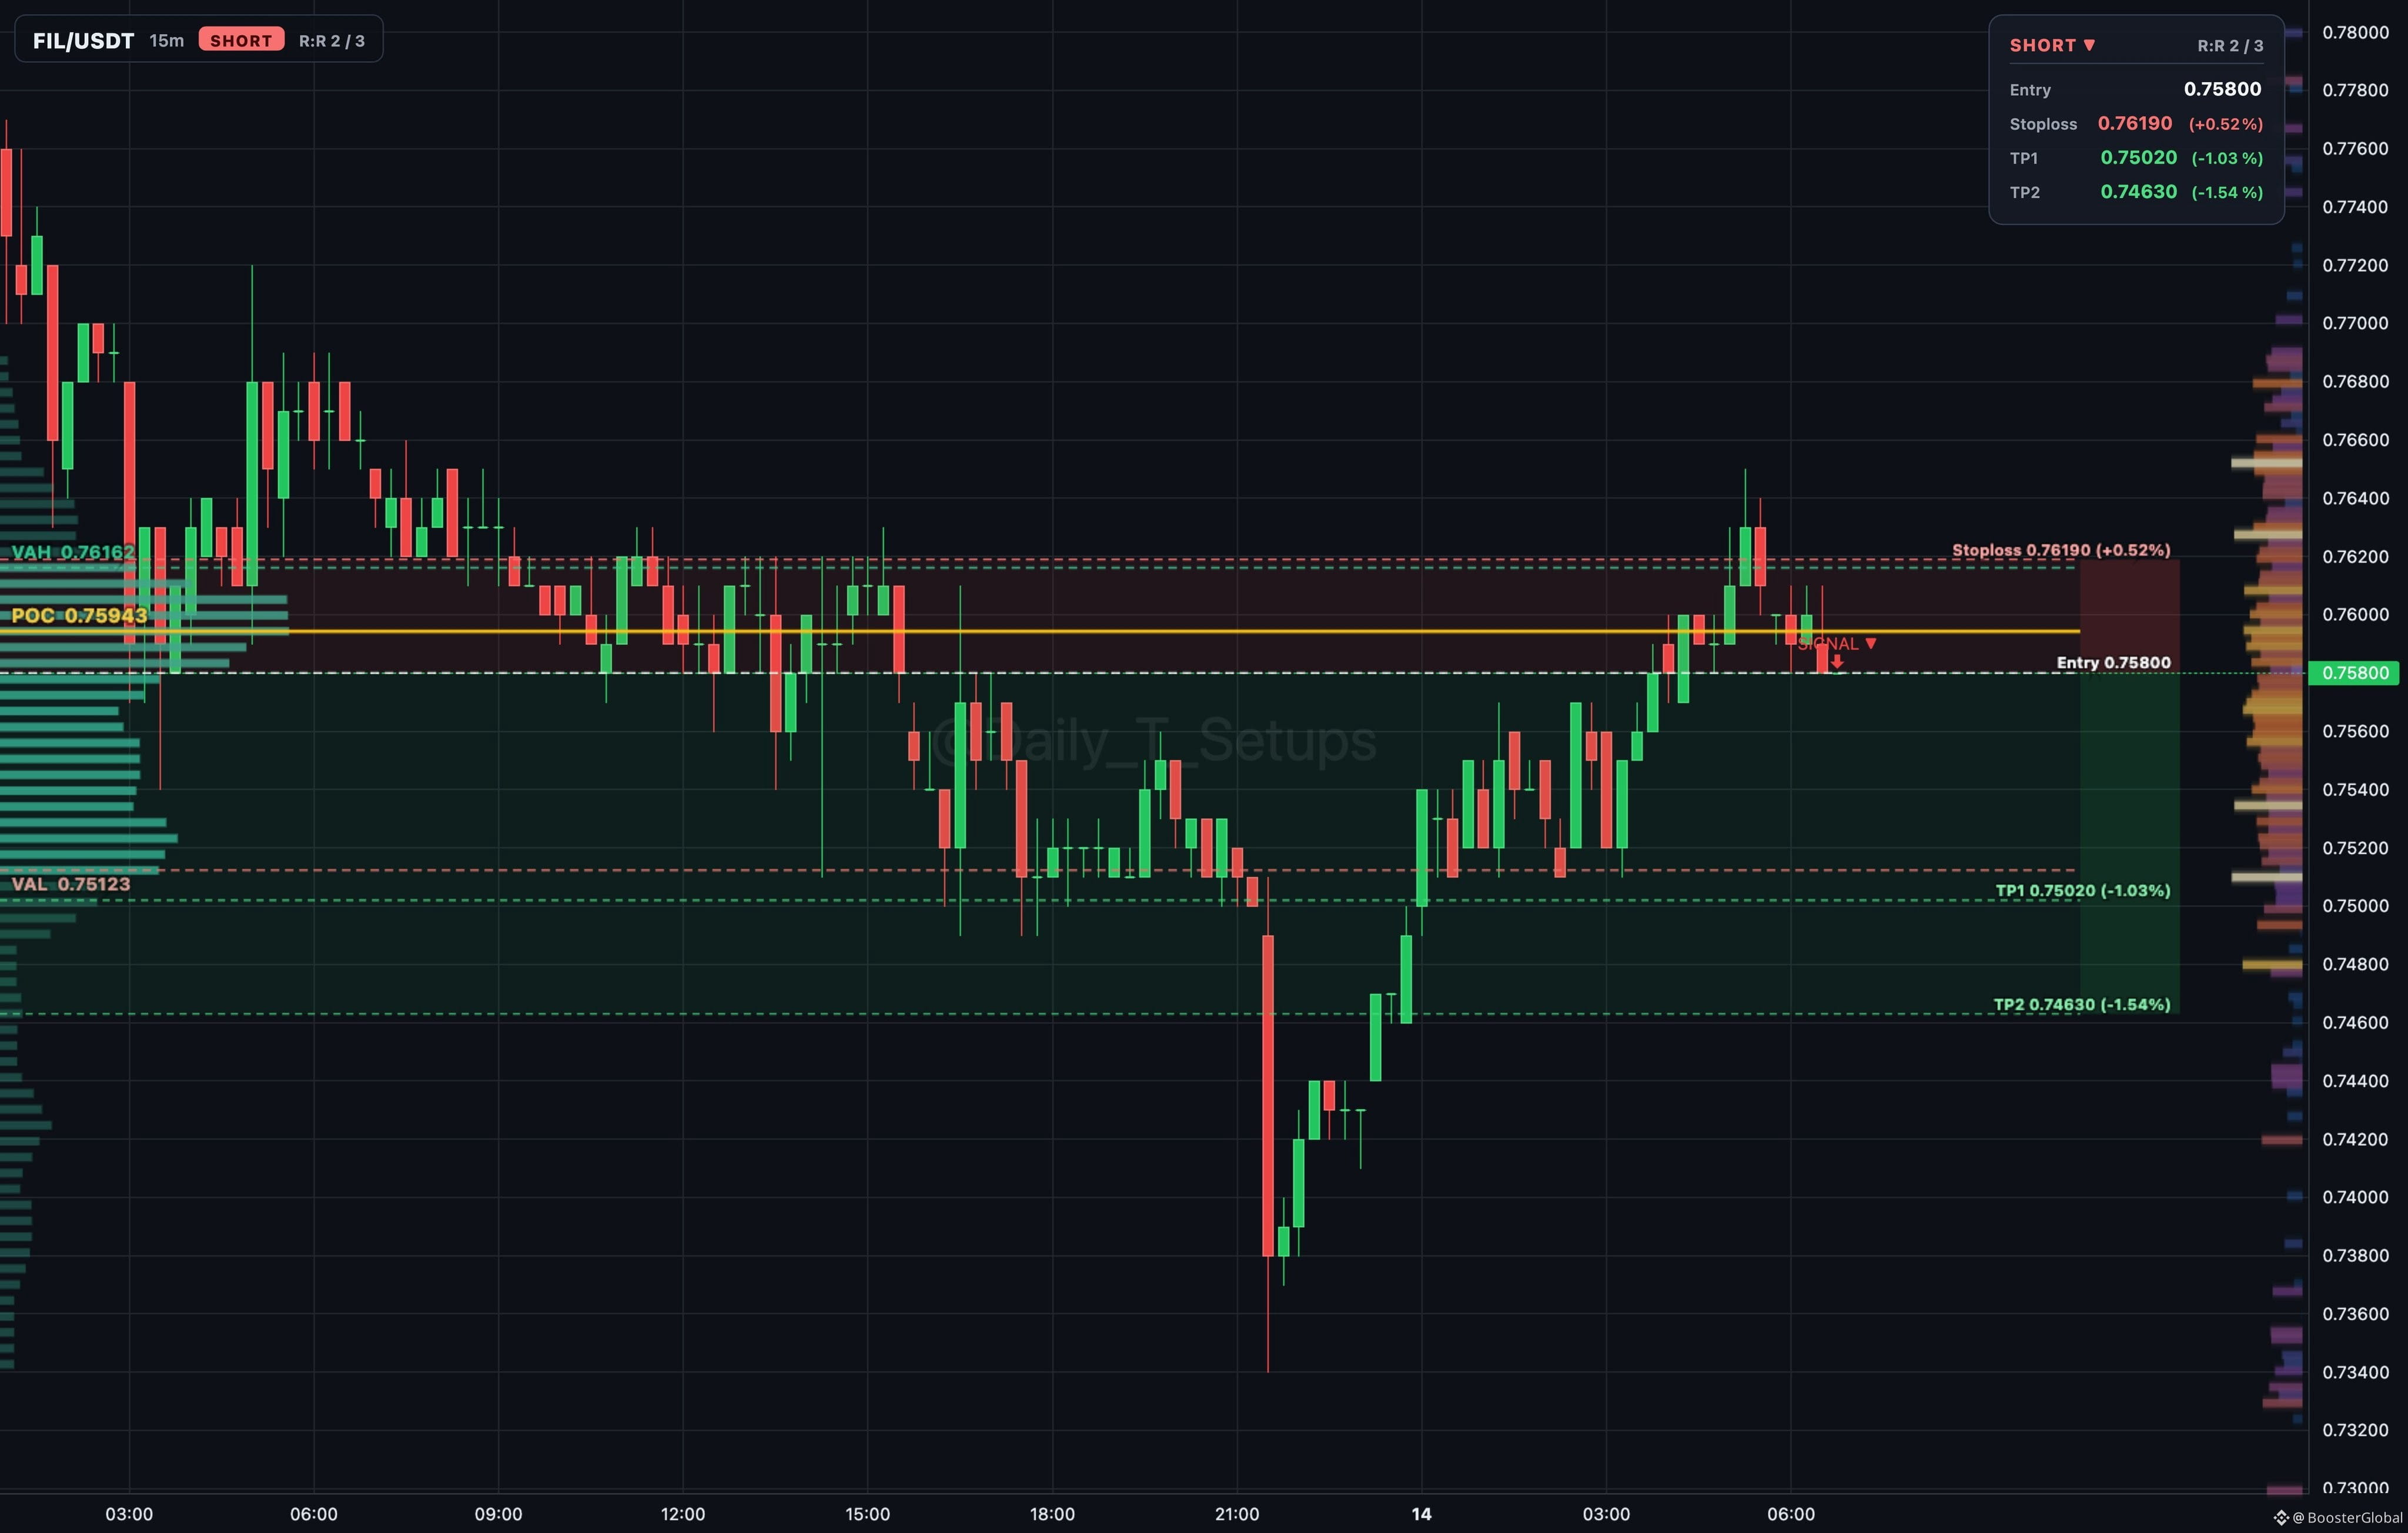
auction rotation shows sellers distributing inside value area between 0.75123 and 0.76162.
🔽 Short setup
📍 Entry: 0.758
🛑 Stop: 0.7619 (+0.5%)
🎯 TP1: 0.7502 (-1.0%)
🎯 TP2: 0.7463 (-1.5%)
#Filecoin #volumeprofile
$FIL
auction rotation shows sellers distributing inside value area between 0.75123 and 0.76162.
🔽 Short setup
📍 Entry: 0.758
🛑 Stop: 0.7619 (+0.5%)
🎯 TP1: 0.7502 (-1.0%)
🎯 TP2: 0.7463 (-1.5%)
#Filecoin #volumeprofile
auction rotation shows sellers distributing inside value area between 0.75123 and 0.76162.
🔽 Short setup
📍 Entry: 0.758
🛑 Stop: 0.7619 (+0.5%)
🎯 TP1: 0.7502 (-1.0%)
🎯 TP2: 0.7463 (-1.5%)
#Filecoin #volumeprofile
5
414
·
--
تحديث حركة AIO/USDT 🎯
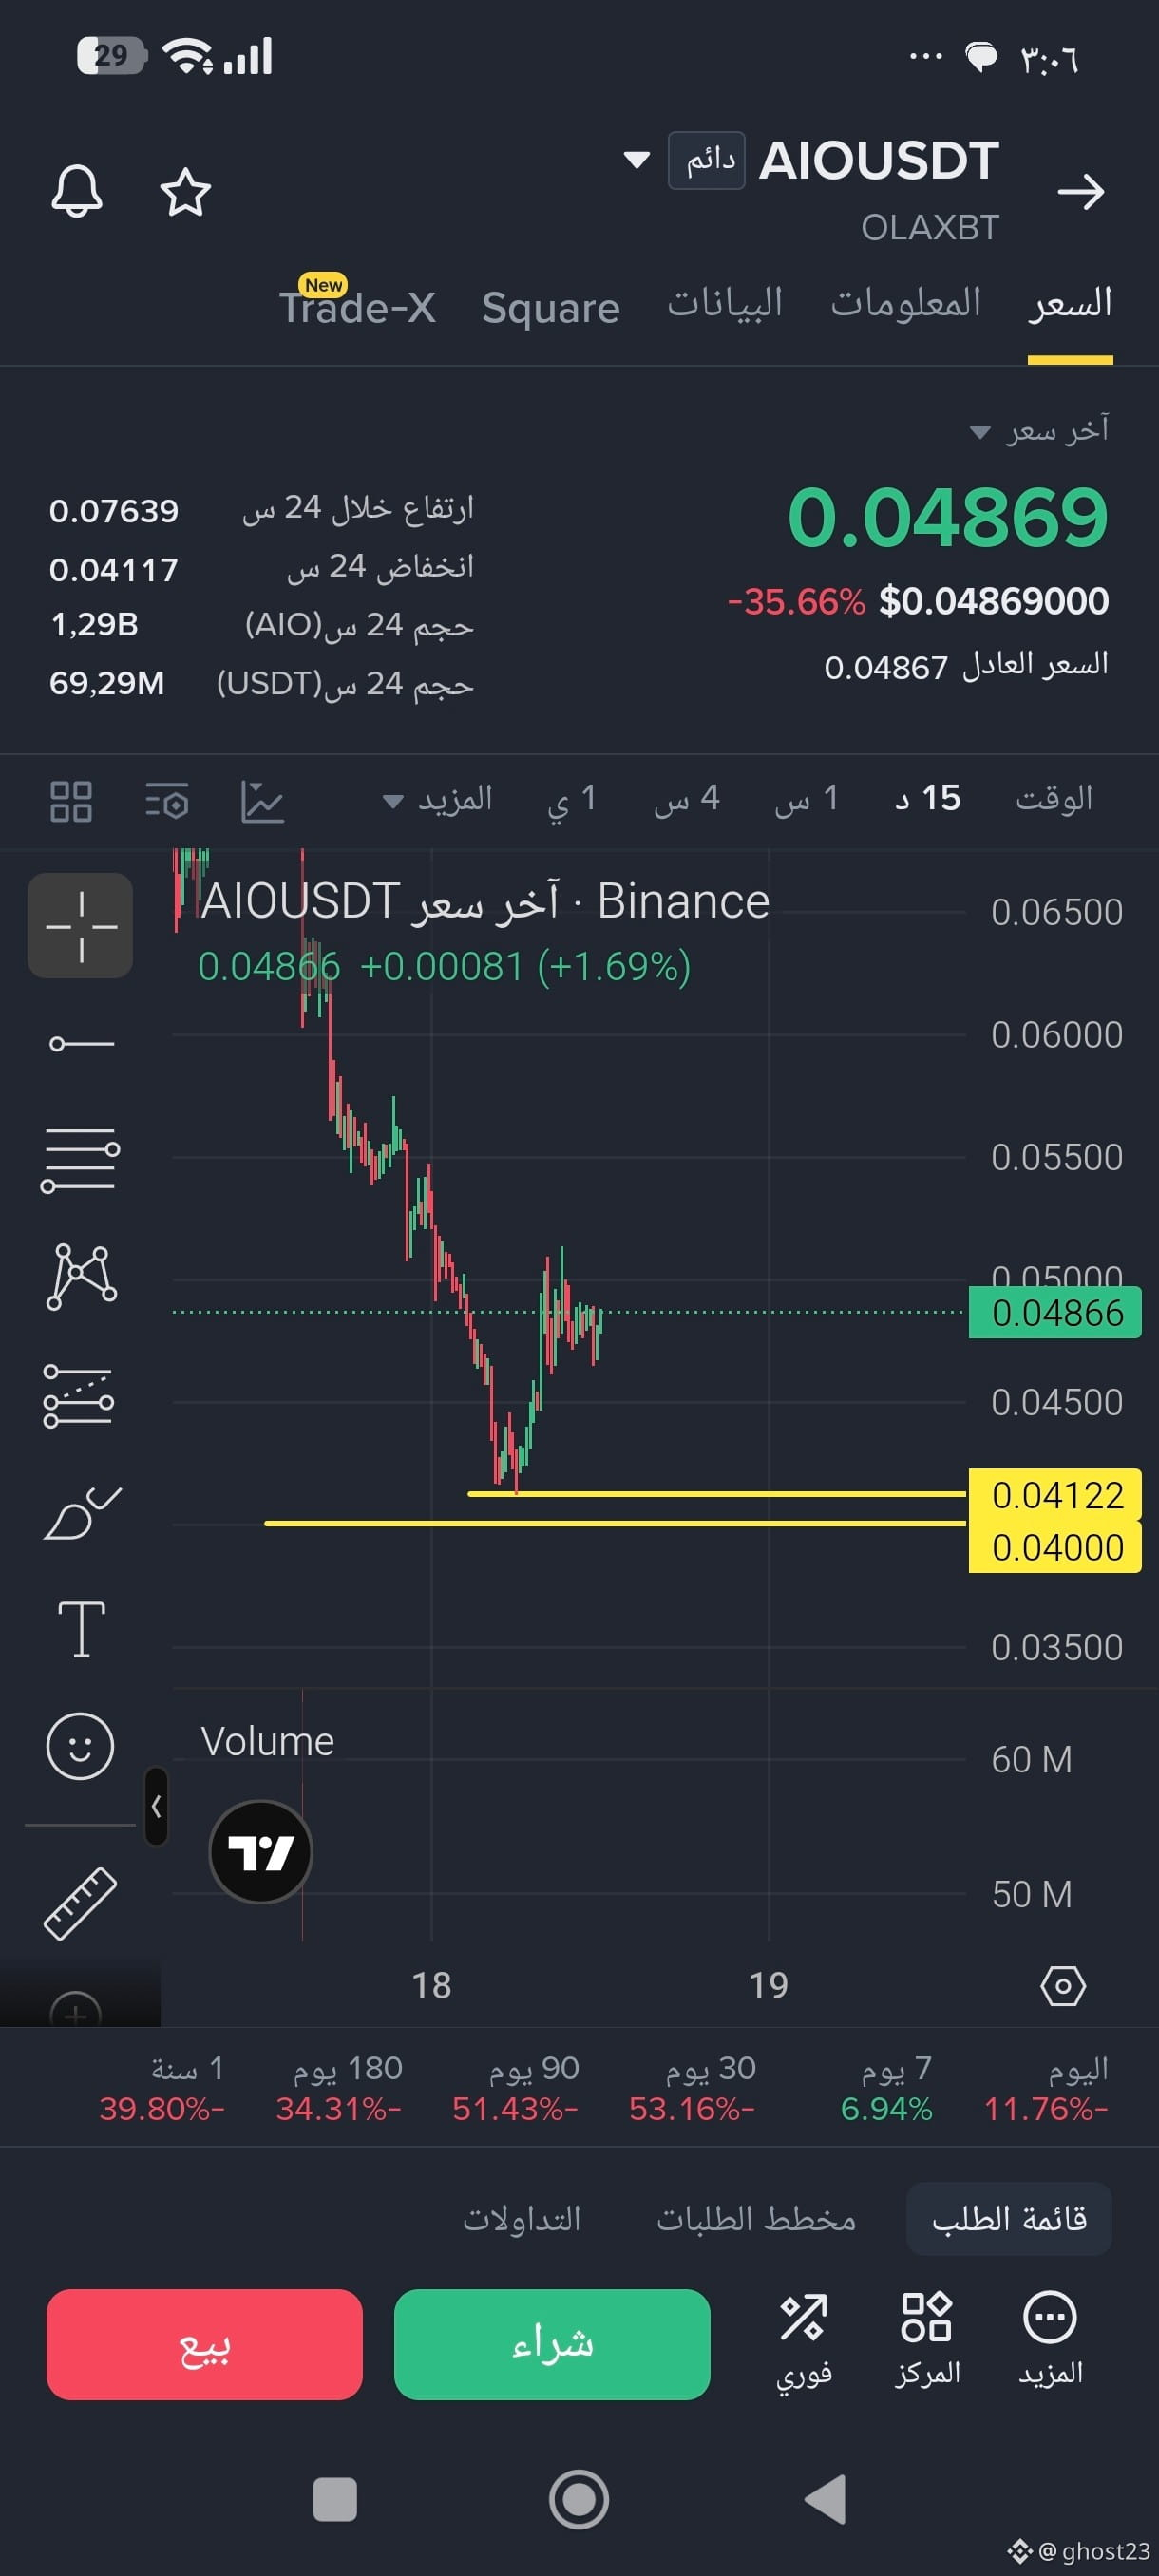
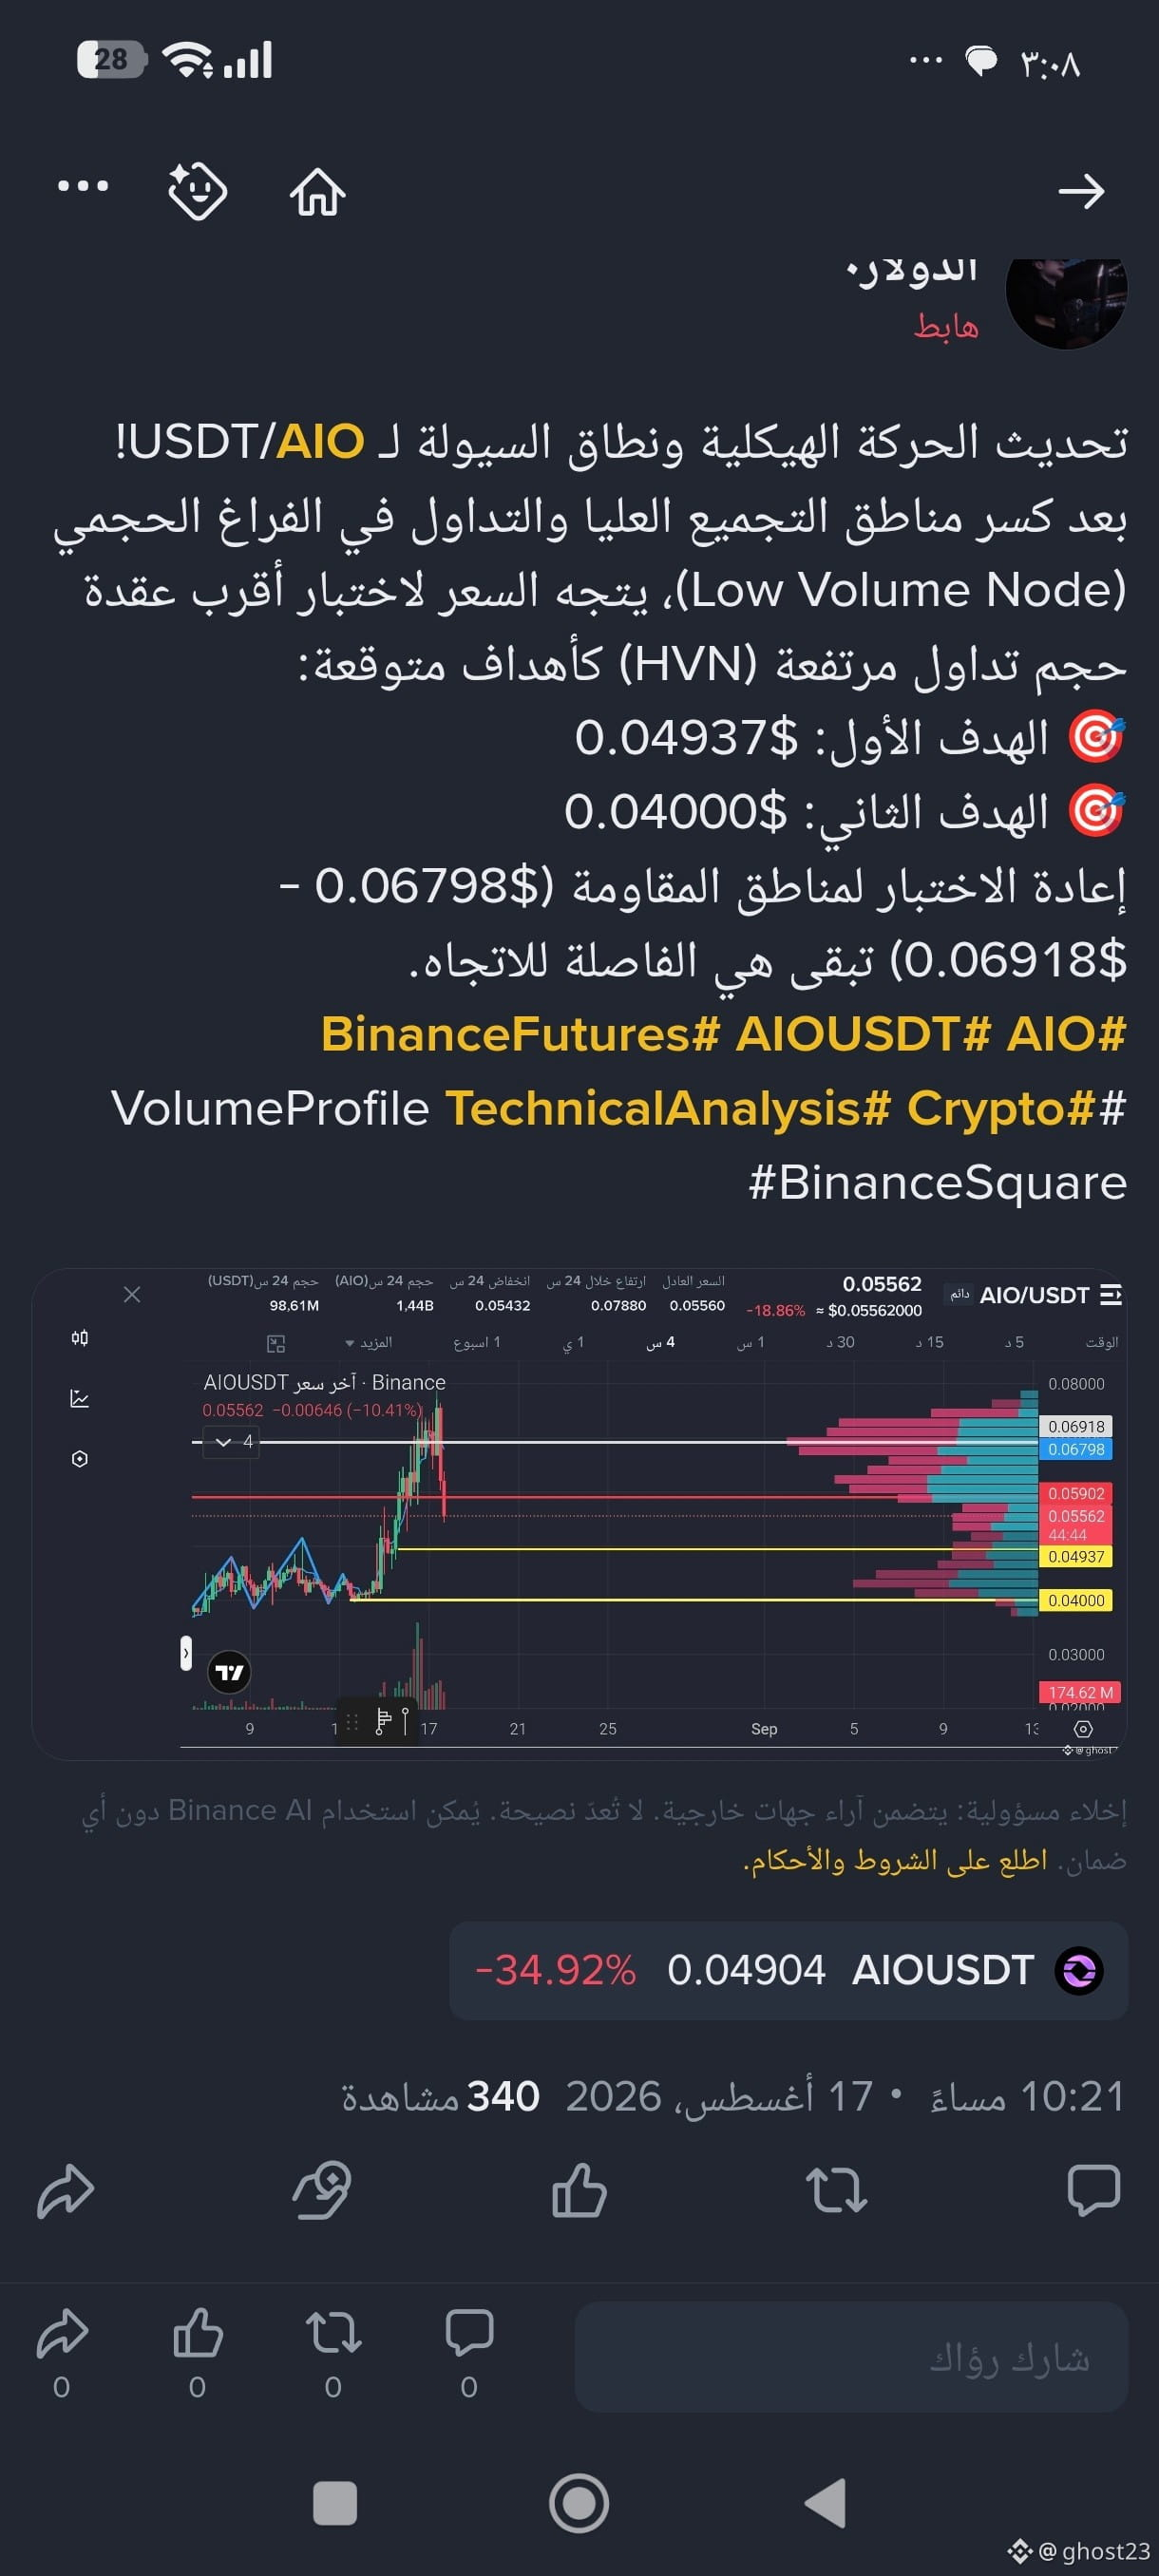
تحقق الهدف المخطط له بدقة بعد استجابة السعر لمناطق السيولة والـ (Volume Profile).
الأسواق لا تُدار بالتخمين، بل بقراءة سلوك السعر (Price Action) والالتزام الصارم بإدارة المخاطر. تم جني الأرباح وفقاً للسيناريو المحدد. 📉✨
اتاخرت في نشر لان عندي عمل شخصي وهسى يلا نشرت
$AIO
#AIOUSDT #BinanceFutures #VolumeProfile #Trading #BinanceSquare
تحديث حركة AIO/USDT 🎯
تحقق الهدف المخطط له بدقة بعد استجابة السعر لمناطق السيولة والـ (Volume Profile).
الأسواق لا تُدار بالتخمين، بل بقراءة سلوك السعر (Price Action) والالتزام الصارم بإدارة المخاطر. تم جني الأرباح وفقاً للسيناريو المحدد. 📉✨
اتاخرت في نشر لان عندي عمل شخصي وهسى يلا نشرت
$AIO
#AIOUSDT #BinanceFutures #VolumeProfile #Trading #BinanceSquare
تحقق الهدف المخطط له بدقة بعد استجابة السعر لمناطق السيولة والـ (Volume Profile).
الأسواق لا تُدار بالتخمين، بل بقراءة سلوك السعر (Price Action) والالتزام الصارم بإدارة المخاطر. تم جني الأرباح وفقاً للسيناريو المحدد. 📉✨
اتاخرت في نشر لان عندي عمل شخصي وهسى يلا نشرت
$AIO
#AIOUSDT #BinanceFutures #VolumeProfile #Trading #BinanceSquare
180

📚 Crypto Learning Series – Part 67
📊 Volume Profile Kya Batata Hai?
Normal Volume humein batata hai ke kitni trading activity hui۔
Lekin Volume Profile yeh dikhata hai ke kis price level par kitni activity hui۔
Ismein 3 important levels dekhe jate hain:
🎯 POC → Jahan sab se zyada volume hua.
🟢 VAH → Value Area ka upper level.
🔴 VAL → Value Area ka lower level.
💡 Price agar POC ke aas paas repeatedly react kare, to yeh level market ke liye important ho sakta hai.
⚠️ Volume Profile akela Buy/Sell signal nahi. Price Action aur Market Structure ke saath use karo.
📌 Yaad Rakho
✅ Volume = activity
✅ Volume Profile = activity at specific prices
✅ POC = highest-volume price level
🧠 Simple Rule
"Sirf price nahi, dekho market ne kahan trade kiya."
🔑 Golden Rule
"Volume tells you how much. Volume Profile tells you where."
#volumeprofile #POC #PriceAction #BTC #BinanceSquare $BTC
{spot}(BTCUSDT)
📚 Crypto Learning Series – Part 67
📊 Volume Profile Kya Batata Hai?
Normal Volume humein batata hai ke kitni trading activity hui۔
Lekin Volume Profile yeh dikhata hai ke kis price level par kitni activity hui۔
Ismein 3 important levels dekhe jate hain:
🎯 POC → Jahan sab se zyada volume hua.
🟢 VAH → Value Area ka upper level.
🔴 VAL → Value Area ka lower level.
💡 Price agar POC ke aas paas repeatedly react kare, to yeh level market ke liye important ho sakta hai.
⚠️ Volume Profile akela Buy/Sell signal nahi. Price Action aur Market Structure ke saath use karo.
📌 Yaad Rakho
✅ Volume = activity
✅ Volume Profile = activity at specific prices
✅ POC = highest-volume price level
🧠 Simple Rule
"Sirf price nahi, dekho market ne kahan trade kiya."
🔑 Golden Rule
"Volume tells you how much. Volume Profile tells you where."
#volumeprofile #POC #PriceAction #BTC #BinanceSquare $BTC
📊 Volume Profile Kya Batata Hai?
Normal Volume humein batata hai ke kitni trading activity hui۔
Lekin Volume Profile yeh dikhata hai ke kis price level par kitni activity hui۔
Ismein 3 important levels dekhe jate hain:
🎯 POC → Jahan sab se zyada volume hua.
🟢 VAH → Value Area ka upper level.
🔴 VAL → Value Area ka lower level.
💡 Price agar POC ke aas paas repeatedly react kare, to yeh level market ke liye important ho sakta hai.
⚠️ Volume Profile akela Buy/Sell signal nahi. Price Action aur Market Structure ke saath use karo.
📌 Yaad Rakho
✅ Volume = activity
✅ Volume Profile = activity at specific prices
✅ POC = highest-volume price level
🧠 Simple Rule
"Sirf price nahi, dekho market ne kahan trade kiya."
🔑 Golden Rule
"Volume tells you how much. Volume Profile tells you where."
#volumeprofile #POC #PriceAction #BTC #BinanceSquare $BTC
4
93
·
--
Рост
📚 Crypto Learning Series — Part 68
🔥 POC + VAH + VAL — Chart Par Inka Practical Use
Volume Profile sirf levels dikhane ke liye nahi hota — ye batata hai ke market ne kis price area ko sab se zyada accept kiya.
📍 POC (Point of Control)
Jahan sab se zyada volume trade hua.
➡️ Ye aksar strong magnet / reference level ban jata hai.
📈 VAH (Value Area High)
Value Area ki upper boundary.
➡️ VAH ke upar acceptance aaye to bullish strength ho sakti hai.
📉 VAL (Value Area Low)
Value Area ki lower boundary.
➡️ VAL ke neeche acceptance bearish weakness show kar sakti hai.
📌 Yaad Rakho
• POC = Highest Volume Level
• VAH = Value Area Top
• VAL = Value Area Bottom
🧠 Simple Rule:
Price ko sirf level touch karte hue mat dekho — acceptance ya rejection dekho.
🔑 Golden Rule:
Level + Price Action + Volume = Better Confirmation
#CryptoLearning #TechnicalAnalysis #VolumeProfile #BTC #BinanceSquare $BTC
{spot}(BTCUSDT)
📚 Crypto Learning Series — Part 68
🔥 POC + VAH + VAL — Chart Par Inka Practical Use
Volume Profile sirf levels dikhane ke liye nahi hota — ye batata hai ke market ne kis price area ko sab se zyada accept kiya.
📍 POC (Point of Control)
Jahan sab se zyada volume trade hua.
➡️ Ye aksar strong magnet / reference level ban jata hai.
📈 VAH (Value Area High)
Value Area ki upper boundary.
➡️ VAH ke upar acceptance aaye to bullish strength ho sakti hai.
📉 VAL (Value Area Low)
Value Area ki lower boundary.
➡️ VAL ke neeche acceptance bearish weakness show kar sakti hai.
📌 Yaad Rakho
• POC = Highest Volume Level
• VAH = Value Area Top
• VAL = Value Area Bottom
🧠 Simple Rule:
Price ko sirf level touch karte hue mat dekho — acceptance ya rejection dekho.
🔑 Golden Rule:
Level + Price Action + Volume = Better Confirmation
#CryptoLearning #TechnicalAnalysis #VolumeProfile #BTC #BinanceSquare $BTC
🔥 POC + VAH + VAL — Chart Par Inka Practical Use
Volume Profile sirf levels dikhane ke liye nahi hota — ye batata hai ke market ne kis price area ko sab se zyada accept kiya.
📍 POC (Point of Control)
Jahan sab se zyada volume trade hua.
➡️ Ye aksar strong magnet / reference level ban jata hai.
📈 VAH (Value Area High)
Value Area ki upper boundary.
➡️ VAH ke upar acceptance aaye to bullish strength ho sakti hai.
📉 VAL (Value Area Low)
Value Area ki lower boundary.
➡️ VAL ke neeche acceptance bearish weakness show kar sakti hai.
📌 Yaad Rakho
• POC = Highest Volume Level
• VAH = Value Area Top
• VAL = Value Area Bottom
🧠 Simple Rule:
Price ko sirf level touch karte hue mat dekho — acceptance ya rejection dekho.
🔑 Golden Rule:
Level + Price Action + Volume = Better Confirmation
#CryptoLearning #TechnicalAnalysis #VolumeProfile #BTC #BinanceSquare $BTC
4
104

·
--
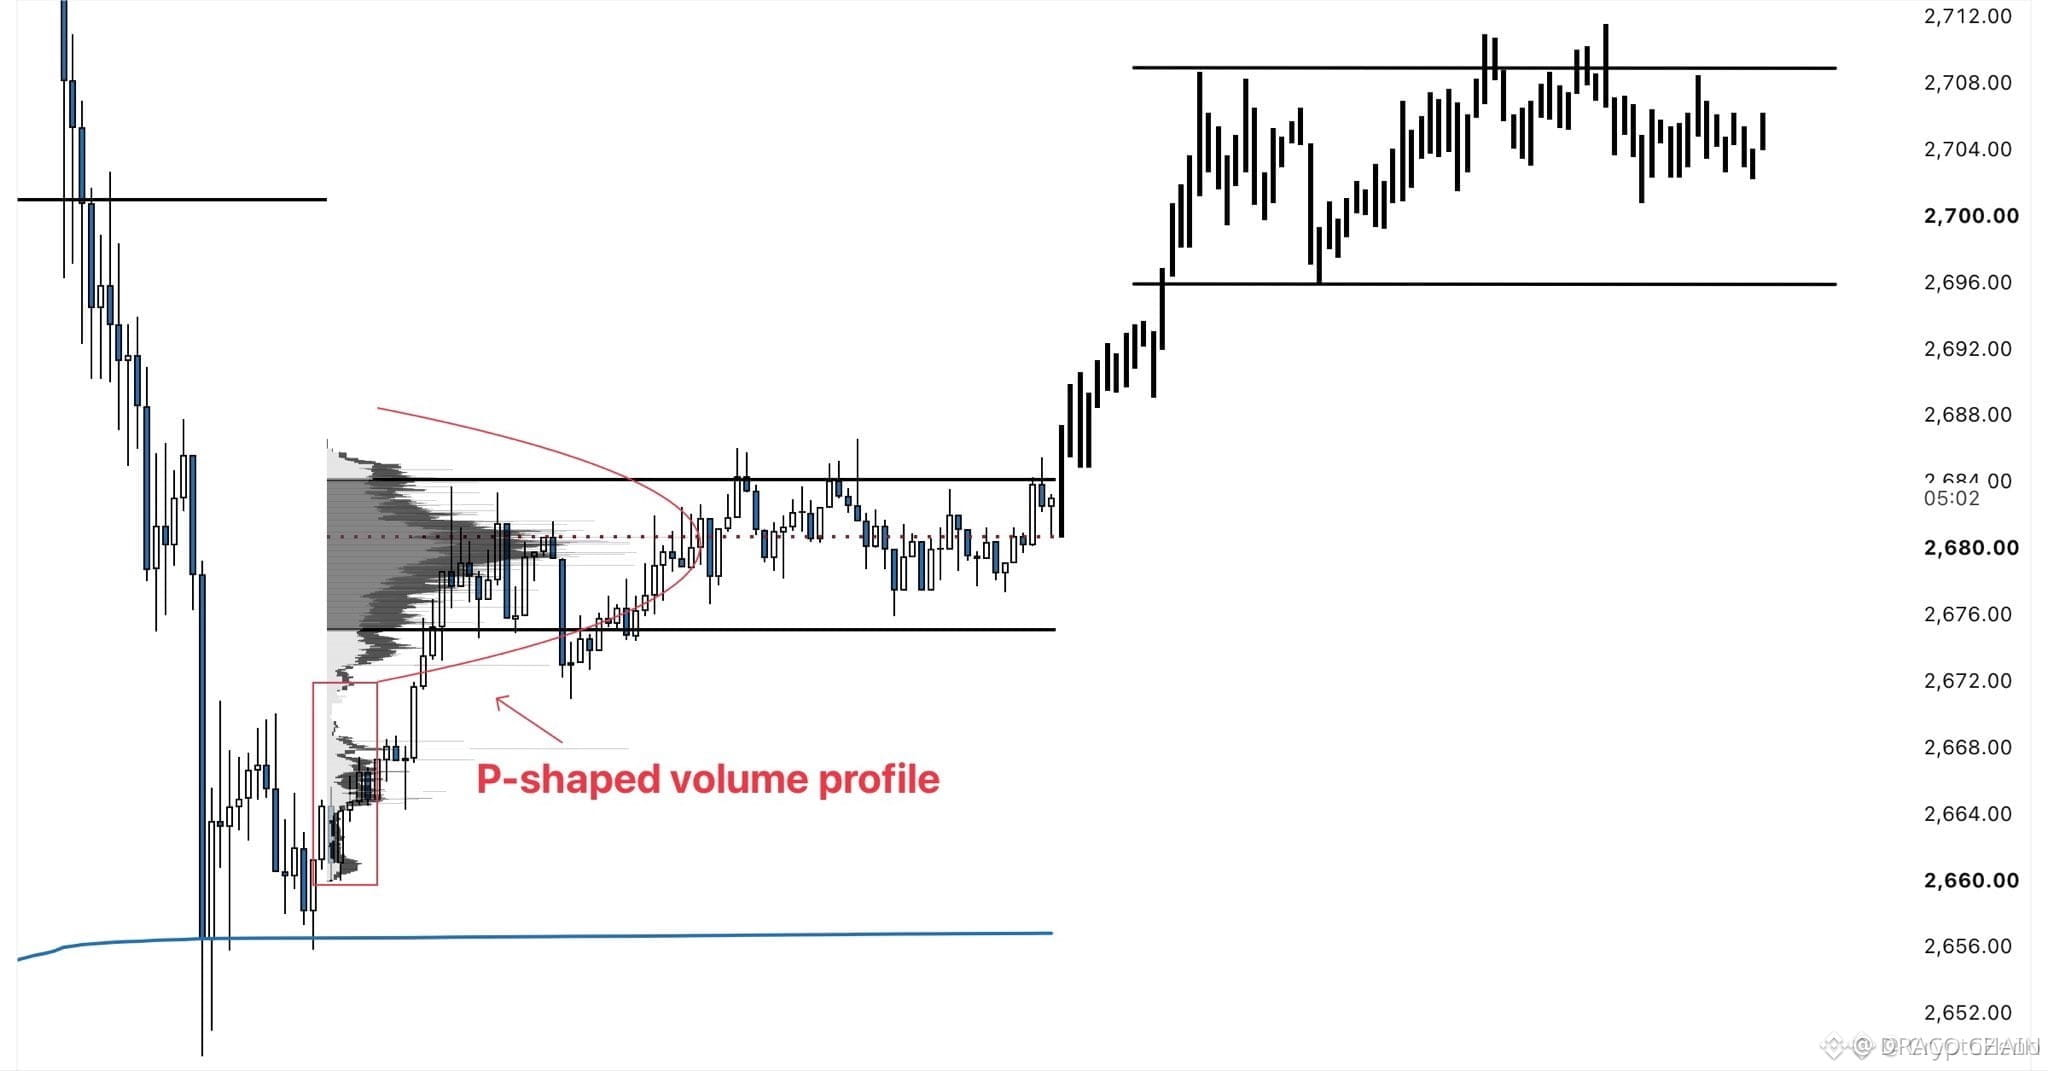
⚡ $ETH PREPARES FOR UPSIDE EXPANSION AS P-SHAPED PROFILE ABSORBS SELLER LIQUIDITY! 🟢
Target: 2,700 🚀
Smart money left a textbook P-shaped volume profile following the initial bounce off the anchored VWAP, signalling short-covering and high-value institutional position building. 📊 Price compression above key structural support indicates buyers are actively absorbing overhead float rather than distributing.
With inefficiency resting above and seller exhaustion evident across lower timeframes, the path of least resistance favors a swift upside expansion. 💡 A clean breakout above current range highs opens the door for a momentum push straight toward structural liquidity. 💬 Are you positioned for the breakout, or waiting for confirmation above resistance? 👇
⚠️ Not financial advice. Always manage your risk. 🛡️
🏷️ #ETH #Ethereum #Breakout #VolumeProfile
🎯 🦈
⚡ $ETH PREPARES FOR UPSIDE EXPANSION AS P-SHAPED PROFILE ABSORBS SELLER LIQUIDITY! 🟢
Target: 2,700 🚀
Smart money left a textbook P-shaped volume profile following the initial bounce off the anchored VWAP, signalling short-covering and high-value institutional position building. 📊 Price compression above key structural support indicates buyers are actively absorbing overhead float rather than distributing.
With inefficiency resting above and seller exhaustion evident across lower timeframes, the path of least resistance favors a swift upside expansion. 💡 A clean breakout above current range highs opens the door for a momentum push straight toward structural liquidity. 💬 Are you positioned for the breakout, or waiting for confirmation above resistance? 👇
⚠️ Not financial advice. Always manage your risk. 🛡️
🏷️ #ETH #Ethereum #Breakout #VolumeProfile
🎯 🦈
Target: 2,700 🚀
Smart money left a textbook P-shaped volume profile following the initial bounce off the anchored VWAP, signalling short-covering and high-value institutional position building. 📊 Price compression above key structural support indicates buyers are actively absorbing overhead float rather than distributing.
With inefficiency resting above and seller exhaustion evident across lower timeframes, the path of least resistance favors a swift upside expansion. 💡 A clean breakout above current range highs opens the door for a momentum push straight toward structural liquidity. 💬 Are you positioned for the breakout, or waiting for confirmation above resistance? 👇
⚠️ Not financial advice. Always manage your risk. 🛡️
🏷️ #ETH #Ethereum #Breakout #VolumeProfile
🎯 🦈
29

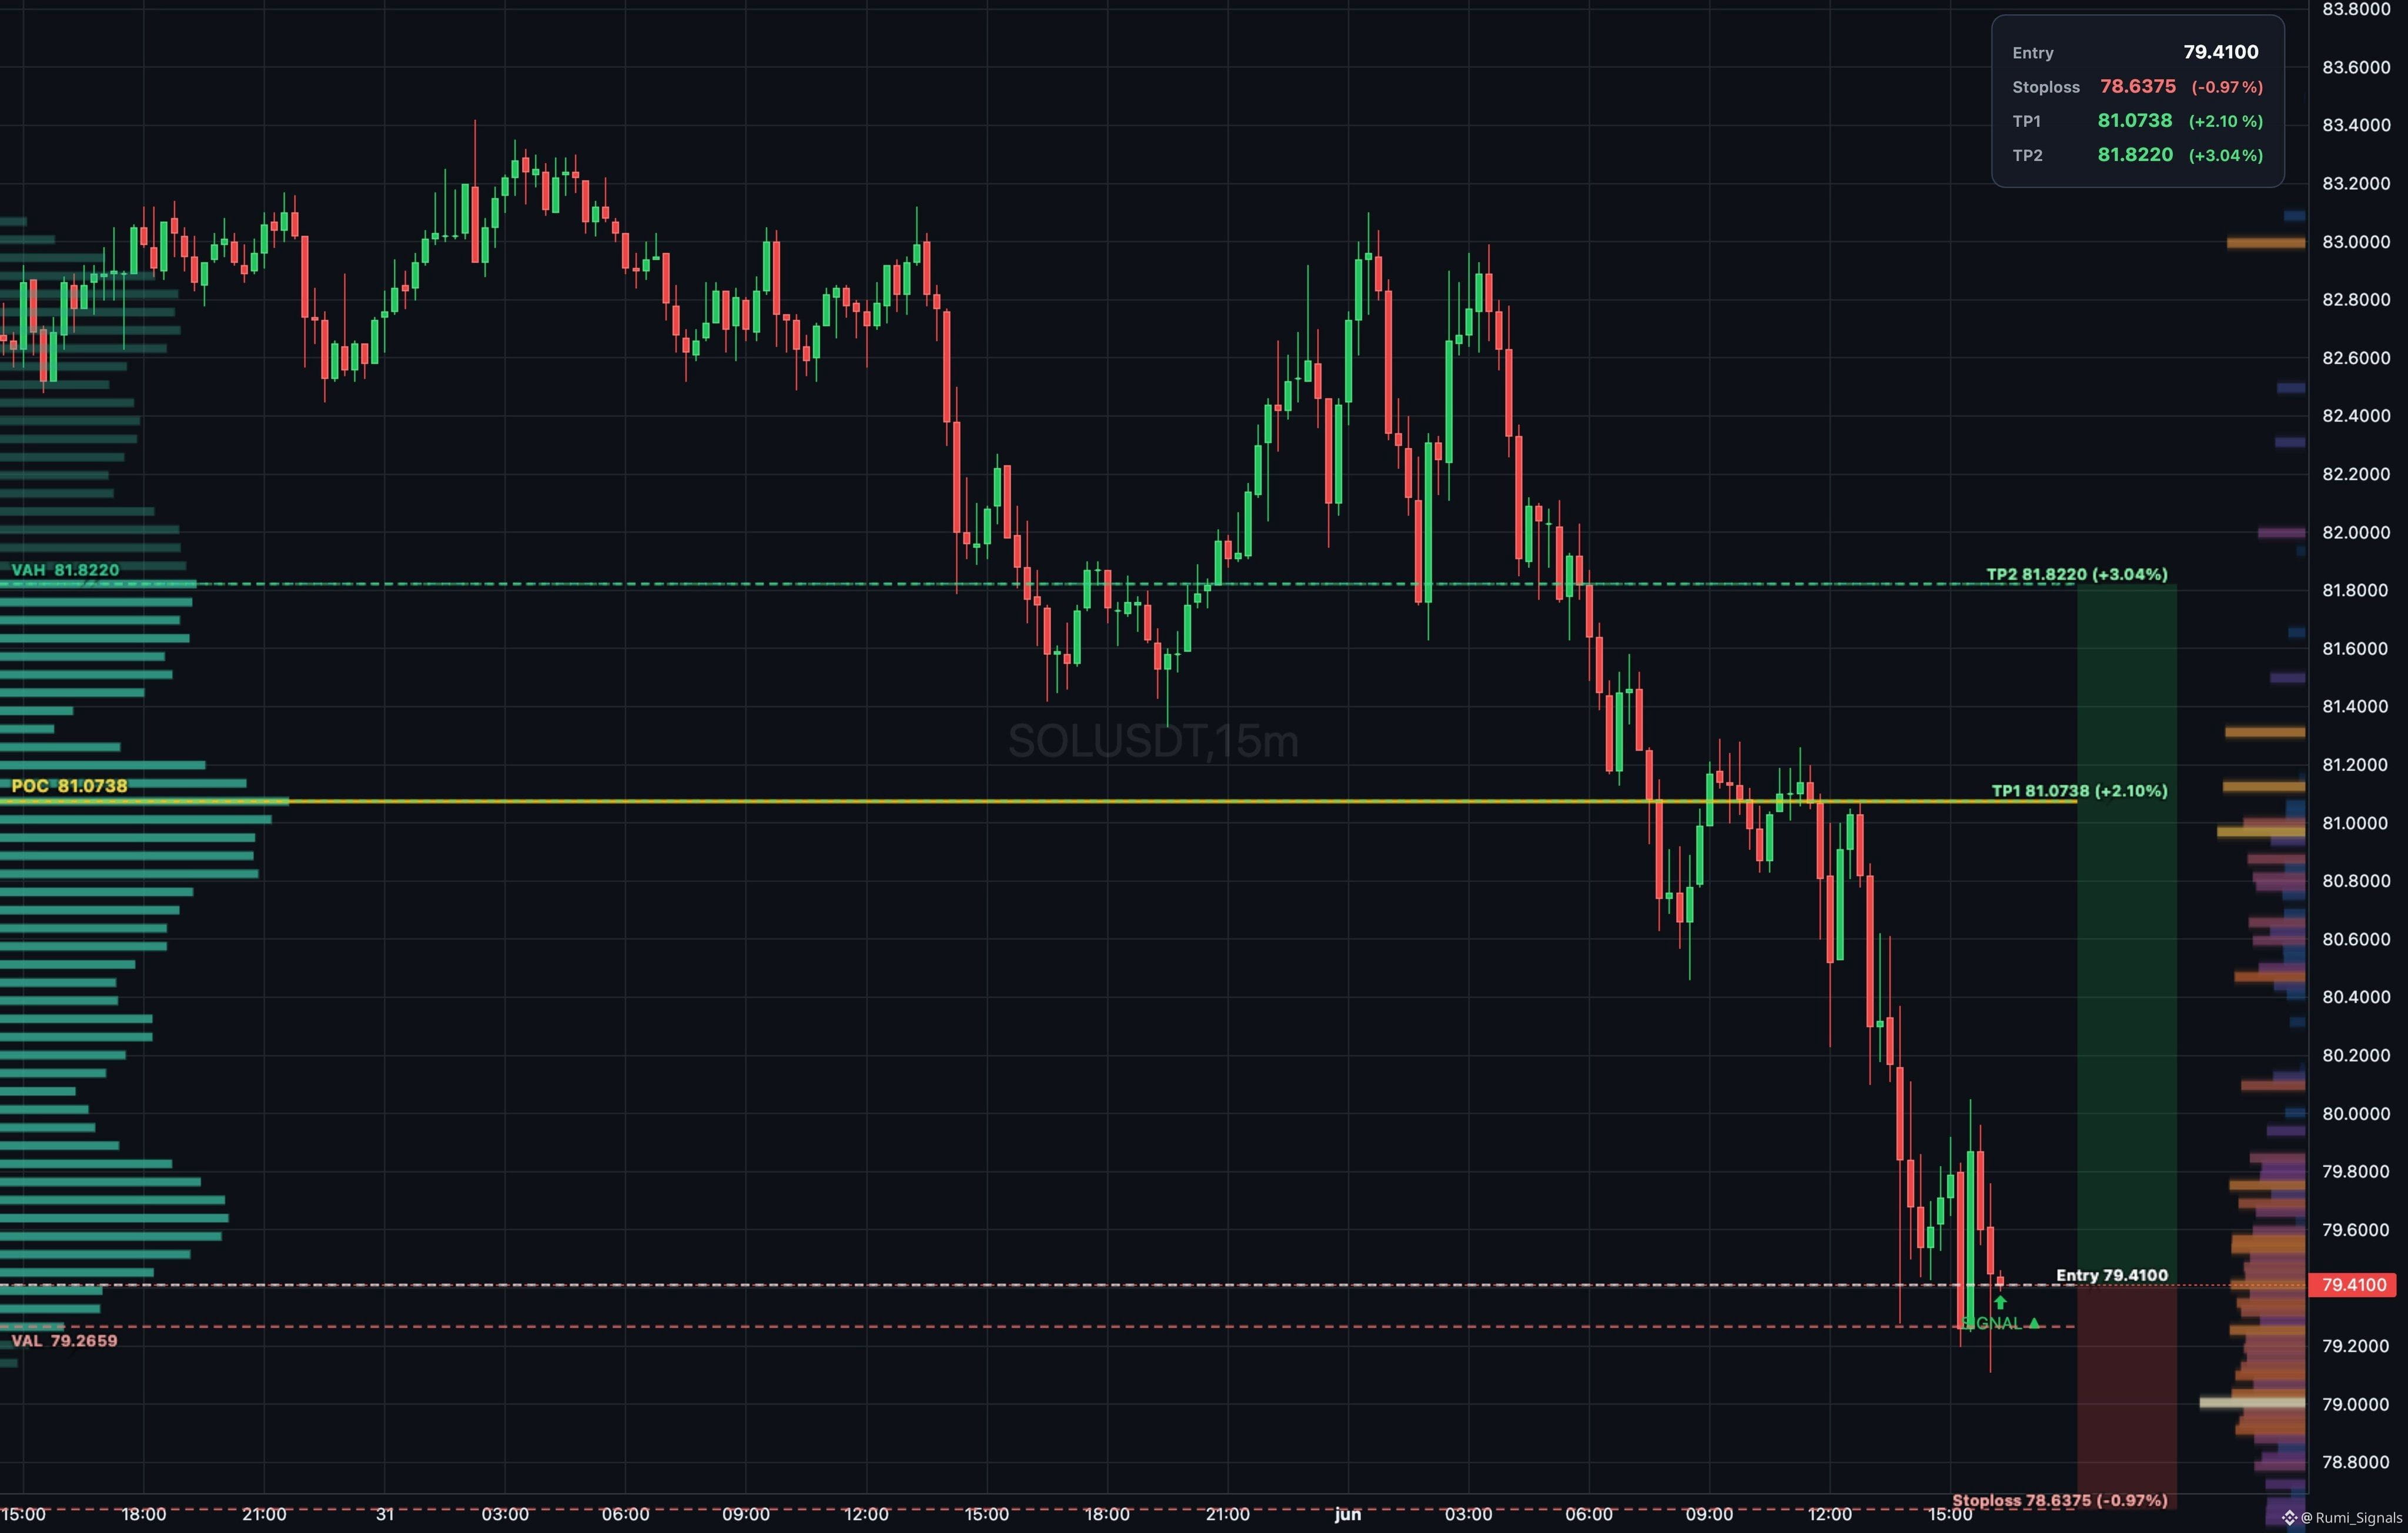
Looking at $SOL — buyers seem to be absorbing right inside the value area, between VAL at $79.266 and VAH at $81.822. Order book liquidity is thin.
I got in at $79.440, and the bullish delta divergence is confirming the absorption.
{future}(SOLUSDT)
Targets: first at $81.074, second at $81.822 — just a measured move from here.
#Solana #volumeprofile #viralpost
Looking at $SOL — buyers seem to be absorbing right inside the value area, between VAL at $79.266 and VAH at $81.822. Order book liquidity is thin.
I got in at $79.440, and the bullish delta divergence is confirming the absorption.
Targets: first at $81.074, second at $81.822 — just a measured move from here.
#Solana #volumeprofile #viralpost
I got in at $79.440, and the bullish delta divergence is confirming the absorption.
Targets: first at $81.074, second at $81.822 — just a measured move from here.
#Solana #volumeprofile #viralpost
1
46
1H Update..
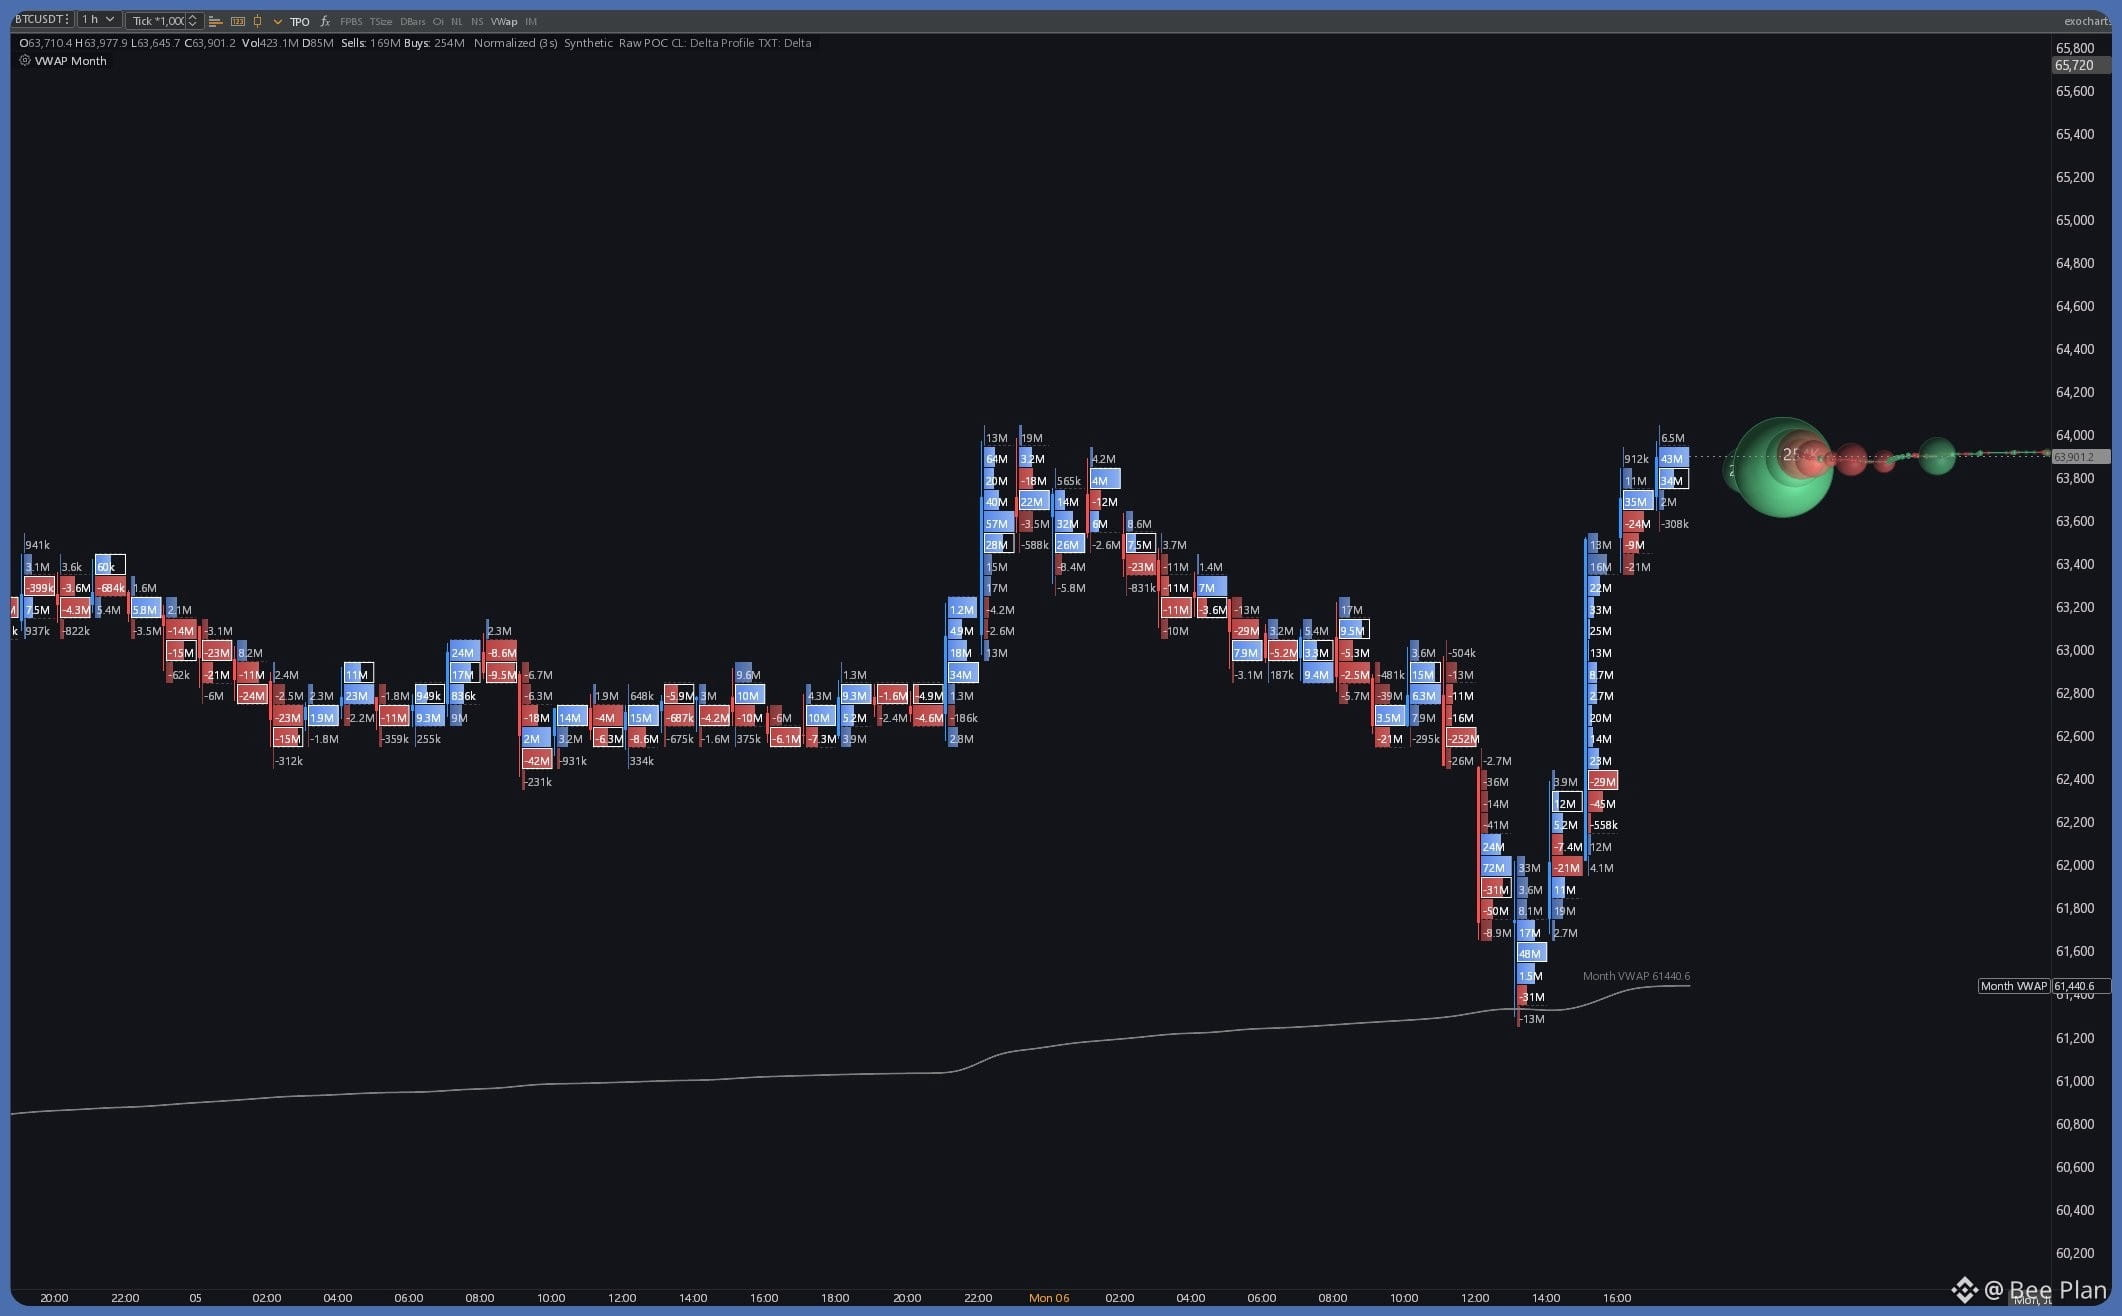
Price just reclaimed *$63,900* with a massive volume bubble. Buyers stepped in hard after the dip to $61,400 zone near Monthly VWAP.
$BTC 💃
Rejection at $64,000* earlier, now holding above it
High volume buy delta* on the right side = strong demand
Monthly VWAP at $61,440* acted as support and price bounced
Bullish as long as we stay above $63,500. Next target $64,400+ if volume continues.
Break below $63,000 invalidates it...
#BTC #Crypto #Trading #VolumeProfile
1H Update..
Price just reclaimed *$63,900* with a massive volume bubble. Buyers stepped in hard after the dip to $61,400 zone near Monthly VWAP.
$BTC 💃
Rejection at $64,000* earlier, now holding above it
High volume buy delta* on the right side = strong demand
Monthly VWAP at $61,440* acted as support and price bounced
Bullish as long as we stay above $63,500. Next target $64,400+ if volume continues.
Break below $63,000 invalidates it...
#BTC #Crypto #Trading #VolumeProfile
Price just reclaimed *$63,900* with a massive volume bubble. Buyers stepped in hard after the dip to $61,400 zone near Monthly VWAP.
$BTC 💃
Rejection at $64,000* earlier, now holding above it
High volume buy delta* on the right side = strong demand
Monthly VWAP at $61,440* acted as support and price bounced
Bullish as long as we stay above $63,500. Next target $64,400+ if volume continues.
Break below $63,000 invalidates it...
#BTC #Crypto #Trading #VolumeProfile
38
Войдите, чтобы посмотреть больше материала
Присоединяйтесь к пользователям криптовалют по всему миру на Binance Square
⚡️ Получайте новейшую и полезную информацию о криптоактивах.
💬 Нам доверяет крупнейшая в мире криптобиржа.
👍 Получите достоверные аналитические данные от верифицированных создателей контента.
Эл. почта/номер телефона
В тренде
1
#XRPDropsToTwoYearLowNear87Cents
Просмотров: 0
5 обсуждают
2
#BitcoinFallsBelow$57KToTwoYearLow
Просмотров: 0
0 обсуждают
3
#NvidiaLoses$2.7TrillionInMonthAndAHalf
Просмотров: 82
18 обсуждают
4
#CanBTCReboundAfterFallingBelow60K?
Просмотров: 477,933
2,117 обсуждают
5
#GlobalStocksFaceLongestLosingStreakSince2023
Просмотров: 164,781
1,471 обсуждают
6
#BlackRockIBITPostsRecord$541MSingleDayOutflow
Просмотров: 7,371
47 обсуждают
7
#AnthropicPlungesTowardIPOPriceonDay2
Просмотров: 78,782
841 обсуждают
8
#TwentyOneCapitalAdds172.25BTC
Просмотров: 30,258
374 обсуждают
9
#HKBillWouldExcludeTokenizedDepositsFromVirtualAssets
Просмотров: 2,974
39 обсуждают
10
#BNBDropsBelow540USDTWith8.46%DailyDecline
Просмотров: 46,202
429 обсуждают