
#volatility
volatility
Просмотров: 4.2M
20,019 обсуждают
Популярные
Новые

MMT يهبط 15.0% بعد صعود 109.8%… فما الذي تغيّر؟بعد ارتفاع 109.8% في 24 ساعة، جاءت الجلسة التالية على $MMT بهبوط 15.0% إلى 0.1949 USDT 📈
تحرك السعر خلال اليوم بين 0.1933 و0.2833 USDT، أي أن الجلسة جربت الصعود والهبوط قبل أن تستقر قرب أدنى مستوى لها.
حجم التداول بلغ 39.8 مليون USDT، وهذا يؤكد وجود اهتمام حقيقي بالعملة لكنه لا يحدد الاتجاه. وسبب الارتفاع السابق بقي غير مؤكد.
للمقارنة، هبط $BTC بنسبة 1.7% في الفترة نفسها إلى 63,612 USDT، أي أن حركة MMT كانت أكبر بكثير من حركة السوق العام. ومن الأصول التي تحركت في الاتجاه نفسه NVDAB بهبوط 4.3%.
ماذا يعني ذلك لك؟ إذا كنت تتابع MMT بعد هذه الحركة، فقد يبقى التقلب مرتفعاً إلى أن تتضح أسباب الصعود السابق. ولا شيء يؤكد أن الهبوط توقف.
الخلاصة: الحركة الكبيرة تجذب المتداولين، لكنها لا تخبرك بالاتجاه التالي.
لو كنت تحمل MMT بعد صعود 109.8%، ما أول شيء تفكر فيه الآن؟ 👇
#MMT #Volatility
المحتوى للمعلومات فقط وليس نصيحة مالية.
اضغط $MMT للتداول
$MMT $BTC
غيرك سبقك وتابع. ادخل بروفايلي وخلك مع اللي يقرأ قبل ما ينتشر الخبر.
MMT يهبط 15.0% بعد صعود 109.8%… فما الذي تغيّر؟
بعد ارتفاع 109.8% في 24 ساعة، جاءت الجلسة التالية على $MMT بهبوط 15.0% إلى 0.1949 USDT 📈
تحرك السعر خلال اليوم بين 0.1933 و0.2833 USDT، أي أن الجلسة جربت الصعود والهبوط قبل أن تستقر قرب أدنى مستوى لها.
حجم التداول بلغ 39.8 مليون USDT، وهذا يؤكد وجود اهتمام حقيقي بالعملة لكنه لا يحدد الاتجاه. وسبب الارتفاع السابق بقي غير مؤكد.
للمقارنة، هبط $BTC بنسبة 1.7% في الفترة نفسها إلى 63,612 USDT، أي أن حركة MMT كانت أكبر بكثير من حركة السوق العام. ومن الأصول التي تحركت في الاتجاه نفسه NVDAB بهبوط 4.3%.
ماذا يعني ذلك لك؟ إذا كنت تتابع MMT بعد هذه الحركة، فقد يبقى التقلب مرتفعاً إلى أن تتضح أسباب الصعود السابق. ولا شيء يؤكد أن الهبوط توقف.
الخلاصة: الحركة الكبيرة تجذب المتداولين، لكنها لا تخبرك بالاتجاه التالي.
لو كنت تحمل MMT بعد صعود 109.8%، ما أول شيء تفكر فيه الآن؟ 👇
#MMT #Volatility
المحتوى للمعلومات فقط وليس نصيحة مالية.
اضغط $MMT للتداول
$MMT $BTC
غيرك سبقك وتابع. ادخل بروفايلي وخلك مع اللي يقرأ قبل ما ينتشر الخبر.
تحرك السعر خلال اليوم بين 0.1933 و0.2833 USDT، أي أن الجلسة جربت الصعود والهبوط قبل أن تستقر قرب أدنى مستوى لها.
حجم التداول بلغ 39.8 مليون USDT، وهذا يؤكد وجود اهتمام حقيقي بالعملة لكنه لا يحدد الاتجاه. وسبب الارتفاع السابق بقي غير مؤكد.
للمقارنة، هبط $BTC بنسبة 1.7% في الفترة نفسها إلى 63,612 USDT، أي أن حركة MMT كانت أكبر بكثير من حركة السوق العام. ومن الأصول التي تحركت في الاتجاه نفسه NVDAB بهبوط 4.3%.
ماذا يعني ذلك لك؟ إذا كنت تتابع MMT بعد هذه الحركة، فقد يبقى التقلب مرتفعاً إلى أن تتضح أسباب الصعود السابق. ولا شيء يؤكد أن الهبوط توقف.
الخلاصة: الحركة الكبيرة تجذب المتداولين، لكنها لا تخبرك بالاتجاه التالي.
لو كنت تحمل MMT بعد صعود 109.8%، ما أول شيء تفكر فيه الآن؟ 👇
#MMT #Volatility
المحتوى للمعلومات فقط وليس نصيحة مالية.
اضغط $MMT للتداول
$MMT $BTC
غيرك سبقك وتابع. ادخل بروفايلي وخلك مع اللي يقرأ قبل ما ينتشر الخبر.
53

📏 Fixed % stop ya volatility stop? ATR 60 seconds mein.
ATR = Average True Range — asset ka average movement ek period mein.
1️⃣ Fixed 2% stop: calm mein jaldi cut, wild mein har noise par pakra jate ho
2️⃣ ATR stop: stop = k × ATR (aksar 1.5×) — jittery asset ke liye wider, calm ke liye tighter
3️⃣ Benefit: normal breathing space stop se bahar rehta hai
⚠️ Context: BTC subah ~64K se ab ~63.2K — chop din mein tight fixed stop pehle kha jata hai.
Wide stop = chota position (sizing rule wahi). ATR ruler hai, magic nahi.
$BTC #ATR #StopLoss #Volatility #CryptoEducation
📏 Fixed % stop ya volatility stop? ATR 60 seconds mein.
ATR = Average True Range — asset ka average movement ek period mein.
1️⃣ Fixed 2% stop: calm mein jaldi cut, wild mein har noise par pakra jate ho
2️⃣ ATR stop: stop = k × ATR (aksar 1.5×) — jittery asset ke liye wider, calm ke liye tighter
3️⃣ Benefit: normal breathing space stop se bahar rehta hai
⚠️ Context: BTC subah ~64K se ab ~63.2K — chop din mein tight fixed stop pehle kha jata hai.
Wide stop = chota position (sizing rule wahi). ATR ruler hai, magic nahi.
$BTC #ATR #StopLoss #Volatility #CryptoEducation
ATR = Average True Range — asset ka average movement ek period mein.
1️⃣ Fixed 2% stop: calm mein jaldi cut, wild mein har noise par pakra jate ho
2️⃣ ATR stop: stop = k × ATR (aksar 1.5×) — jittery asset ke liye wider, calm ke liye tighter
3️⃣ Benefit: normal breathing space stop se bahar rehta hai
⚠️ Context: BTC subah ~64K se ab ~63.2K — chop din mein tight fixed stop pehle kha jata hai.
Wide stop = chota position (sizing rule wahi). ATR ruler hai, magic nahi.
$BTC #ATR #StopLoss #Volatility #CryptoEducation

·
--
Статья
Understanding 24-Hour Range and Fear-Greed: A Simple Volatility CheckThe market has been slipping for a week, and the numbers are stark enough to merit a pause. I've been looking at two pieces of data that most newcomers overlook: the 24-hour price range and the Fear & Greed Index. Together they give a quick, data-driven sense of how nervous, or calm, the market really is.
What the 24-Hour Range Shows
A 24-hour range lists the lowest and highest price a coin traded at during the last day. For $BTC the range was $62,279 - $65,268, while $ETH moved between $1,733 - $1,836. $BNB's bounds were $576.00 - $599.42 and SOL's were $72.22 - $75.78. When the spread is wide relative to the coin's price, it signals higher short-term volatility. I find it useful to glance at the range before deciding whether a price move feels reasonable or a reaction to a news spike.
Why Fear & Greed Matters
The Fear & Greed Index quantifies market sentiment on a scale from 0 (Extreme Fear) to 100 (Extreme Greed). Today it sat at 11 (Extreme Fear), yesterday it was 12, and a week ago it was 29. Those numbers tell a story of lingering anxiety, which often precedes a period of consolidation or a potential bounce. I keep an eye on the index because sentiment can amplify price swings that the raw numbers alone don't explain.
Putting the Two Together
When you pair a tight 24-hour range with a low Fear & Greed reading, the market is usually in a holding pattern, waiting for a catalyst. Conversely, a wide range combined with extreme fear can produce sharp, erratic moves as traders react to risk. Right now $BTC's range of $62,279 - $65,268 sits alongside an index of 11, suggesting that while the price has room to move, many participants are still on the sidelines.
What to Watch Next
The next data point to track is the 24-hour volume, which for $BTC is $1.24B and for $ETH is $546M. Volume can confirm whether a breakout from the current range is supported by broader participation or is just a thin, speculative flare. I'll be watching those numbers closely over the next few days.
Do you think the current fear level will push the market into a short-term rebound, or will it keep the majors stuck in a narrow band?
Not financial advice
#Bitcoin #Crypto #Volatility #FearAndGreed
Understanding 24-Hour Range and Fear-Greed: A Simple Volatility Check
The market has been slipping for a week, and the numbers are stark enough to merit a pause. I've been looking at two pieces of data that most newcomers overlook: the 24-hour price range and the Fear & Greed Index. Together they give a quick, data-driven sense of how nervous, or calm, the market really is.
What the 24-Hour Range Shows
A 24-hour range lists the lowest and highest price a coin traded at during the last day. For $BTC the range was $62,279 - $65,268, while $ETH moved between $1,733 - $1,836. $BNB 's bounds were $576.00 - $599.42 and SOL's were $72.22 - $75.78. When the spread is wide relative to the coin's price, it signals higher short-term volatility. I find it useful to glance at the range before deciding whether a price move feels reasonable or a reaction to a news spike.
Why Fear & Greed Matters
The Fear & Greed Index quantifies market sentiment on a scale from 0 (Extreme Fear) to 100 (Extreme Greed). Today it sat at 11 (Extreme Fear), yesterday it was 12, and a week ago it was 29. Those numbers tell a story of lingering anxiety, which often precedes a period of consolidation or a potential bounce. I keep an eye on the index because sentiment can amplify price swings that the raw numbers alone don't explain.
Putting the Two Together
When you pair a tight 24-hour range with a low Fear & Greed reading, the market is usually in a holding pattern, waiting for a catalyst. Conversely, a wide range combined with extreme fear can produce sharp, erratic moves as traders react to risk. Right now $BTC 's range of $62,279 - $65,268 sits alongside an index of 11, suggesting that while the price has room to move, many participants are still on the sidelines.
What to Watch Next
The next data point to track is the 24-hour volume, which for $BTC is $1.24B and for $ETH is $546M. Volume can confirm whether a breakout from the current range is supported by broader participation or is just a thin, speculative flare. I'll be watching those numbers closely over the next few days.
Do you think the current fear level will push the market into a short-term rebound, or will it keep the majors stuck in a narrow band?
Not financial advice
#Bitcoin #Crypto #Volatility #FearAndGreed
What the 24-Hour Range Shows
A 24-hour range lists the lowest and highest price a coin traded at during the last day. For $BTC the range was $62,279 - $65,268, while $ETH moved between $1,733 - $1,836. $BNB 's bounds were $576.00 - $599.42 and SOL's were $72.22 - $75.78. When the spread is wide relative to the coin's price, it signals higher short-term volatility. I find it useful to glance at the range before deciding whether a price move feels reasonable or a reaction to a news spike.
Why Fear & Greed Matters
The Fear & Greed Index quantifies market sentiment on a scale from 0 (Extreme Fear) to 100 (Extreme Greed). Today it sat at 11 (Extreme Fear), yesterday it was 12, and a week ago it was 29. Those numbers tell a story of lingering anxiety, which often precedes a period of consolidation or a potential bounce. I keep an eye on the index because sentiment can amplify price swings that the raw numbers alone don't explain.
Putting the Two Together
When you pair a tight 24-hour range with a low Fear & Greed reading, the market is usually in a holding pattern, waiting for a catalyst. Conversely, a wide range combined with extreme fear can produce sharp, erratic moves as traders react to risk. Right now $BTC 's range of $62,279 - $65,268 sits alongside an index of 11, suggesting that while the price has room to move, many participants are still on the sidelines.
What to Watch Next
The next data point to track is the 24-hour volume, which for $BTC is $1.24B and for $ETH is $546M. Volume can confirm whether a breakout from the current range is supported by broader participation or is just a thin, speculative flare. I'll be watching those numbers closely over the next few days.
Do you think the current fear level will push the market into a short-term rebound, or will it keep the majors stuck in a narrow band?
Not financial advice
#Bitcoin #Crypto #Volatility #FearAndGreed
107

Bollinger Bands are designed to visualize volatility around a moving average.
The bands expand when price volatility increases and contract when volatility decreases. A narrowing band can indicate a quieter market, while a wider band reflects larger recent price fluctuations.
However, a breakout beyond an outer band does not automatically mean the price will continue in that direction. Markets can remain near an outer band during strong trends, and false breakouts are possible.
For volatile tokens such as $SHELL, Bollinger Bands are best used as a volatility reference alongside volume, trend structure, and other indicators.
#BollingerBands #Volatility #TechnicalAnalysis
Bollinger Bands are designed to visualize volatility around a moving average.
The bands expand when price volatility increases and contract when volatility decreases. A narrowing band can indicate a quieter market, while a wider band reflects larger recent price fluctuations.
However, a breakout beyond an outer band does not automatically mean the price will continue in that direction. Markets can remain near an outer band during strong trends, and false breakouts are possible.
For volatile tokens such as $SHELL , Bollinger Bands are best used as a volatility reference alongside volume, trend structure, and other indicators.
#BollingerBands #Volatility #TechnicalAnalysis
The bands expand when price volatility increases and contract when volatility decreases. A narrowing band can indicate a quieter market, while a wider band reflects larger recent price fluctuations.
However, a breakout beyond an outer band does not automatically mean the price will continue in that direction. Markets can remain near an outer band during strong trends, and false breakouts are possible.
For volatile tokens such as $SHELL , Bollinger Bands are best used as a volatility reference alongside volume, trend structure, and other indicators.
#BollingerBands #Volatility #TechnicalAnalysis

12
Bollinger Bands use a moving average and standard deviation to visualize recent price volatility.
When the bands widen, it generally indicates that price fluctuations have increased. When they narrow, the market has experienced a period of relatively lower volatility.
However, a narrow band does not guarantee an immediate breakout, and touching the upper or lower band does not guarantee a reversal.
For volatile tokens such as $SHELL, these bands can expand rapidly during sharp market moves.
They are best used as a volatility reference alongside volume and market structure, not as an independent buy or sell signal.
#BollingerBands #Volatility #TechnicalAnalysis
Bollinger Bands use a moving average and standard deviation to visualize recent price volatility.
When the bands widen, it generally indicates that price fluctuations have increased. When they narrow, the market has experienced a period of relatively lower volatility.
However, a narrow band does not guarantee an immediate breakout, and touching the upper or lower band does not guarantee a reversal.
For volatile tokens such as $SHELL , these bands can expand rapidly during sharp market moves.
They are best used as a volatility reference alongside volume and market structure, not as an independent buy or sell signal.
#BollingerBands #Volatility #TechnicalAnalysis
When the bands widen, it generally indicates that price fluctuations have increased. When they narrow, the market has experienced a period of relatively lower volatility.
However, a narrow band does not guarantee an immediate breakout, and touching the upper or lower band does not guarantee a reversal.
For volatile tokens such as $SHELL , these bands can expand rapidly during sharp market moves.
They are best used as a volatility reference alongside volume and market structure, not as an independent buy or sell signal.
#BollingerBands #Volatility #TechnicalAnalysis
8

·
--
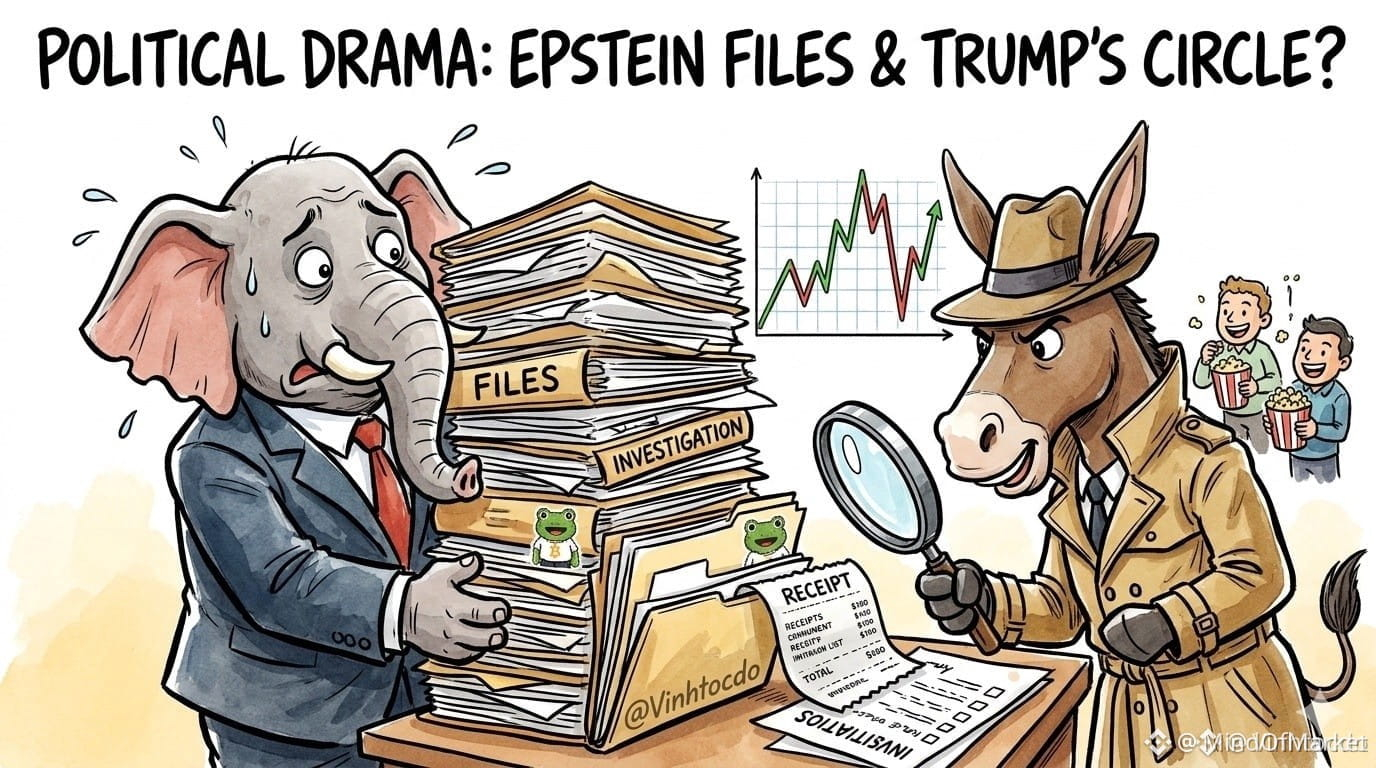
🚨 MACRO NOISE AROUND $TRUMP IS TRIGGERING VOLATILITY SWEEPS ACROSS EVENT-DRIVEN ASSETS ⚡
Headline-driven macro catalysts frequently act as engineered liquidity sweeps, trapping reactive participants before the true trend extension resumes. 📊 We are observing sharp volatility expansion on $TRUMP as algorithmic liquidity hunts key structural boundaries.
Smart money utilizes these headline spikes to absorb inventory rather than chasing impulsive momentum without structural confirmation. 💡 Always tighten risk parameters and lower leverage when event risk elevates systemic variance.
💬 How are you positioning your risk exposure while these macro catalysts drive short-term order flow? 👇
⚠️ Not financial advice. Always manage your risk. 🛡️
🏷️ #TRUMP #MarketStructure #Volatility #Crypto
🔥 💎
🚨 MACRO NOISE AROUND $TRUMP IS TRIGGERING VOLATILITY SWEEPS ACROSS EVENT-DRIVEN ASSETS ⚡
Headline-driven macro catalysts frequently act as engineered liquidity sweeps, trapping reactive participants before the true trend extension resumes. 📊 We are observing sharp volatility expansion on $TRUMP as algorithmic liquidity hunts key structural boundaries.
Smart money utilizes these headline spikes to absorb inventory rather than chasing impulsive momentum without structural confirmation. 💡 Always tighten risk parameters and lower leverage when event risk elevates systemic variance.
💬 How are you positioning your risk exposure while these macro catalysts drive short-term order flow? 👇
⚠️ Not financial advice. Always manage your risk. 🛡️
🏷️ #TRUMP #MarketStructure #Volatility #Crypto
🔥 💎
Headline-driven macro catalysts frequently act as engineered liquidity sweeps, trapping reactive participants before the true trend extension resumes. 📊 We are observing sharp volatility expansion on $TRUMP as algorithmic liquidity hunts key structural boundaries.
Smart money utilizes these headline spikes to absorb inventory rather than chasing impulsive momentum without structural confirmation. 💡 Always tighten risk parameters and lower leverage when event risk elevates systemic variance.
💬 How are you positioning your risk exposure while these macro catalysts drive short-term order flow? 👇
⚠️ Not financial advice. Always manage your risk. 🛡️
🏷️ #TRUMP #MarketStructure #Volatility #Crypto
🔥 💎
10

🚨 $BTC BRACES FOR MACRO VOLATILITY AS FOMC MINUTES HIT THE WIRE! ⚡
Macro desks are holding their breath ahead of the Federal Reserve meeting minutes dropping at 2 PM ET. Algorithmic sweeps usually front-run the headline print, creating brutal traps for impatient breakout chasers on both sides of the order book. 📊
A hawkish tone will likely invite aggressive bids testing lower support clusters, while a dovish tilt could spark a rapid relief rally across crypto majors. ⚡ Patience is the ultimate edge here—let the initial volatility settle before committing capital to a directional sweep. 💡
💬 Are you positioning ahead of the print or waiting for the dust to clear? 👇
⚠️ Not financial advice. Always manage your risk. 🛡️
🏷️ #BTC #Macro #Volatility #Crypto
🔥 💎
🚨 $BTC BRACES FOR MACRO VOLATILITY AS FOMC MINUTES HIT THE WIRE! ⚡
Macro desks are holding their breath ahead of the Federal Reserve meeting minutes dropping at 2 PM ET. Algorithmic sweeps usually front-run the headline print, creating brutal traps for impatient breakout chasers on both sides of the order book. 📊
A hawkish tone will likely invite aggressive bids testing lower support clusters, while a dovish tilt could spark a rapid relief rally across crypto majors. ⚡ Patience is the ultimate edge here—let the initial volatility settle before committing capital to a directional sweep. 💡
💬 Are you positioning ahead of the print or waiting for the dust to clear? 👇
⚠️ Not financial advice. Always manage your risk. 🛡️
🏷️ #BTC #Macro #Volatility #Crypto
🔥 💎
Macro desks are holding their breath ahead of the Federal Reserve meeting minutes dropping at 2 PM ET. Algorithmic sweeps usually front-run the headline print, creating brutal traps for impatient breakout chasers on both sides of the order book. 📊
A hawkish tone will likely invite aggressive bids testing lower support clusters, while a dovish tilt could spark a rapid relief rally across crypto majors. ⚡ Patience is the ultimate edge here—let the initial volatility settle before committing capital to a directional sweep. 💡
💬 Are you positioning ahead of the print or waiting for the dust to clear? 👇
⚠️ Not financial advice. Always manage your risk. 🛡️
🏷️ #BTC #Macro #Volatility #Crypto
🔥 💎

11

·
--
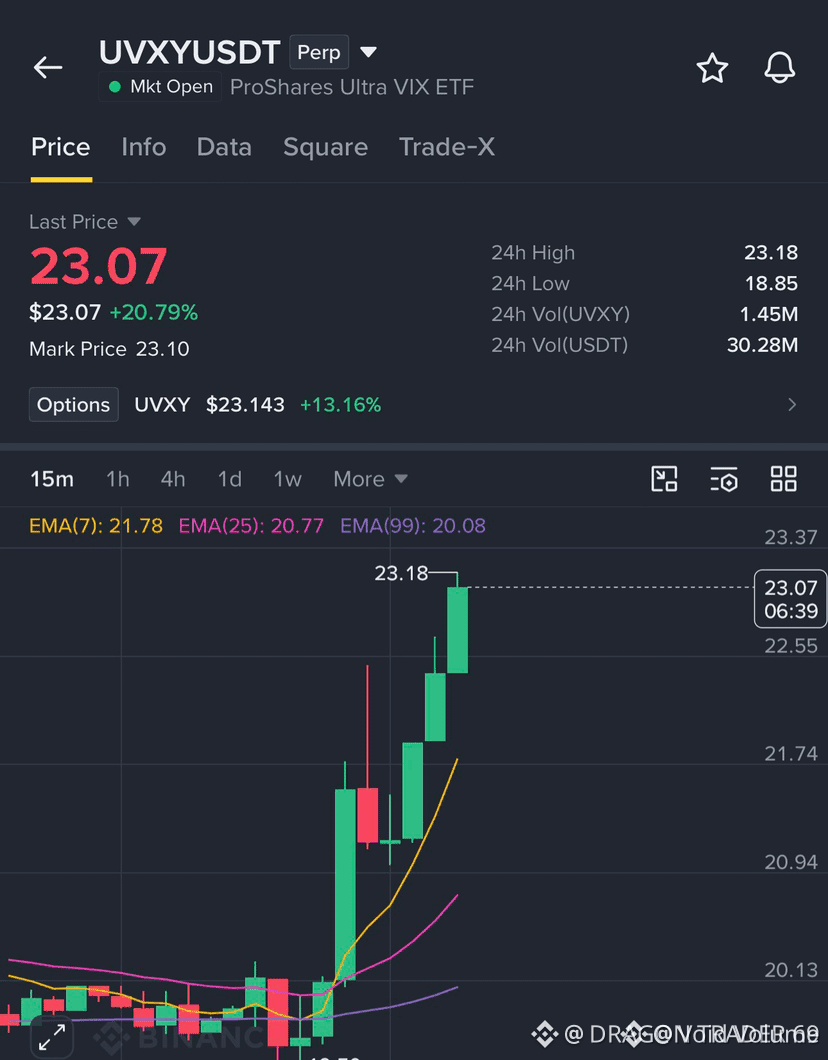
🚨 $UVXY SHOWS INSTITUTIONAL ACCUMULATION AS VOLATILITY BREAKS KEY RESISTANCE! 📈
Entry: 22.90 – 23.07 ⚡
Target: 25.50 🚀
Stop Loss: 22.00 ⚠️
Institutional order flow is currently retesting the lower boundary of this structural imbalance, absorbing trapped supply. Volume profile metrics indicate aggressive participation building right inside the demand cluster. 📊
Smart money positioning suggests a measured expansion toward higher liquidity pools as momentum shifts cleanly in favor of buyers. ⚡
Are you scaling into this institutional retest or waiting for confirmation above range resistance? 👇
⚠️ Not financial advice. Always manage your risk. 🛡️
🏷️ #UVXY #LongSetup #MarketStructure #Volatility
🔥 💎
🚨 $UVXY SHOWS INSTITUTIONAL ACCUMULATION AS VOLATILITY BREAKS KEY RESISTANCE! 📈
Entry: 22.90 – 23.07 ⚡
Target: 25.50 🚀
Stop Loss: 22.00 ⚠️
Institutional order flow is currently retesting the lower boundary of this structural imbalance, absorbing trapped supply. Volume profile metrics indicate aggressive participation building right inside the demand cluster. 📊
Smart money positioning suggests a measured expansion toward higher liquidity pools as momentum shifts cleanly in favor of buyers. ⚡
Are you scaling into this institutional retest or waiting for confirmation above range resistance? 👇
⚠️ Not financial advice. Always manage your risk. 🛡️
🏷️ #UVXY #LongSetup #MarketStructure #Volatility
🔥 💎
Entry: 22.90 – 23.07 ⚡
Target: 25.50 🚀
Stop Loss: 22.00 ⚠️
Institutional order flow is currently retesting the lower boundary of this structural imbalance, absorbing trapped supply. Volume profile metrics indicate aggressive participation building right inside the demand cluster. 📊
Smart money positioning suggests a measured expansion toward higher liquidity pools as momentum shifts cleanly in favor of buyers. ⚡
Are you scaling into this institutional retest or waiting for confirmation above range resistance? 👇
⚠️ Not financial advice. Always manage your risk. 🛡️
🏷️ #UVXY #LongSetup #MarketStructure #Volatility
🔥 💎

🚨 GEOPOLITICAL SHOCKS ARE IGNITING VOLATILITY ACROSS RISK ASSETS LIKE $TRUMP ! ⚡
Macro headlines are hitting the wire with Washington and Tehran tensions escalating rapidly, threatening to send shockwaves through risk-sensitive order books. ⚡
When geopolitical friction collides with a heavy week of macroeconomic data, smart money expects sudden liquidity sweeps and erratic price action across political tokens like $TRUMP . 📊
Keep powder dry and leverage low while the market absorbs these incoming macro catalysts. 💡 How are you adjusting your risk parameters before the next headline drops? 👇
⚠️ Not financial advice. Always manage your risk. 🛡️
🏷️ #TRUMP #Geopolitics #Crypto #Volatility
🔥 💎
🚨 GEOPOLITICAL SHOCKS ARE IGNITING VOLATILITY ACROSS RISK ASSETS LIKE $TRUMP ! ⚡
Macro headlines are hitting the wire with Washington and Tehran tensions escalating rapidly, threatening to send shockwaves through risk-sensitive order books. ⚡
When geopolitical friction collides with a heavy week of macroeconomic data, smart money expects sudden liquidity sweeps and erratic price action across political tokens like $TRUMP . 📊
Keep powder dry and leverage low while the market absorbs these incoming macro catalysts. 💡 How are you adjusting your risk parameters before the next headline drops? 👇
⚠️ Not financial advice. Always manage your risk. 🛡️
🏷️ #TRUMP #Geopolitics #Crypto #Volatility
🔥 💎
Macro headlines are hitting the wire with Washington and Tehran tensions escalating rapidly, threatening to send shockwaves through risk-sensitive order books. ⚡
When geopolitical friction collides with a heavy week of macroeconomic data, smart money expects sudden liquidity sweeps and erratic price action across political tokens like $TRUMP . 📊
Keep powder dry and leverage low while the market absorbs these incoming macro catalysts. 💡 How are you adjusting your risk parameters before the next headline drops? 👇
⚠️ Not financial advice. Always manage your risk. 🛡️
🏷️ #TRUMP #Geopolitics #Crypto #Volatility
🔥 💎

3

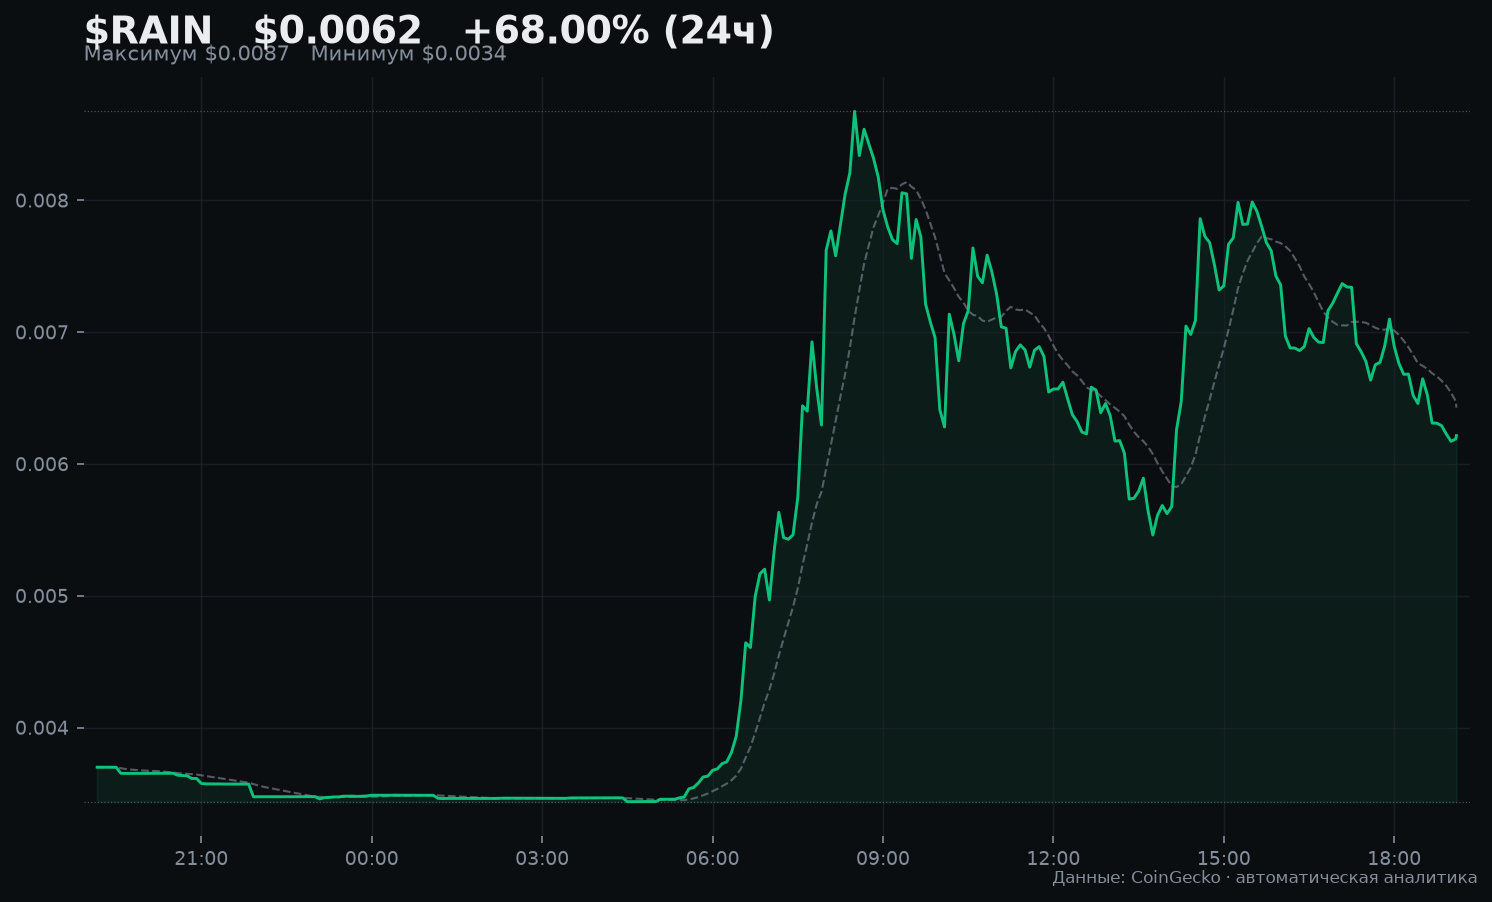
⚡ Срочно: $RAIN теряет 10,9% за последний час — цена опустилась до $0.00619059. Монета продолжает демонстрировать экстремальную волатильность. Видимых фундаментальных триггеров в публичном пространстве не зафиксировано — движение, вероятно, носит технический характер.
$BTC $RAIN #Volatility
⚡ Срочно: $RAIN теряет 10,9% за последний час — цена опустилась до $0.00619059. Монета продолжает демонстрировать экстремальную волатильность. Видимых фундаментальных триггеров в публичном пространстве не зафиксировано — движение, вероятно, носит технический характер.
$BTC $RAIN #Volatility
$BTC $RAIN #Volatility
32

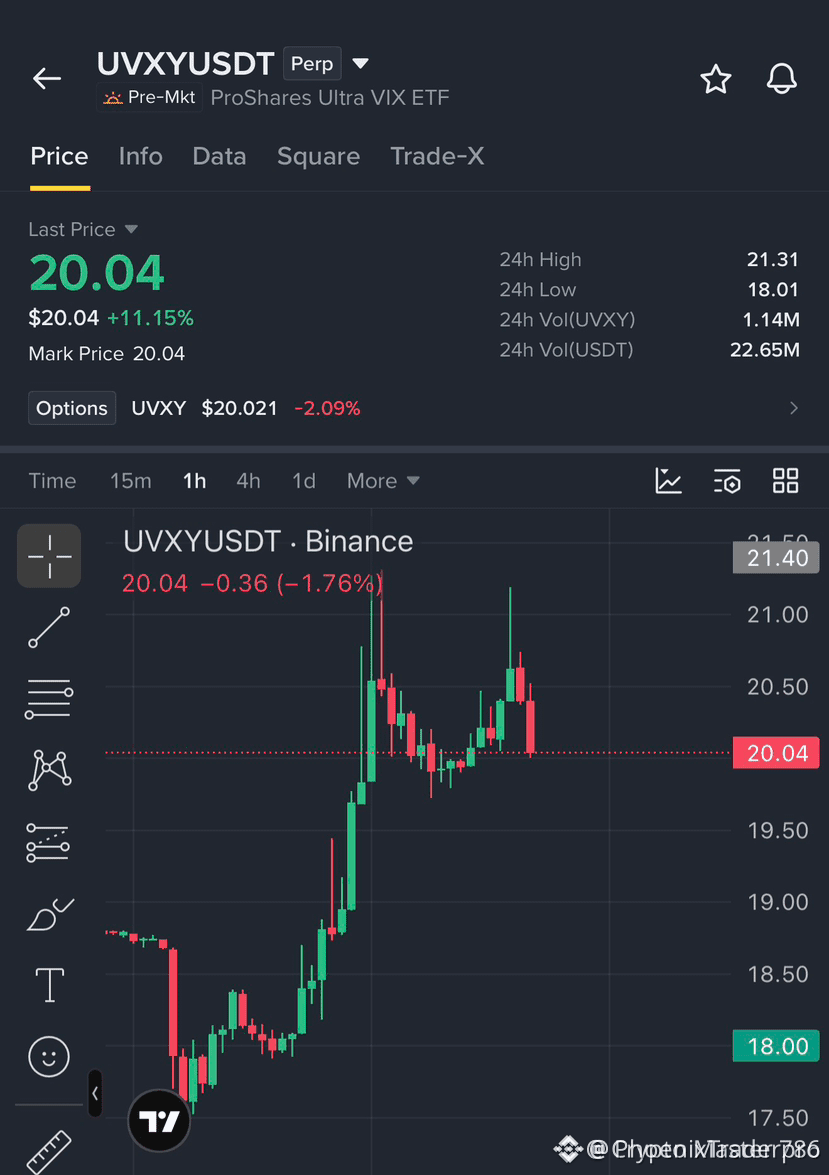
🚨 SELLERS ARE TIGHTENING THEIR GRIP ON $UVXYB AS MOMENTUM FADES FAST 📉
Target: $18.00 🚀
Stop Loss: $21.40 ⚠️
Volatility spikes rarely sustain themselves when the order book flips heavy on the ask side. 📊 Sellers are patiently leaning against resistance, draining liquidity while buyers run out of gas. ⚡
This fading momentum creates a clean asymmetric short setup as structure rolls over on the lower timeframes. 💡 Are you fading this exhaustion bounce or waiting for a breakdown confirmation? 👇
⚠️ Not financial advice. Always manage your risk. 🛡️
🏷️ #UVXYB #ShortSetup #Volatility #Trading
🔥 💎
🚨 SELLERS ARE TIGHTENING THEIR GRIP ON $UVXYB AS MOMENTUM FADES FAST 📉
Target: $18.00 🚀
Stop Loss: $21.40 ⚠️
Volatility spikes rarely sustain themselves when the order book flips heavy on the ask side. 📊 Sellers are patiently leaning against resistance, draining liquidity while buyers run out of gas. ⚡
This fading momentum creates a clean asymmetric short setup as structure rolls over on the lower timeframes. 💡 Are you fading this exhaustion bounce or waiting for a breakdown confirmation? 👇
⚠️ Not financial advice. Always manage your risk. 🛡️
🏷️ #UVXYB #ShortSetup #Volatility #Trading
🔥 💎
Target: $18.00 🚀
Stop Loss: $21.40 ⚠️
Volatility spikes rarely sustain themselves when the order book flips heavy on the ask side. 📊 Sellers are patiently leaning against resistance, draining liquidity while buyers run out of gas. ⚡
This fading momentum creates a clean asymmetric short setup as structure rolls over on the lower timeframes. 💡 Are you fading this exhaustion bounce or waiting for a breakdown confirmation? 👇
⚠️ Not financial advice. Always manage your risk. 🛡️
🏷️ #UVXYB #ShortSetup #Volatility #Trading
🔥 💎
10
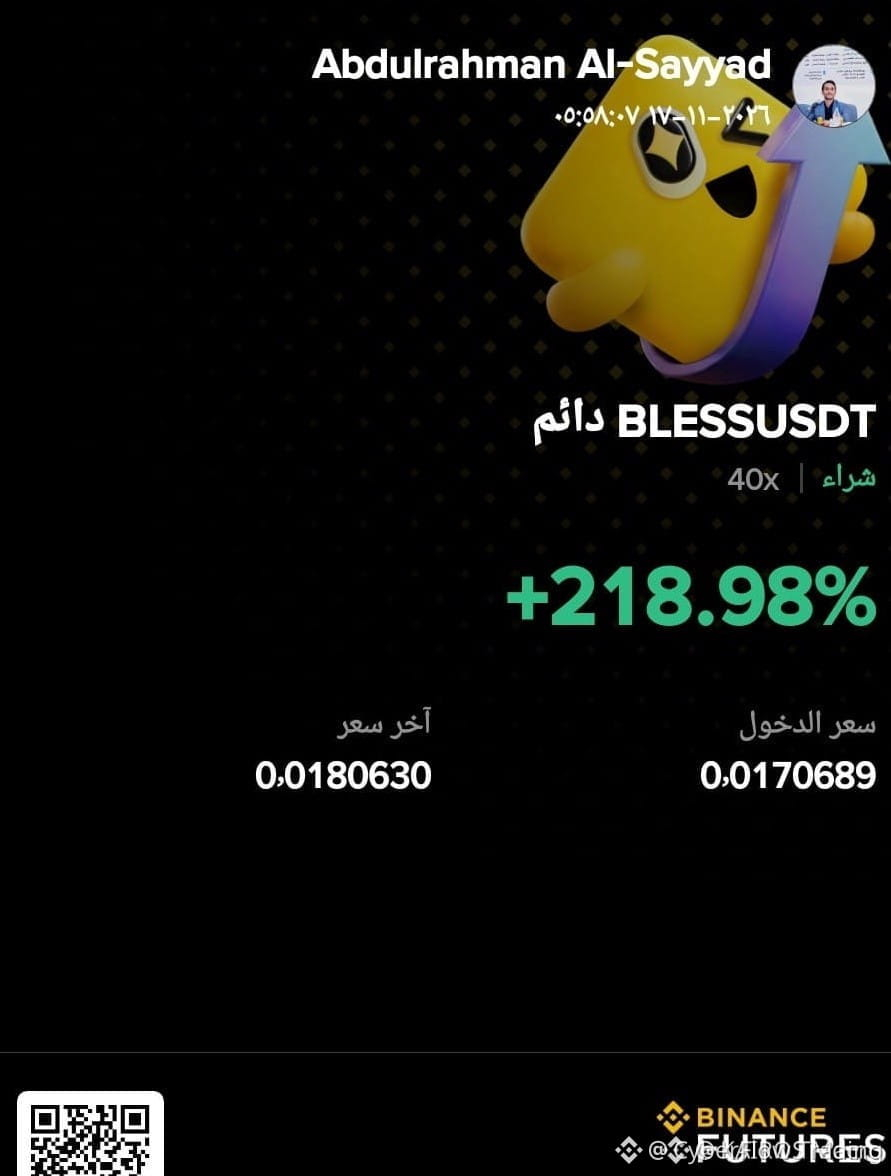
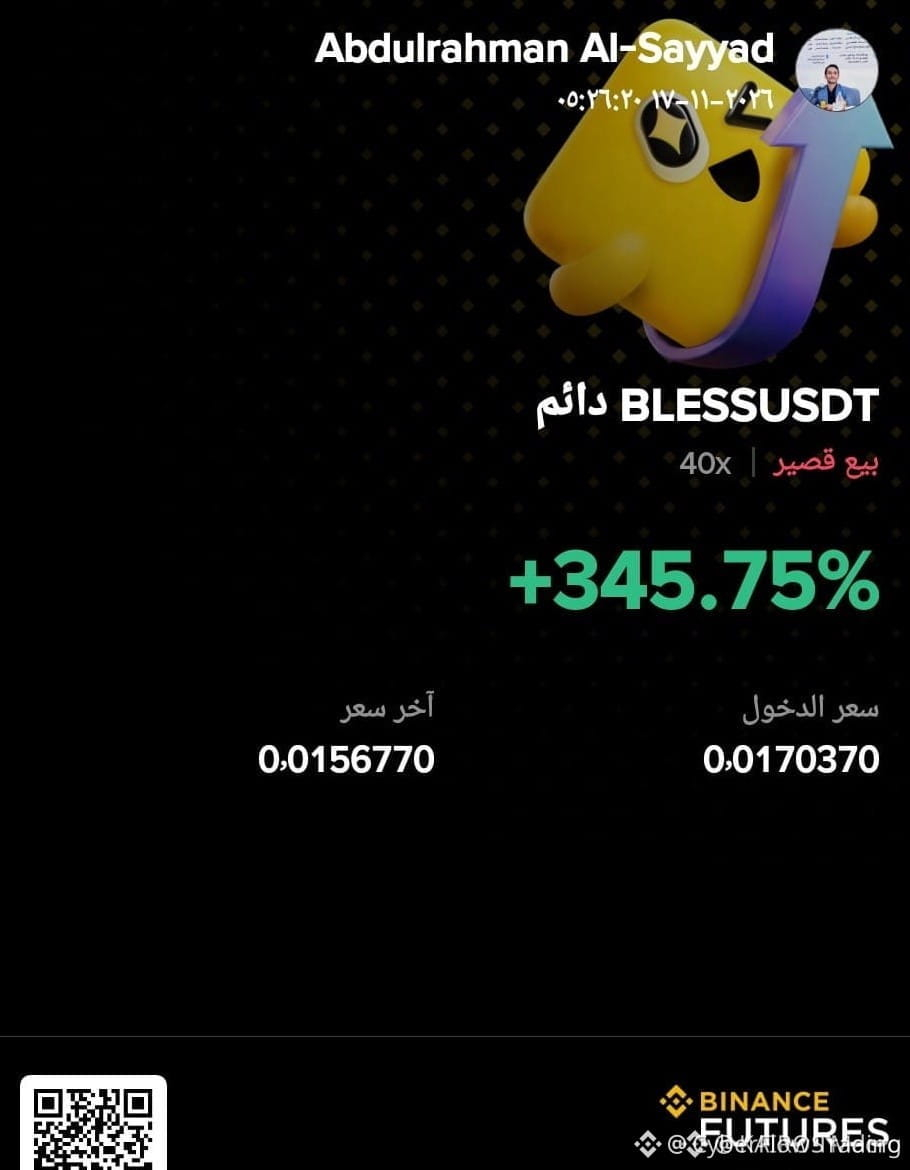
🚨 $BLESS WHIPSAW WIPED 50% SWINGS IN SECONDS BEFORE THE REAL BATTLE BEGAN! ⚡
The market just delivered a masterclass in liquidity annihilation, shaking out leveraged positions with ruthless precision. ⚡ That fifty percent portfolio swing caught emotional traders completely flat-footed while order books violently flushed both sides.
Surviving these brutal volatility spikes demands absolute discipline and ice in your veins rather than blind hope. 📊 When price action turns into a chaotic battlefield, capital preservation always trumps chasing reckless green candles.
💬 Are you managing to keep your risk tightly controlled through this madness or taking damage? 👇
⚠️ Not financial advice. Always manage your risk. 🛡️
🏷️ #BLESS #RiskManagement #CryptoTrading #Volatility
🔥 💎
🚨 $BLESS WHIPSAW WIPED 50% SWINGS IN SECONDS BEFORE THE REAL BATTLE BEGAN! ⚡
The market just delivered a masterclass in liquidity annihilation, shaking out leveraged positions with ruthless precision. ⚡ That fifty percent portfolio swing caught emotional traders completely flat-footed while order books violently flushed both sides.
Surviving these brutal volatility spikes demands absolute discipline and ice in your veins rather than blind hope. 📊 When price action turns into a chaotic battlefield, capital preservation always trumps chasing reckless green candles.
💬 Are you managing to keep your risk tightly controlled through this madness or taking damage? 👇
⚠️ Not financial advice. Always manage your risk. 🛡️
🏷️ #BLESS #RiskManagement #CryptoTrading #Volatility
🔥 💎
The market just delivered a masterclass in liquidity annihilation, shaking out leveraged positions with ruthless precision. ⚡ That fifty percent portfolio swing caught emotional traders completely flat-footed while order books violently flushed both sides.
Surviving these brutal volatility spikes demands absolute discipline and ice in your veins rather than blind hope. 📊 When price action turns into a chaotic battlefield, capital preservation always trumps chasing reckless green candles.
💬 Are you managing to keep your risk tightly controlled through this madness or taking damage? 👇
⚠️ Not financial advice. Always manage your risk. 🛡️
🏷️ #BLESS #RiskManagement #CryptoTrading #Volatility
🔥 💎
5
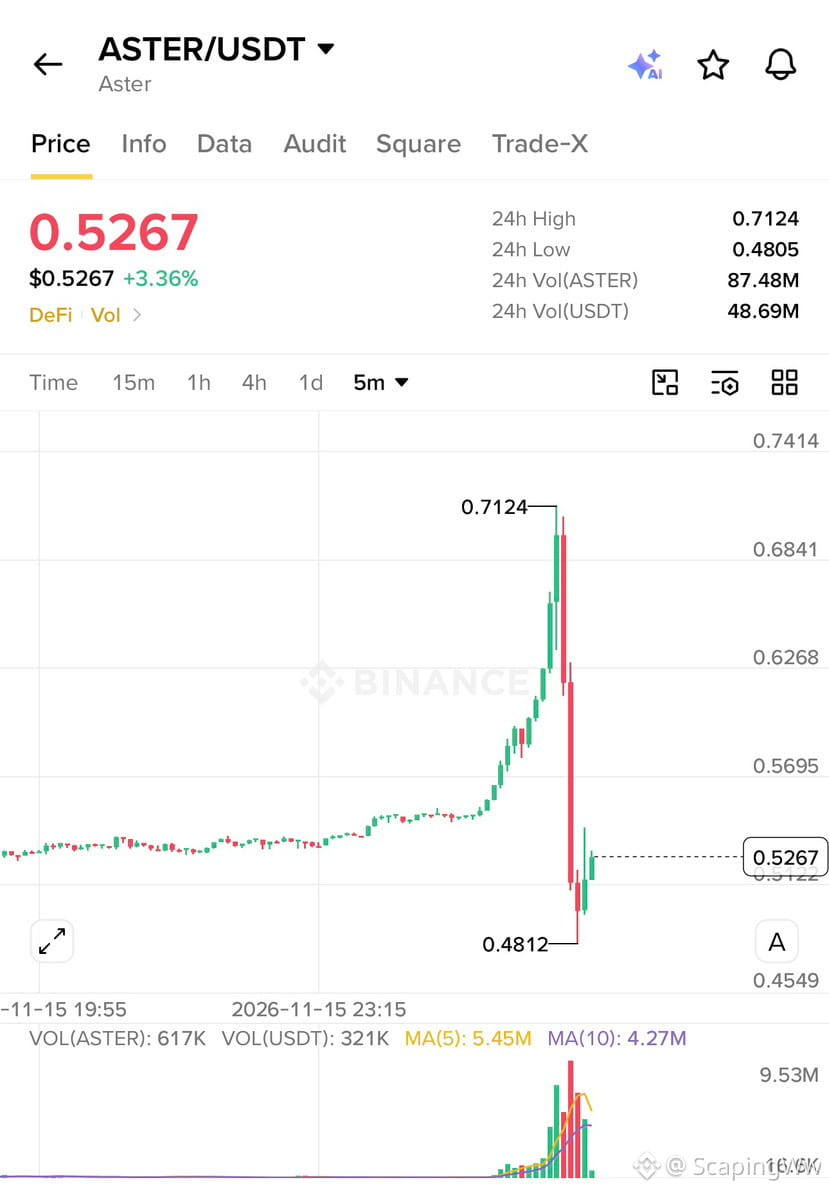
🚨 $ASTER VAPORIZES 32% IN MINUTES BEFORE A SHARP LIQUIDATION RECOVERY! 💥
Entry: 0.48 ⚡
Leveraged bloodbath played out in real time as $ASTER slammed from above 0.71 down to 0.48 within minutes before clawing back to 0.55. Futures turnover exploded 121 percent to 1.29 billion dollars while spot volume surged 67 percent, flushing out over nine million in liquidations. 🌊
The violent flush wiped out nearly six million in long positions while shorts took a three million dollar hit during the chaos. Investigations into the sudden cascade are ongoing while market operations remain steady. 📊
💬 Were you fast enough to catch that wick or did the volatility shake you out completely? 👇
⚠️ Not financial advice. Always manage your risk. 🛡️
🏷️ #ASTER #Liquidations #Volatility #Crypto
🦈 ⚡
🚨 $ASTER VAPORIZES 32% IN MINUTES BEFORE A SHARP LIQUIDATION RECOVERY! 💥
Entry: 0.48 ⚡
Leveraged bloodbath played out in real time as $ASTER slammed from above 0.71 down to 0.48 within minutes before clawing back to 0.55. Futures turnover exploded 121 percent to 1.29 billion dollars while spot volume surged 67 percent, flushing out over nine million in liquidations. 🌊
The violent flush wiped out nearly six million in long positions while shorts took a three million dollar hit during the chaos. Investigations into the sudden cascade are ongoing while market operations remain steady. 📊
💬 Were you fast enough to catch that wick or did the volatility shake you out completely? 👇
⚠️ Not financial advice. Always manage your risk. 🛡️
🏷️ #ASTER #Liquidations #Volatility #Crypto
🦈 ⚡
Entry: 0.48 ⚡
Leveraged bloodbath played out in real time as $ASTER slammed from above 0.71 down to 0.48 within minutes before clawing back to 0.55. Futures turnover exploded 121 percent to 1.29 billion dollars while spot volume surged 67 percent, flushing out over nine million in liquidations. 🌊
The violent flush wiped out nearly six million in long positions while shorts took a three million dollar hit during the chaos. Investigations into the sudden cascade are ongoing while market operations remain steady. 📊
💬 Were you fast enough to catch that wick or did the volatility shake you out completely? 👇
⚠️ Not financial advice. Always manage your risk. 🛡️
🏷️ #ASTER #Liquidations #Volatility #Crypto
🦈 ⚡
2

·
--
Ринковий шторм вразив біржу Aster! Їхній токен обвалився на 32% всього за кілька хвилин через масовий каскад ліквідацій з високим плечем. Керівництво запевняє, що платформа працює у штатному режимі, проте ситуація виглядає напруженою. Для трейдерів це жорстоке нагадування про небезпеку надмірного кредитного плеча. Пильно стежте за ризиками та рівнями маржі, адже волаטיльність зараз на максимум. Джерело: Cointelegraph
#CryptoMarket #Trading #Volatility
Ринковий шторм вразив біржу Aster! Їхній токен обвалився на 32% всього за кілька хвилин через масовий каскад ліквідацій з високим плечем. Керівництво запевняє, що платформа працює у штатному режимі, проте ситуація виглядає напруженою. Для трейдерів це жорстоке нагадування про небезпеку надмірного кредитного плеча. Пильно стежте за ризиками та рівнями маржі, адже волаטיльність зараз на максимум. Джерело: Cointelegraph
#CryptoMarket #Trading #Volatility
#CryptoMarket #Trading #Volatility

6

·
--
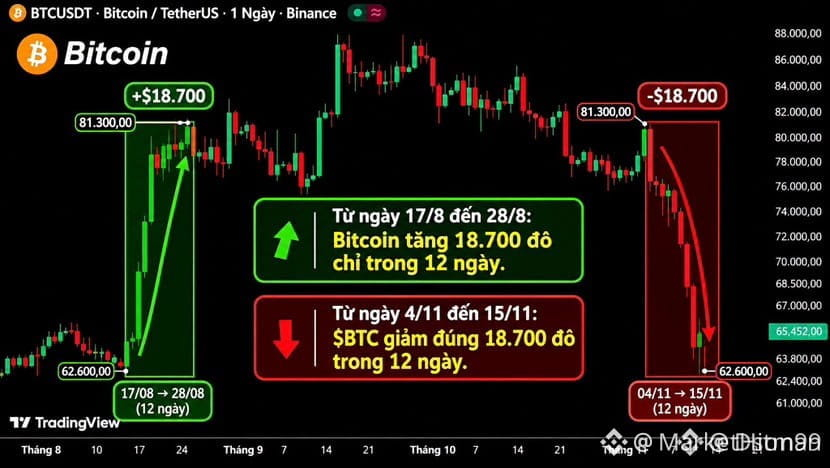
🚨 TWELVE DAYS TO GAIN IT, TWELVE DAYS TO LOSE IT ON $BTC 📉
Markets love their symmetry of pain and euphoria. When $BTC sprinted eighteen thousand seven hundred dollars higher across twelve wild days in August, bulls declared victory far too early.
November flipped the script with brutal precision, erasing that exact magnitude in another twelve-day flash flood that left altcoins like $LINK and $CT bleeding liquidity across the board. 📊
Volatility remains a double-edged sword where structural traps catch emotional traders off guard. 🤔 Are you positioned for the next symmetrical leg or waiting for the sweep to complete? 👇
⚠️ Not financial advice. Always manage your risk. 🛡️
🏷️ #BTC #Volatility #MarketCycles #Crypto
⚡ 🎯
🚨 TWELVE DAYS TO GAIN IT, TWELVE DAYS TO LOSE IT ON $BTC 📉
Markets love their symmetry of pain and euphoria. When $BTC sprinted eighteen thousand seven hundred dollars higher across twelve wild days in August, bulls declared victory far too early.
November flipped the script with brutal precision, erasing that exact magnitude in another twelve-day flash flood that left altcoins like $LINK and $CT bleeding liquidity across the board. 📊
Volatility remains a double-edged sword where structural traps catch emotional traders off guard. 🤔 Are you positioned for the next symmetrical leg or waiting for the sweep to complete? 👇
⚠️ Not financial advice. Always manage your risk. 🛡️
🏷️ #BTC #Volatility #MarketCycles #Crypto
⚡ 🎯
Markets love their symmetry of pain and euphoria. When $BTC sprinted eighteen thousand seven hundred dollars higher across twelve wild days in August, bulls declared victory far too early.
November flipped the script with brutal precision, erasing that exact magnitude in another twelve-day flash flood that left altcoins like $LINK and $CT bleeding liquidity across the board. 📊
Volatility remains a double-edged sword where structural traps catch emotional traders off guard. 🤔 Are you positioned for the next symmetrical leg or waiting for the sweep to complete? 👇
⚠️ Not financial advice. Always manage your risk. 🛡️
🏷️ #BTC #Volatility #MarketCycles #Crypto
⚡ 🎯
25

·
--
⚡ $BTC JUST FLASHED A VIOLENT LIQUIDITY SWEEP THAT CLEARED THE BOOKS 🦈
That sudden price vacuum tore through the order books in milliseconds, trapping aggressive breakout traders on the wrong side of the ledger. 🌊
Market makers love clearing out late leverage before establishing the next true directional bias. 📊
We are watching how price behaves around this newly formed pocket to see if buyers can reclaim control or if sellers are pressing their advantage. 🤔
💬 Did that sudden volatility spike catch you positioned or did you stay flat? 👇
⚠️ Not financial advice. Always manage your risk. 🛡️
🏷️ #BTC #LiquiditySweep #Volatility #Crypto
🔥 💎
⚡ $BTC JUST FLASHED A VIOLENT LIQUIDITY SWEEP THAT CLEARED THE BOOKS 🦈
That sudden price vacuum tore through the order books in milliseconds, trapping aggressive breakout traders on the wrong side of the ledger. 🌊
Market makers love clearing out late leverage before establishing the next true directional bias. 📊
We are watching how price behaves around this newly formed pocket to see if buyers can reclaim control or if sellers are pressing their advantage. 🤔
💬 Did that sudden volatility spike catch you positioned or did you stay flat? 👇
⚠️ Not financial advice. Always manage your risk. 🛡️
🏷️ #BTC #LiquiditySweep #Volatility #Crypto
🔥 💎
That sudden price vacuum tore through the order books in milliseconds, trapping aggressive breakout traders on the wrong side of the ledger. 🌊
Market makers love clearing out late leverage before establishing the next true directional bias. 📊
We are watching how price behaves around this newly formed pocket to see if buyers can reclaim control or if sellers are pressing their advantage. 🤔
💬 Did that sudden volatility spike catch you positioned or did you stay flat? 👇
⚠️ Not financial advice. Always manage your risk. 🛡️
🏷️ #BTC #LiquiditySweep #Volatility #Crypto
🔥 💎
31

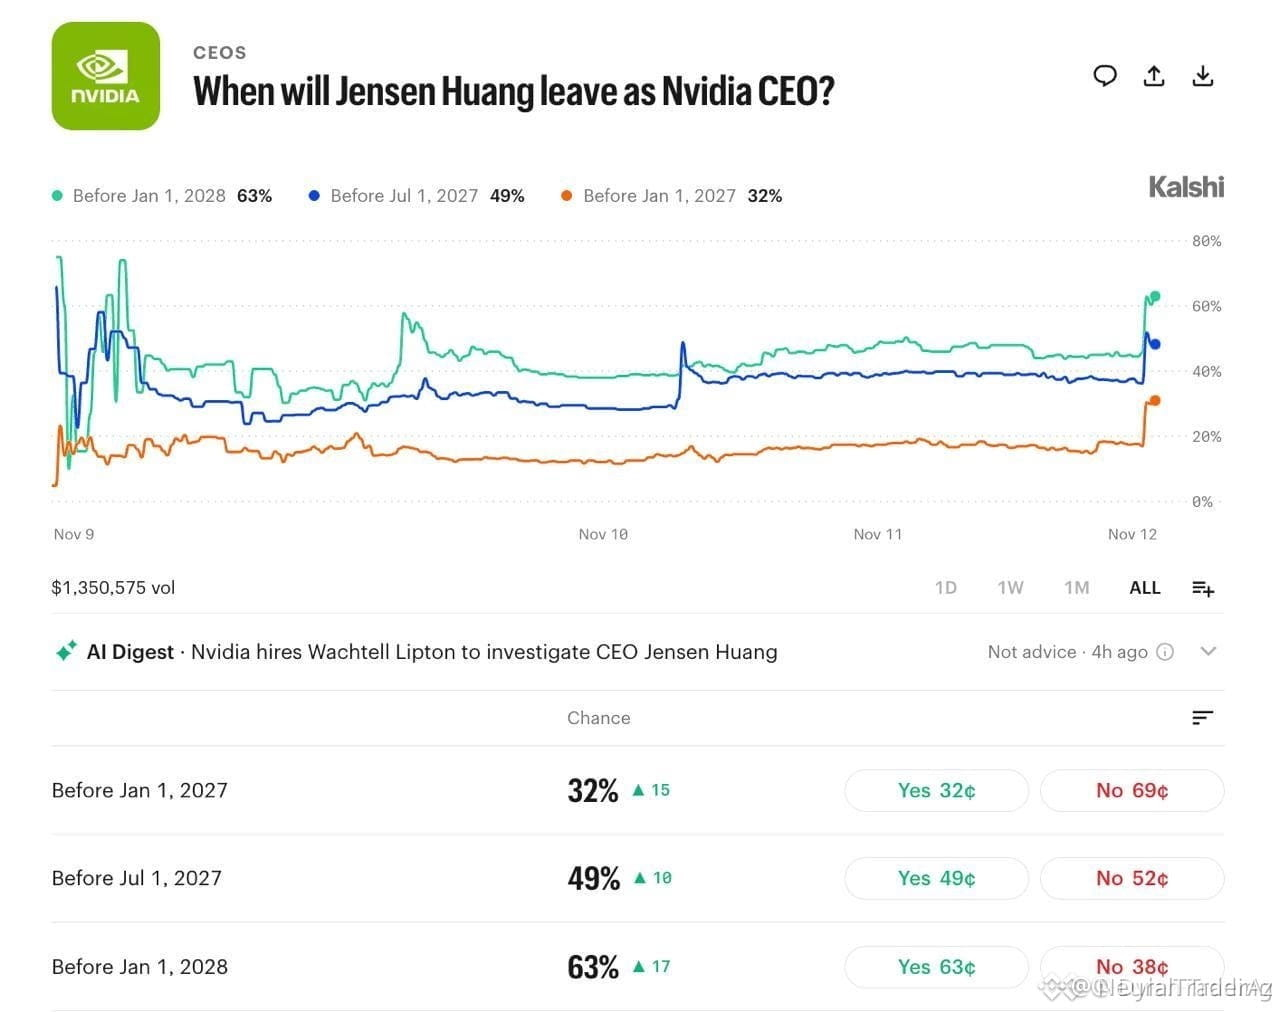
🚨 $SNXXB VOLATILITY SPIKES AS SMART MONEY HEDGES CRITICAL LEADERSHIP SHIFT UNCERTAINTY ⚡
Institutional desks are actively pricing in structural friction as prediction markets spike the odds of a high-profile executive departure by early 2027. This sudden repricing reflects underlying institutional hedging against potential supply-chain vulnerability. 📊
Order flow reveals smart money tightening volatility parameters across related assets like $MUUB and $AGT to absorb potential liquidity shocks. As macro uncertainty intersects with internal roadmap pressures, expect tighter ranges before a decisive structural break. ⚡ 💡
💬 Are institutional desks overpricing this leadership risk, or is a major structural re-allocation underway? 👇
⚠️ Not financial advice. Always manage your risk. 🛡️
🏷️ #SNXXB #SmartMoney #Volatility #Crypto
🔥 💎
🚨 $SNXXB VOLATILITY SPIKES AS SMART MONEY HEDGES CRITICAL LEADERSHIP SHIFT UNCERTAINTY ⚡
Institutional desks are actively pricing in structural friction as prediction markets spike the odds of a high-profile executive departure by early 2027. This sudden repricing reflects underlying institutional hedging against potential supply-chain vulnerability. 📊
Order flow reveals smart money tightening volatility parameters across related assets like $MUUB and $AGT to absorb potential liquidity shocks. As macro uncertainty intersects with internal roadmap pressures, expect tighter ranges before a decisive structural break. ⚡ 💡
💬 Are institutional desks overpricing this leadership risk, or is a major structural re-allocation underway? 👇
⚠️ Not financial advice. Always manage your risk. 🛡️
🏷️ #SNXXB #SmartMoney #Volatility #Crypto
🔥 💎
Institutional desks are actively pricing in structural friction as prediction markets spike the odds of a high-profile executive departure by early 2027. This sudden repricing reflects underlying institutional hedging against potential supply-chain vulnerability. 📊
Order flow reveals smart money tightening volatility parameters across related assets like $MUUB and $AGT to absorb potential liquidity shocks. As macro uncertainty intersects with internal roadmap pressures, expect tighter ranges before a decisive structural break. ⚡ 💡
💬 Are institutional desks overpricing this leadership risk, or is a major structural re-allocation underway? 👇
⚠️ Not financial advice. Always manage your risk. 🛡️
🏷️ #SNXXB #SmartMoney #Volatility #Crypto
🔥 💎
17

·
--
$SOL $BNB $ETH
Why does market volatility matter?
Volatility creates opportunities, but it also increases risk.
Fast price movements can trigger stop-losses and liquidations.
Never choose leverage just because the market is moving fast.
#CryptoTrading #volatility #RiskManagement
$SOL $BNB $ETH
Why does market volatility matter?
Volatility creates opportunities, but it also increases risk.
Fast price movements can trigger stop-losses and liquidations.
Never choose leverage just because the market is moving fast.
#CryptoTrading #volatility #RiskManagement
Why does market volatility matter?
Volatility creates opportunities, but it also increases risk.
Fast price movements can trigger stop-losses and liquidations.
Never choose leverage just because the market is moving fast.
#CryptoTrading #volatility #RiskManagement
1
36

·
--
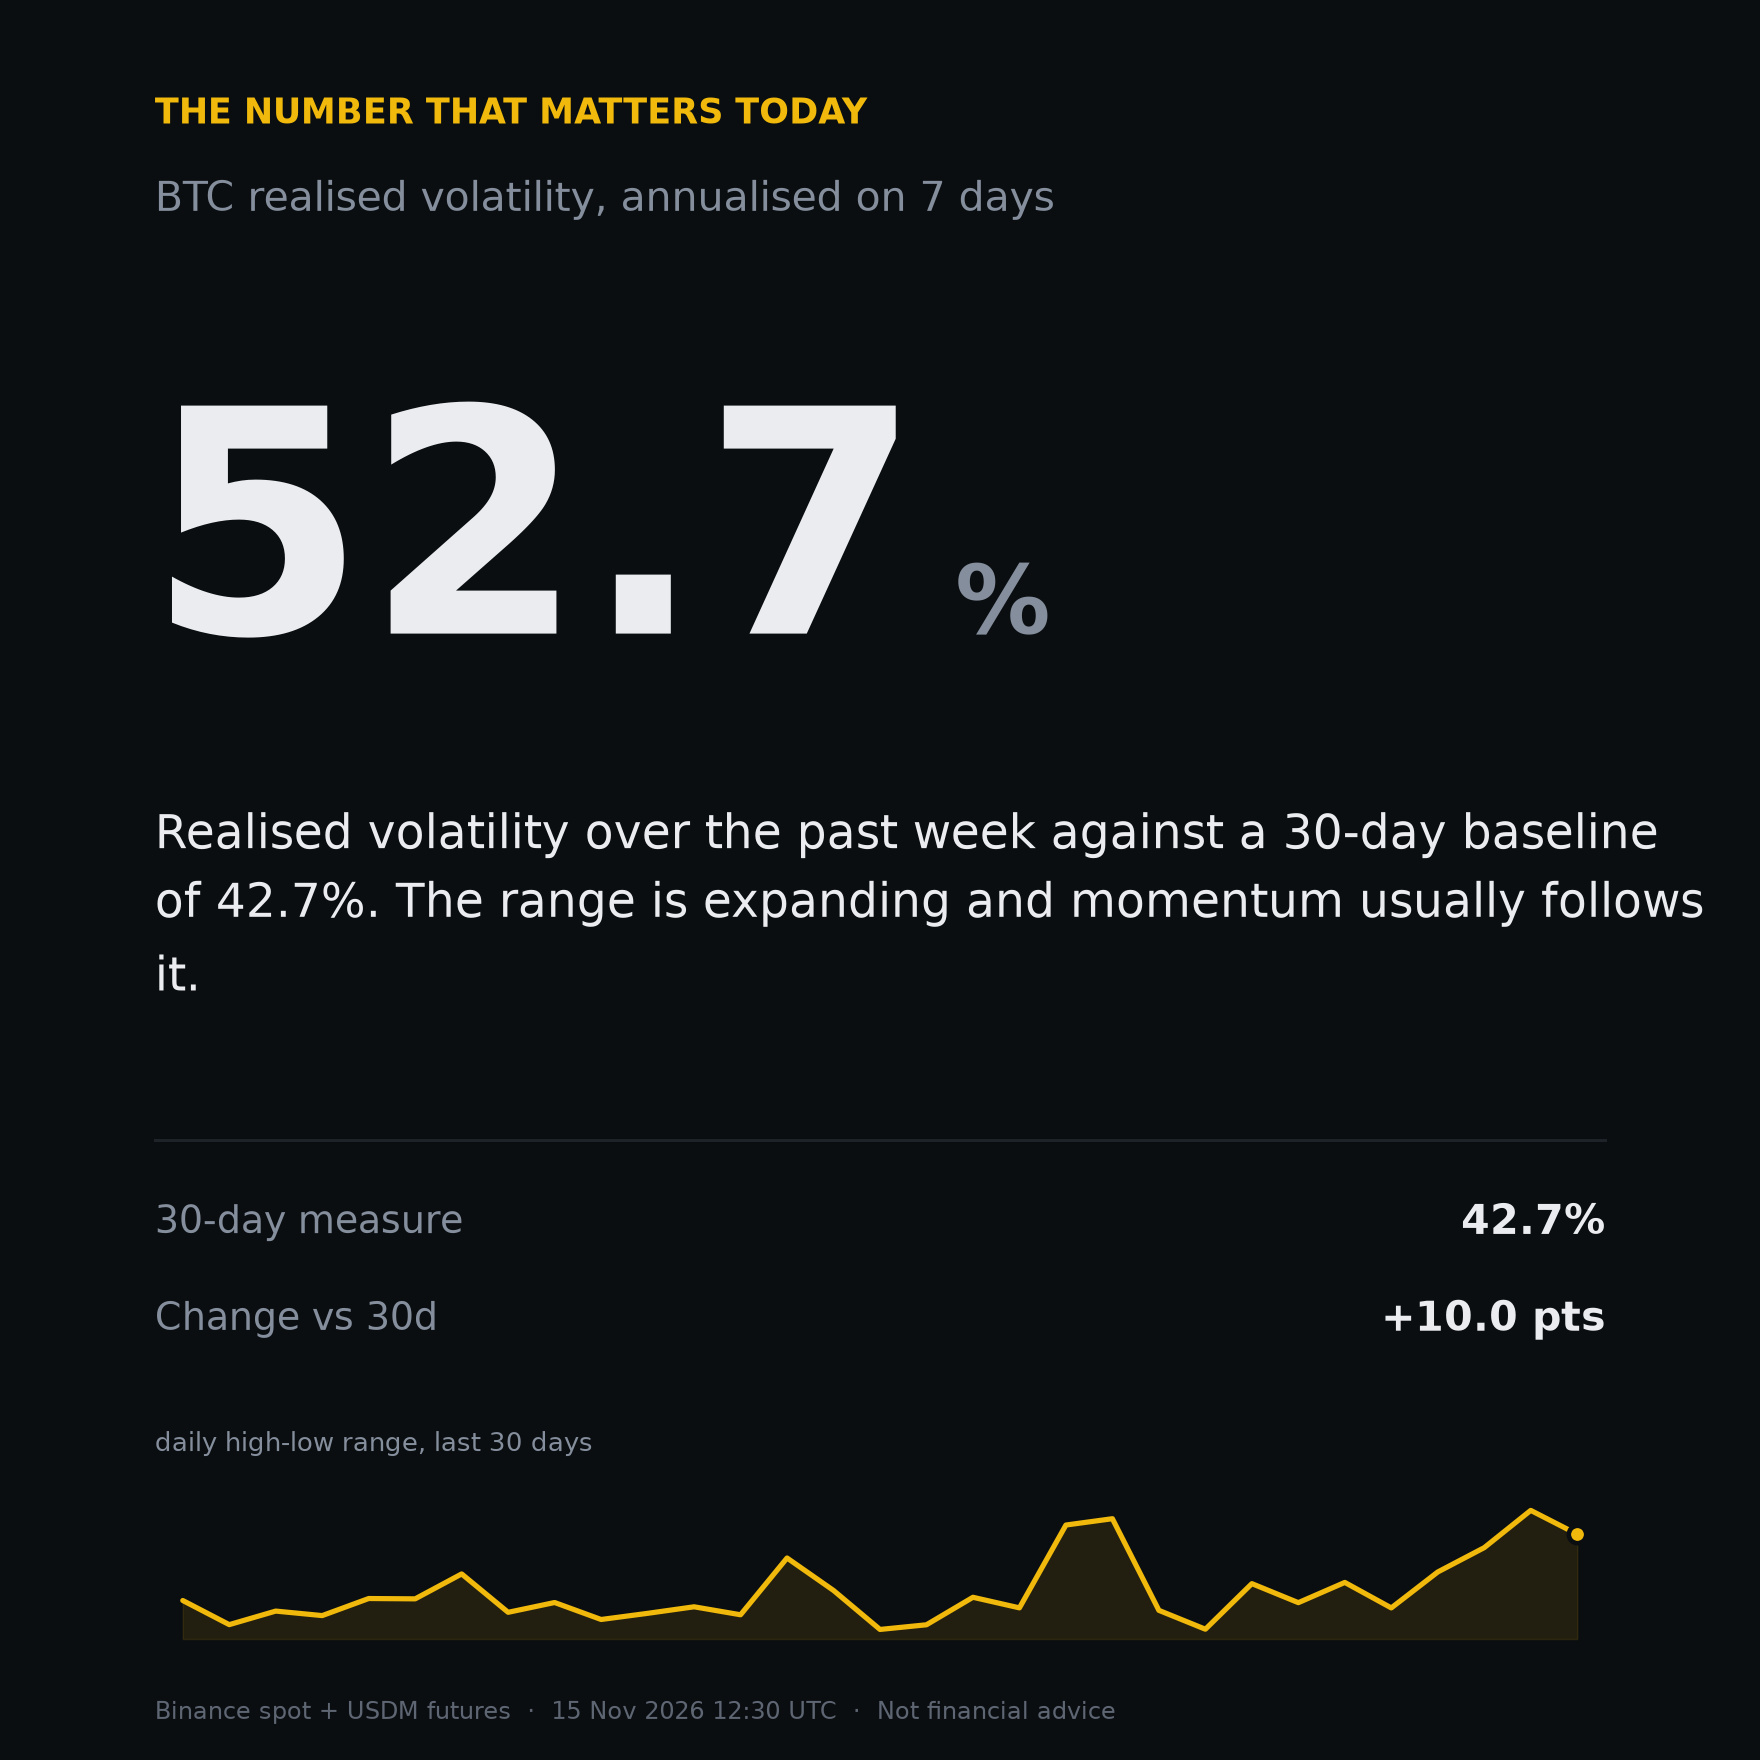
Realized volatility is 52.7 percent, ten points above its own thirty day baseline.
That figure is annualized realized volatility over the past seven days. The same measure over thirty days is 42.7 percent. A gap of roughly 10 points between the short window and the long window is what an expanding volatility regime looks like in numbers. The tape is not only moving, it is moving more than its own recent habit taught everyone to expect.
The implication is mechanical. Stops that were sized for a 42 percent tape now sit inside ordinary noise. Position sizes that felt fine a month ago carry more risk per hour today, not because conditions got worse, but because the distribution got wider. Expanding vol also flattens the payoff of tight range strategies and rewards patience over precision.
What it does not imply is direction. Volatility expansion describes the size of moves, never the sign of them. A 52.7 percent reading can resolve up, down, or sideways with a wider chop. Reading this number as bearish is the most common mistake made with it.
One thing to watch next: whether the seven day reading stays above the thirty day reading for another few sessions. That persistence, more than the level itself, is what separates a regime change from a two day noise spike.
$BTC $ETH $SOL
When you size a position this week, are you using the thirty day number or the seven day one?
#Bitcoin #Volatility #CryptoMarkets #RiskManagement
Realized volatility is 52.7 percent, ten points above its own thirty day baseline.
That figure is annualized realized volatility over the past seven days. The same measure over thirty days is 42.7 percent. A gap of roughly 10 points between the short window and the long window is what an expanding volatility regime looks like in numbers. The tape is not only moving, it is moving more than its own recent habit taught everyone to expect.
The implication is mechanical. Stops that were sized for a 42 percent tape now sit inside ordinary noise. Position sizes that felt fine a month ago carry more risk per hour today, not because conditions got worse, but because the distribution got wider. Expanding vol also flattens the payoff of tight range strategies and rewards patience over precision.
What it does not imply is direction. Volatility expansion describes the size of moves, never the sign of them. A 52.7 percent reading can resolve up, down, or sideways with a wider chop. Reading this number as bearish is the most common mistake made with it.
One thing to watch next: whether the seven day reading stays above the thirty day reading for another few sessions. That persistence, more than the level itself, is what separates a regime change from a two day noise spike.
$BTC $ETH $SOL
When you size a position this week, are you using the thirty day number or the seven day one?
#Bitcoin #Volatility #CryptoMarkets #RiskManagement
That figure is annualized realized volatility over the past seven days. The same measure over thirty days is 42.7 percent. A gap of roughly 10 points between the short window and the long window is what an expanding volatility regime looks like in numbers. The tape is not only moving, it is moving more than its own recent habit taught everyone to expect.
The implication is mechanical. Stops that were sized for a 42 percent tape now sit inside ordinary noise. Position sizes that felt fine a month ago carry more risk per hour today, not because conditions got worse, but because the distribution got wider. Expanding vol also flattens the payoff of tight range strategies and rewards patience over precision.
What it does not imply is direction. Volatility expansion describes the size of moves, never the sign of them. A 52.7 percent reading can resolve up, down, or sideways with a wider chop. Reading this number as bearish is the most common mistake made with it.
One thing to watch next: whether the seven day reading stays above the thirty day reading for another few sessions. That persistence, more than the level itself, is what separates a regime change from a two day noise spike.
$BTC $ETH $SOL
When you size a position this week, are you using the thirty day number or the seven day one?
#Bitcoin #Volatility #CryptoMarkets #RiskManagement
135
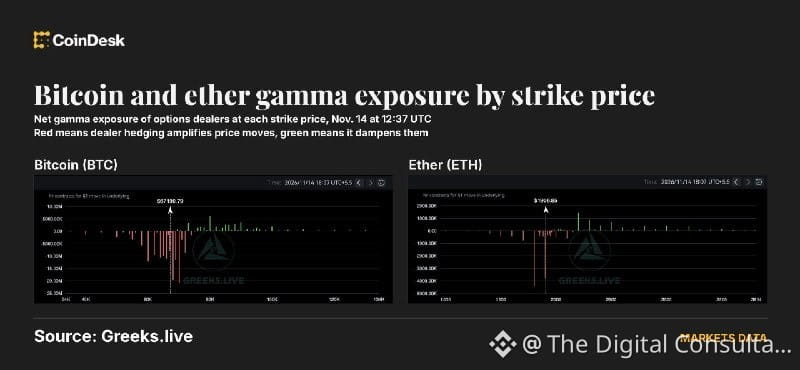
يُفترض أن تهدئ السيولة تحركات الأسعار، لكن نطاقات BTC وETH الحالية قد تجعل صناع السوق يضخّمون التقلب. $BTC
الملاحظة الأساسية أن العملتين تتداولان داخل نطاقات سعرية قد تدفع المتداولين وصناع السوق إلى زيادة التقلب بدل تهدئته.
ما يعنيك: إذا استمر السعر قريباً من حدود النطاق، فقد تتسع الحركة بسرعة في الاتجاهين. راقب اختراق النطاق أو كسره، فهو ما يحدد إن كان التقلب سيكبر.
الخلاصة القابلة للحفظ: السيولة وحدها لا تكفي للحكم على الهدوء، فموقع السعر داخل النطاق هو الأهم.
هل تتوقع أن يتسع نطاق BTC وETH هذا الأسبوع؟
#BTC #Volatility
المحتوى للمعلومات فقط وليس نصيحة مالية.
اضغط $BTC للتداول
$BTC
غيرك سبقك وتابع. ادخل بروفايلي وخلك مع اللي يقرأ قبل ما ينتشر الخبر.
يُفترض أن تهدئ السيولة تحركات الأسعار، لكن نطاقات BTC وETH الحالية قد تجعل صناع السوق يضخّمون التقلب. $BTC
الملاحظة الأساسية أن العملتين تتداولان داخل نطاقات سعرية قد تدفع المتداولين وصناع السوق إلى زيادة التقلب بدل تهدئته.
ما يعنيك: إذا استمر السعر قريباً من حدود النطاق، فقد تتسع الحركة بسرعة في الاتجاهين. راقب اختراق النطاق أو كسره، فهو ما يحدد إن كان التقلب سيكبر.
الخلاصة القابلة للحفظ: السيولة وحدها لا تكفي للحكم على الهدوء، فموقع السعر داخل النطاق هو الأهم.
هل تتوقع أن يتسع نطاق BTC وETH هذا الأسبوع؟
#BTC #Volatility
المحتوى للمعلومات فقط وليس نصيحة مالية.
اضغط $BTC للتداول
$BTC
غيرك سبقك وتابع. ادخل بروفايلي وخلك مع اللي يقرأ قبل ما ينتشر الخبر.
الملاحظة الأساسية أن العملتين تتداولان داخل نطاقات سعرية قد تدفع المتداولين وصناع السوق إلى زيادة التقلب بدل تهدئته.
ما يعنيك: إذا استمر السعر قريباً من حدود النطاق، فقد تتسع الحركة بسرعة في الاتجاهين. راقب اختراق النطاق أو كسره، فهو ما يحدد إن كان التقلب سيكبر.
الخلاصة القابلة للحفظ: السيولة وحدها لا تكفي للحكم على الهدوء، فموقع السعر داخل النطاق هو الأهم.
هل تتوقع أن يتسع نطاق BTC وETH هذا الأسبوع؟
#BTC #Volatility
المحتوى للمعلومات فقط وليس نصيحة مالية.
اضغط $BTC للتداول
$BTC
غيرك سبقك وتابع. ادخل بروفايلي وخلك مع اللي يقرأ قبل ما ينتشر الخبر.
84
Войдите, чтобы посмотреть больше материала
Присоединяйтесь к пользователям криптовалют по всему миру на Binance Square
⚡️ Получайте новейшую и полезную информацию о криптоактивах.
💬 Нам доверяет крупнейшая в мире криптобиржа.
👍 Получите достоверные аналитические данные от верифицированных создателей контента.
Эл. почта/номер телефона
В тренде
1
#AnthropicToDebutAfter$83IPOPricing
Просмотров: 15,333
124 обсуждают
2
#BTCRemainsUnderPressureAfterHawkishFOMCMinutes
Просмотров: 57,463
1,057 обсуждают
3
#NvidiaBoardReportedlySplitOverHuang’sReturn
Просмотров: 19,065
504 обсуждают
4
#CanGTA6'sLaunchLiftTTWOShares?
Просмотров: 10,661
394 обсуждают
5
#CapitalGroupAdds1264500StrategyShares
Просмотров: 0
48 обсуждают
6
#FOMCMinutesHighlightAIDebtRisks
Просмотров: 19,609
423 обсуждают
7
#AntInternationalLaunchesWhaleProtocol
Просмотров: 0
2 обсуждают
8
#SouthKoreaPlansToLet3500ListedFirmsBuyBitcoin
Просмотров: 19,559
426 обсуждают
9
#AnthropicGrayMarketSharesPointTo22%To26%Gains
Просмотров: 4,729
127 обсуждают
10
#BitcoinSpotETFsSee$306MNetOutflows
Просмотров: 155
10 обсуждают