
#rendernetwork
rendernetwork
Просмотров: 672,127
865 обсуждают
Популярные
Новые

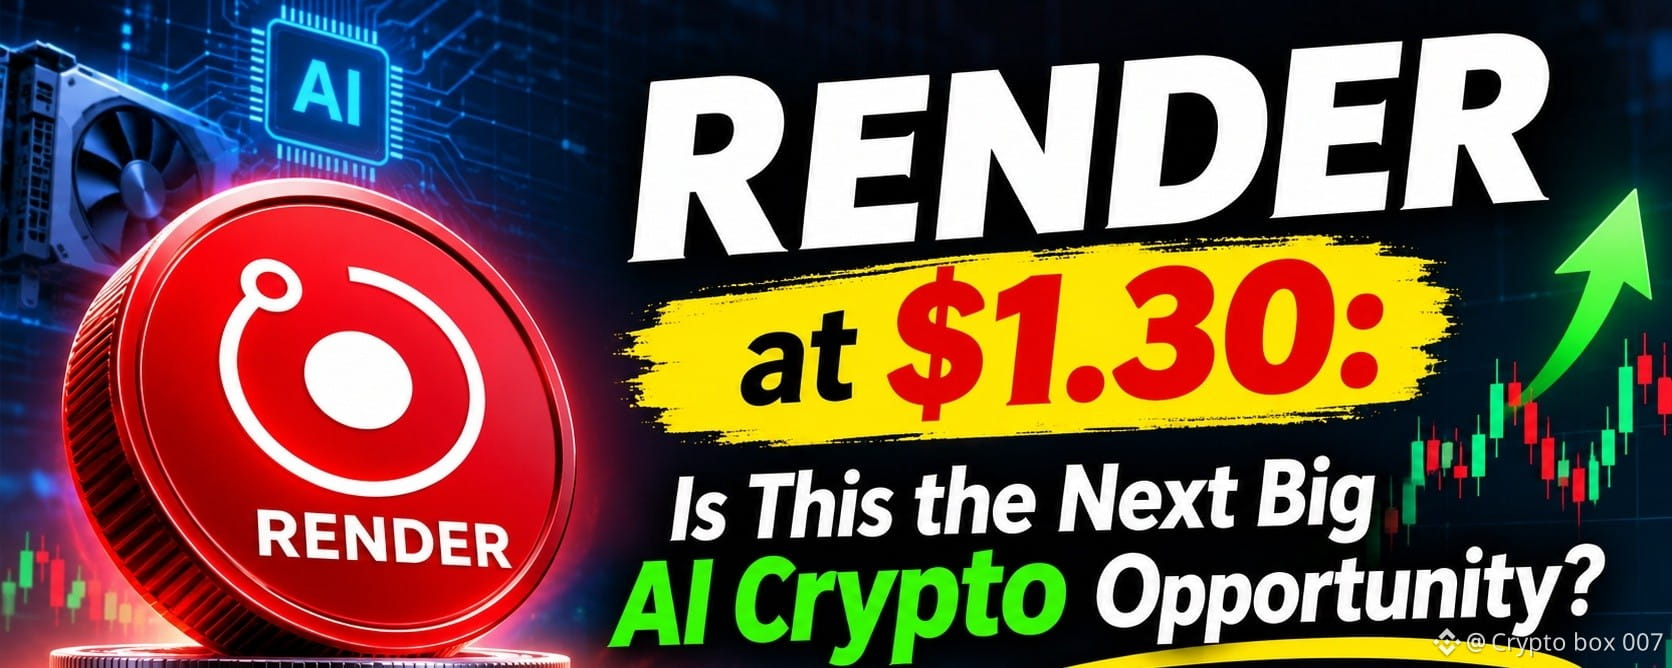
Статья
The AI and DePIN Gem That Deserves Your Attention: RENDERRENDER at $1.30: Is This a Hidden Opportunity in the AI and DePIN Sector?
Render (RENDER) is currently trading around $1.30, following a significant decline from its previous highs. While the broader chart still reflects a long-term bearish trend, the current price zone deserves attention from investors looking for potential opportunities in the AI and decentralized computing sectors.
Could RENDER be preparing for a long-term recovery?
Let's take a closer look.
1. What Makes Render Network Interesting?
Render Network is a decentralized GPU computing network that connects GPU providers with users who need computing power.
Its applications include:
AI and machine learning workloads
3D rendering and animation
Digital content creation
GPU-intensive computing
As demand for AI infrastructure and GPU computing continues to attract attention, decentralized computing networks could become an interesting part of this growing industry.
Render is not simply another speculative AI token. It has an actual network designed to facilitate GPU computing services.
2. Tokenomics: Burn and Mint Equilibrium
One of Render's interesting features is its Burn and Mint Equilibrium (BME) model.
Under this model:
Users burn RENDER tokens to pay for network services.
New tokens are issued as rewards for network participants.
The balance between network usage, token burning and emissions plays an important role in the token's economics.
This means that increasing network activity could potentially create more demand for RENDER.
However, actual token value will depend on whether network demand grows enough relative to new token emissions.
3. Technical Analysis: Is RENDER Near a Bottom?
At the time of the chart shared, RENDER was trading around $1.303.
The weekly chart shows a prolonged decline from the $10–$11 region, followed by an extended consolidation around the $1–$2 range.
Important price levels to watch:
Support Zones
$1.15–$1.20: Immediate support
$1.00–$1.10: Major support zone
Resistance Zones
$1.40–$1.50: First resistance
$1.80–$2.00: Major resistance
$2.40–$2.60: Next potential resistance
A weekly close above $1.50, followed by a successful move above $1.80–$2.00, could strengthen the bullish recovery scenario.
On the other hand, losing the $1.15 support area could expose the price to further downside.
These are technical observation zones, not guaranteed price levels.
4. Why Investors Are Watching RENDER
There are several reasons why RENDER deserves attention:
Exposure to the decentralized GPU computing sector.
Potential applications in AI, 3D rendering and digital production.
A token-burning mechanism linked to network usage.
An established network with measurable activity.
Potential to benefit if demand for decentralized computing expands.
Nevertheless, strong technology does not automatically translate into higher token prices. Adoption, competition, token emissions and broader market conditions remain important factors.
5. My Strategy at the Current Price
At approximately $1.30, I believe RENDER deserves attention, but I would avoid investing the entire amount at once.
A gradual accumulation strategy may offer better risk management for long-term investors.
I would closely monitor:
The $1.15–$1.20 support zone.
A possible breakout above $1.50.
Increasing trading volume.
Higher highs and higher lows on the weekly chart.
Confirmation is more important than trying to catch the exact bottom.
Final Thoughts
RENDER combines two interesting narratives: AI infrastructure and decentralized physical infrastructure (DePIN).
Its long-term potential depends on real network adoption and growing demand for GPU computing.
At around $1.30, it may be worth keeping on the watchlist. However, the weekly trend has not yet confirmed a bullish reversal.
The opportunity could be interesting, but patience and risk management are essential.
What do you think?
Is RENDER preparing for a major recovery, or could there be another leg down before the next bull market?
#render r #RenderNetwork #altcoins #DePIN #Crypto #Altcoins
The AI and DePIN Gem That Deserves Your Attention: RENDER
RENDER at $1.30: Is This a Hidden Opportunity in the AI and DePIN Sector?
Render (RENDER) is currently trading around $1.30, following a significant decline from its previous highs. While the broader chart still reflects a long-term bearish trend, the current price zone deserves attention from investors looking for potential opportunities in the AI and decentralized computing sectors.
Could RENDER be preparing for a long-term recovery?
Let's take a closer look.
1. What Makes Render Network Interesting?
Render Network is a decentralized GPU computing network that connects GPU providers with users who need computing power.
Its applications include:
AI and machine learning workloads
3D rendering and animation
Digital content creation
GPU-intensive computing
As demand for AI infrastructure and GPU computing continues to attract attention, decentralized computing networks could become an interesting part of this growing industry.
Render is not simply another speculative AI token. It has an actual network designed to facilitate GPU computing services.
2. Tokenomics: Burn and Mint Equilibrium
One of Render's interesting features is its Burn and Mint Equilibrium (BME) model.
Under this model:
Users burn RENDER tokens to pay for network services.
New tokens are issued as rewards for network participants.
The balance between network usage, token burning and emissions plays an important role in the token's economics.
This means that increasing network activity could potentially create more demand for RENDER.
However, actual token value will depend on whether network demand grows enough relative to new token emissions.
3. Technical Analysis: Is RENDER Near a Bottom?
At the time of the chart shared, RENDER was trading around $1.303.
The weekly chart shows a prolonged decline from the $10–$11 region, followed by an extended consolidation around the $1–$2 range.
Important price levels to watch:
Support Zones
$1.15–$1.20: Immediate support
$1.00–$1.10: Major support zone
Resistance Zones
$1.40–$1.50: First resistance
$1.80–$2.00: Major resistance
$2.40–$2.60: Next potential resistance
A weekly close above $1.50, followed by a successful move above $1.80–$2.00, could strengthen the bullish recovery scenario.
On the other hand, losing the $1.15 support area could expose the price to further downside.
These are technical observation zones, not guaranteed price levels.
4. Why Investors Are Watching RENDER
There are several reasons why RENDER deserves attention:
Exposure to the decentralized GPU computing sector.
Potential applications in AI, 3D rendering and digital production.
A token-burning mechanism linked to network usage.
An established network with measurable activity.
Potential to benefit if demand for decentralized computing expands.
Nevertheless, strong technology does not automatically translate into higher token prices. Adoption, competition, token emissions and broader market conditions remain important factors.
5. My Strategy at the Current Price
At approximately $1.30, I believe RENDER deserves attention, but I would avoid investing the entire amount at once.
A gradual accumulation strategy may offer better risk management for long-term investors.
I would closely monitor:
The $1.15–$1.20 support zone.
A possible breakout above $1.50.
Increasing trading volume.
Higher highs and higher lows on the weekly chart.
Confirmation is more important than trying to catch the exact bottom.
Final Thoughts
RENDER combines two interesting narratives: AI infrastructure and decentralized physical infrastructure (DePIN).
Its long-term potential depends on real network adoption and growing demand for GPU computing.
At around $1.30, it may be worth keeping on the watchlist. However, the weekly trend has not yet confirmed a bullish reversal.
The opportunity could be interesting, but patience and risk management are essential.
What do you think?
Is RENDER preparing for a major recovery, or could there be another leg down before the next bull market?
#render r #RenderNetwork #altcoins #DePIN #Crypto #Altcoins
Render (RENDER) is currently trading around $1.30, following a significant decline from its previous highs. While the broader chart still reflects a long-term bearish trend, the current price zone deserves attention from investors looking for potential opportunities in the AI and decentralized computing sectors.
Could RENDER be preparing for a long-term recovery?
Let's take a closer look.
1. What Makes Render Network Interesting?
Render Network is a decentralized GPU computing network that connects GPU providers with users who need computing power.
Its applications include:
AI and machine learning workloads
3D rendering and animation
Digital content creation
GPU-intensive computing
As demand for AI infrastructure and GPU computing continues to attract attention, decentralized computing networks could become an interesting part of this growing industry.
Render is not simply another speculative AI token. It has an actual network designed to facilitate GPU computing services.
2. Tokenomics: Burn and Mint Equilibrium
One of Render's interesting features is its Burn and Mint Equilibrium (BME) model.
Under this model:
Users burn RENDER tokens to pay for network services.
New tokens are issued as rewards for network participants.
The balance between network usage, token burning and emissions plays an important role in the token's economics.
This means that increasing network activity could potentially create more demand for RENDER.
However, actual token value will depend on whether network demand grows enough relative to new token emissions.
3. Technical Analysis: Is RENDER Near a Bottom?
At the time of the chart shared, RENDER was trading around $1.303.
The weekly chart shows a prolonged decline from the $10–$11 region, followed by an extended consolidation around the $1–$2 range.
Important price levels to watch:
Support Zones
$1.15–$1.20: Immediate support
$1.00–$1.10: Major support zone
Resistance Zones
$1.40–$1.50: First resistance
$1.80–$2.00: Major resistance
$2.40–$2.60: Next potential resistance
A weekly close above $1.50, followed by a successful move above $1.80–$2.00, could strengthen the bullish recovery scenario.
On the other hand, losing the $1.15 support area could expose the price to further downside.
These are technical observation zones, not guaranteed price levels.
4. Why Investors Are Watching RENDER
There are several reasons why RENDER deserves attention:
Exposure to the decentralized GPU computing sector.
Potential applications in AI, 3D rendering and digital production.
A token-burning mechanism linked to network usage.
An established network with measurable activity.
Potential to benefit if demand for decentralized computing expands.
Nevertheless, strong technology does not automatically translate into higher token prices. Adoption, competition, token emissions and broader market conditions remain important factors.
5. My Strategy at the Current Price
At approximately $1.30, I believe RENDER deserves attention, but I would avoid investing the entire amount at once.
A gradual accumulation strategy may offer better risk management for long-term investors.
I would closely monitor:
The $1.15–$1.20 support zone.
A possible breakout above $1.50.
Increasing trading volume.
Higher highs and higher lows on the weekly chart.
Confirmation is more important than trying to catch the exact bottom.
Final Thoughts
RENDER combines two interesting narratives: AI infrastructure and decentralized physical infrastructure (DePIN).
Its long-term potential depends on real network adoption and growing demand for GPU computing.
At around $1.30, it may be worth keeping on the watchlist. However, the weekly trend has not yet confirmed a bullish reversal.
The opportunity could be interesting, but patience and risk management are essential.
What do you think?
Is RENDER preparing for a major recovery, or could there be another leg down before the next bull market?
#render r #RenderNetwork #altcoins #DePIN #Crypto #Altcoins
2
330

🚨 What's Next for $RENDER
I get this question quite often,And i have already explained this in my Recent video,
Uploaded 2 days ago, so let's break it down.
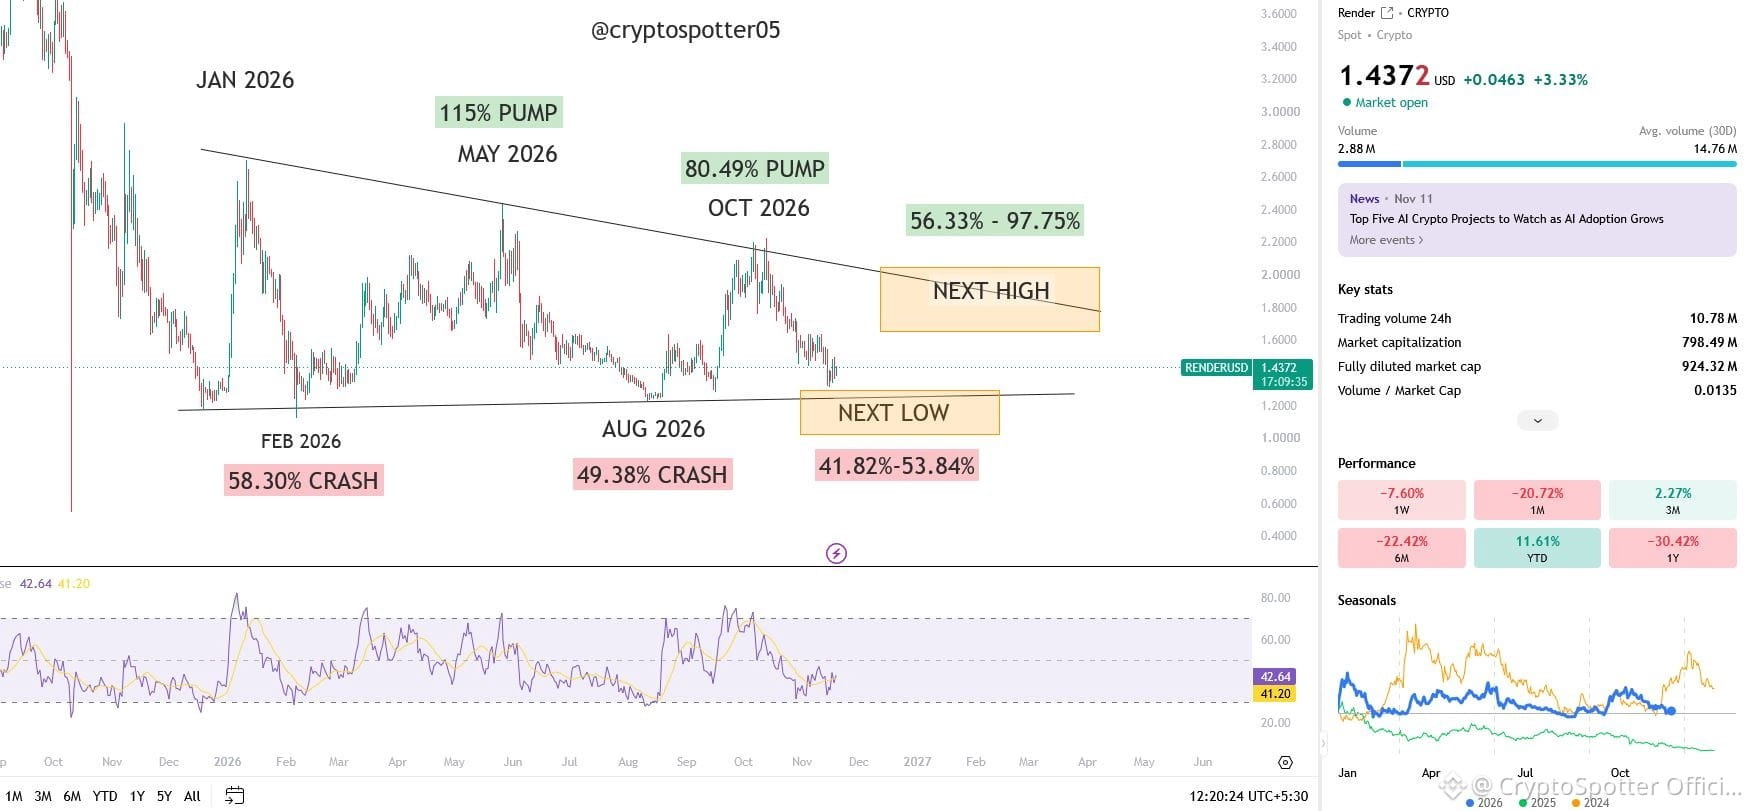
The chart shared below is based on my Percentage-Based Model, using price movements from 2026.
Let's look at the numbers:
Our first low came with a 58.30% drawdown, followed by a second low at 49.38%.
Now, applying the drawdown and average method, our projected next low comes in around 41.82%–53.84%.
This is our expected downside zone.
Once this area is tapped, I am expecting a gradual recovery towards the upside.
Based on the same drawdown and average methodology, the next upside wave is estimated to be around 56.33%–97.75%.
But here's the catch:
I expect $RENDER to remain bearish until the end of 2026.
My expectation is that we could start seeing gradual growth from Q1 2027 onwards.
Let's see how this model plays out. 🎯
Disclaimer: This is not financial advice. All charts and analysis I share are for educational purposes only.
#RENDER #RenderNetwork
🚨 What's Next for $RENDER
I get this question quite often,And i have already explained this in my Recent video,
Uploaded 2 days ago, so let's break it down.
The chart shared below is based on my Percentage-Based Model, using price movements from 2026.
Let's look at the numbers:
Our first low came with a 58.30% drawdown, followed by a second low at 49.38%.
Now, applying the drawdown and average method, our projected next low comes in around 41.82%–53.84%.
This is our expected downside zone.
Once this area is tapped, I am expecting a gradual recovery towards the upside.
Based on the same drawdown and average methodology, the next upside wave is estimated to be around 56.33%–97.75%.
But here's the catch:
I expect $RENDER to remain bearish until the end of 2026.
My expectation is that we could start seeing gradual growth from Q1 2027 onwards.
Let's see how this model plays out. 🎯
Disclaimer: This is not financial advice. All charts and analysis I share are for educational purposes only.
#RENDER #RenderNetwork
I get this question quite often,And i have already explained this in my Recent video,
Uploaded 2 days ago, so let's break it down.
The chart shared below is based on my Percentage-Based Model, using price movements from 2026.
Let's look at the numbers:
Our first low came with a 58.30% drawdown, followed by a second low at 49.38%.
Now, applying the drawdown and average method, our projected next low comes in around 41.82%–53.84%.
This is our expected downside zone.
Once this area is tapped, I am expecting a gradual recovery towards the upside.
Based on the same drawdown and average methodology, the next upside wave is estimated to be around 56.33%–97.75%.
But here's the catch:
I expect $RENDER to remain bearish until the end of 2026.
My expectation is that we could start seeing gradual growth from Q1 2027 onwards.
Let's see how this model plays out. 🎯
Disclaimer: This is not financial advice. All charts and analysis I share are for educational purposes only.
#RENDER #RenderNetwork
1
1
4.4k

🚨 WHAT'S NEXT FOR $RENDER? BEARISH NOW, RECOVERY LATER? 👀
Let's take a closer look at the possible next move for $RENDER using a percentage-based market model.
📉 Downside Outlook:
Previous corrections recorded drawdowns of 58.30% and 49.38%. Based on this model, the next potential downside zone is estimated at 41.82%–53.84%.
📈 Recovery Potential:
After this correction phase, a gradual recovery could bring a potential upside move of 56.33%–97.75%.
🔍 My Outlook:
$RENDER could remain under bearish pressure through the end of 2026, while Q1 2027 may bring opportunities for gradual recovery.
Will this projection play out? Time will tell! 🎯
Not financial advice. This is a technical model, not a guaranteed prediction.
{spot}(RENDERUSDT)
#RENDER #RenderNetwork #CryptoAnalysis #BinanceSquare
🚨 WHAT'S NEXT FOR $RENDER ? BEARISH NOW, RECOVERY LATER? 👀
Let's take a closer look at the possible next move for $RENDER using a percentage-based market model.
📉 Downside Outlook:
Previous corrections recorded drawdowns of 58.30% and 49.38%. Based on this model, the next potential downside zone is estimated at 41.82%–53.84%.
📈 Recovery Potential:
After this correction phase, a gradual recovery could bring a potential upside move of 56.33%–97.75%.
🔍 My Outlook:
$RENDER could remain under bearish pressure through the end of 2026, while Q1 2027 may bring opportunities for gradual recovery.
Will this projection play out? Time will tell! 🎯
Not financial advice. This is a technical model, not a guaranteed prediction.
#RENDER #RenderNetwork #CryptoAnalysis #BinanceSquare
Let's take a closer look at the possible next move for $RENDER using a percentage-based market model.
📉 Downside Outlook:
Previous corrections recorded drawdowns of 58.30% and 49.38%. Based on this model, the next potential downside zone is estimated at 41.82%–53.84%.
📈 Recovery Potential:
After this correction phase, a gradual recovery could bring a potential upside move of 56.33%–97.75%.
🔍 My Outlook:
$RENDER could remain under bearish pressure through the end of 2026, while Q1 2027 may bring opportunities for gradual recovery.
Will this projection play out? Time will tell! 🎯
Not financial advice. This is a technical model, not a guaranteed prediction.
#RENDER #RenderNetwork #CryptoAnalysis #BinanceSquare
214

·
--
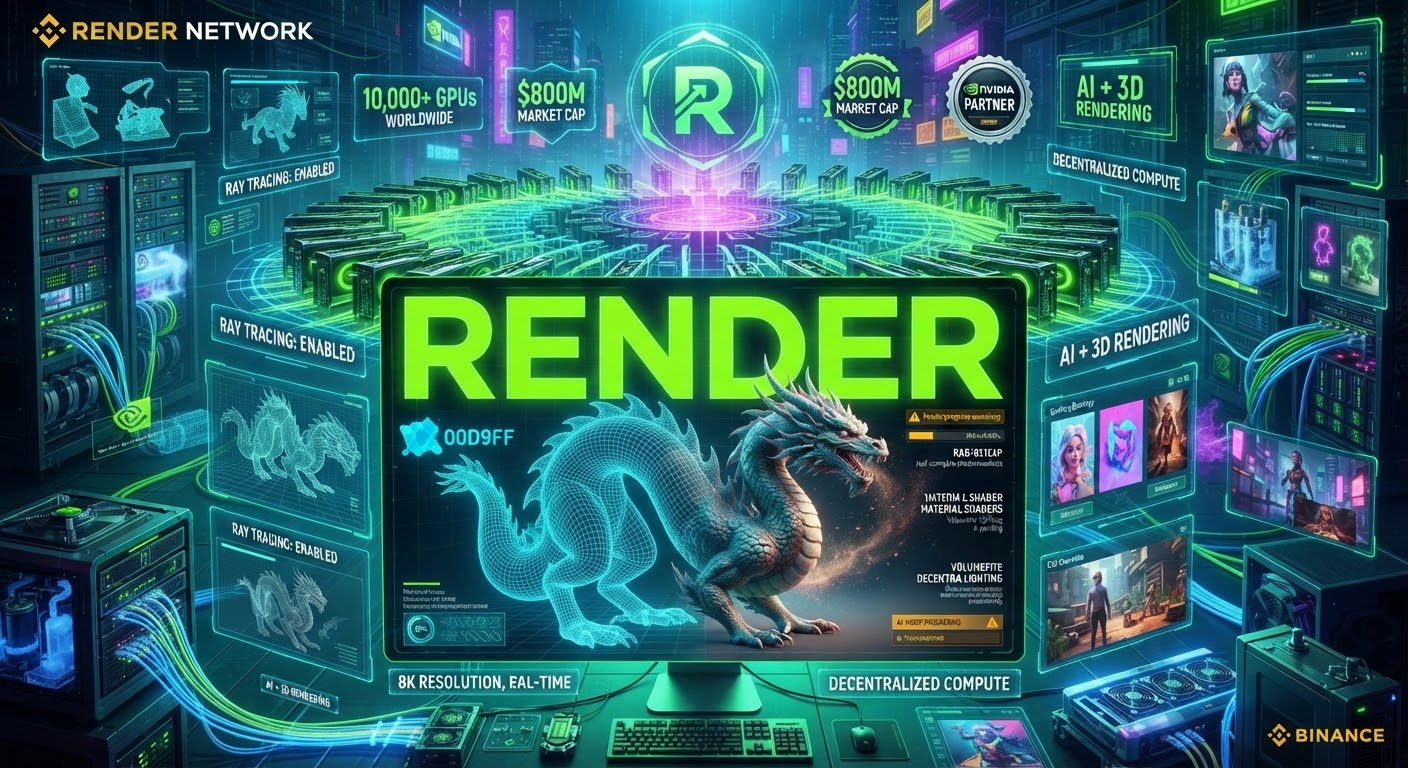
🎮 RENDER: ¿EL NVIDIA DESCENTRALIZADO?
{future}(RENDERUSDT)
DATOS VERIFICABLES:
✅ Precio: $1.40 (+3.72%)
✅ Market cap: $771M
✅ Fundador habló en NVIDIA GTC
✅ GPU descentralizado para AI/3D
✅ Ranking #60
LA PREGUNTA:
Si NVIDIA vale $3 TRILLONES...
¿Cuánto vale RENDER con solo $771M?
SETUP:
🎯 Entrada: $1.35-$1.45
🛑 Stop: $1.15 (-18%)
🎯 Target: $3.00 (+115%)
#RenderNetwork #CTRARK
🎮 RENDER: ¿EL NVIDIA DESCENTRALIZADO?
DATOS VERIFICABLES:
✅ Precio: $1.40 (+3.72%)
✅ Market cap: $771M
✅ Fundador habló en NVIDIA GTC
✅ GPU descentralizado para AI/3D
✅ Ranking #60
LA PREGUNTA:
Si NVIDIA vale $3 TRILLONES...
¿Cuánto vale RENDER con solo $771M?
SETUP:
🎯 Entrada: $1.35-$1.45
🛑 Stop: $1.15 (-18%)
🎯 Target: $3.00 (+115%)
#RenderNetwork #CTRARK
DATOS VERIFICABLES:
✅ Precio: $1.40 (+3.72%)
✅ Market cap: $771M
✅ Fundador habló en NVIDIA GTC
✅ GPU descentralizado para AI/3D
✅ Ranking #60
LA PREGUNTA:
Si NVIDIA vale $3 TRILLONES...
¿Cuánto vale RENDER con solo $771M?
SETUP:
🎯 Entrada: $1.35-$1.45
🛑 Stop: $1.15 (-18%)
🎯 Target: $3.00 (+115%)
#RenderNetwork #CTRARK
1
304

·
--
$RENDER : AI Infrastructure Is Growing, But Can the Token Break Its Next Resistance?
Render is becoming an interesting project to watch as demand for decentralized GPU computing and AI infrastructure continues to develop.
The token has recovered from $1.440 to $1.642, with the latest chart snapshot showing RENDER near $1.617, up 4.59%.
But there's something important here: the price is consolidating near its recent high instead of accelerating higher.
Here's what the chart is telling us:
On the 15-minute timeframe, MA7, MA14 and MA28 are clustered around $1.607–$1.611. This shows a tight trading range where buyers and sellers are competing for control.
Volume is also cooling, with 1.26K compared with the MA5 average of 2.77K. A stronger volume expansion would make the next breakout attempt more convincing.
Key levels to watch:
- $1.642 – Immediate breakout resistance.
- $1.700 – Next potential upside target.
- $1.611–$1.591 – Short-term support zone.
- $1.541 – Important downside support.
- $1.490 – Secondary support.
- $1.440 – Major recovery base.
The bigger picture is even more interesting.
Render Network reported processing over 82.5 million frames by September 2026, while August output reportedly increased 23% month over month to 1.33 million frames.
Its RNP-024 proposal also introduces Forth, a privacy-focused AI gateway designed to connect demand across AI models and computing infrastructure. However, it's still a draft proposal, not an implemented catalyst.
My Binance Market Take:
RENDER has a cautiously bullish short-term structure, but I want to see a convincing break above $1.642 with stronger volume before considering the next leg higher.
A rejection could bring another test of the $1.591–$1.541 support region.
The real opportunity to watch is whether Render can convert increasing AI and GPU demand into sustainable network usage and token utility.
Is RENDER preparing for another breakout, or does it need more time to build momentum?
$RENDER
{spot}(RENDERUSDT)
#RenderNetwork #AI #DePIN #Binance
$RENDER : AI Infrastructure Is Growing, But Can the Token Break Its Next Resistance?
Render is becoming an interesting project to watch as demand for decentralized GPU computing and AI infrastructure continues to develop.
The token has recovered from $1.440 to $1.642, with the latest chart snapshot showing RENDER near $1.617, up 4.59%.
But there's something important here: the price is consolidating near its recent high instead of accelerating higher.
Here's what the chart is telling us:
On the 15-minute timeframe, MA7, MA14 and MA28 are clustered around $1.607–$1.611. This shows a tight trading range where buyers and sellers are competing for control.
Volume is also cooling, with 1.26K compared with the MA5 average of 2.77K. A stronger volume expansion would make the next breakout attempt more convincing.
Key levels to watch:
- $1.642 – Immediate breakout resistance.
- $1.700 – Next potential upside target.
- $1.611–$1.591 – Short-term support zone.
- $1.541 – Important downside support.
- $1.490 – Secondary support.
- $1.440 – Major recovery base.
The bigger picture is even more interesting.
Render Network reported processing over 82.5 million frames by September 2026, while August output reportedly increased 23% month over month to 1.33 million frames.
Its RNP-024 proposal also introduces Forth, a privacy-focused AI gateway designed to connect demand across AI models and computing infrastructure. However, it's still a draft proposal, not an implemented catalyst.
My Binance Market Take:
RENDER has a cautiously bullish short-term structure, but I want to see a convincing break above $1.642 with stronger volume before considering the next leg higher.
A rejection could bring another test of the $1.591–$1.541 support region.
The real opportunity to watch is whether Render can convert increasing AI and GPU demand into sustainable network usage and token utility.
Is RENDER preparing for another breakout, or does it need more time to build momentum?
$RENDER
#RenderNetwork #AI #DePIN #Binance
Render is becoming an interesting project to watch as demand for decentralized GPU computing and AI infrastructure continues to develop.
The token has recovered from $1.440 to $1.642, with the latest chart snapshot showing RENDER near $1.617, up 4.59%.
But there's something important here: the price is consolidating near its recent high instead of accelerating higher.
Here's what the chart is telling us:
On the 15-minute timeframe, MA7, MA14 and MA28 are clustered around $1.607–$1.611. This shows a tight trading range where buyers and sellers are competing for control.
Volume is also cooling, with 1.26K compared with the MA5 average of 2.77K. A stronger volume expansion would make the next breakout attempt more convincing.
Key levels to watch:
- $1.642 – Immediate breakout resistance.
- $1.700 – Next potential upside target.
- $1.611–$1.591 – Short-term support zone.
- $1.541 – Important downside support.
- $1.490 – Secondary support.
- $1.440 – Major recovery base.
The bigger picture is even more interesting.
Render Network reported processing over 82.5 million frames by September 2026, while August output reportedly increased 23% month over month to 1.33 million frames.
Its RNP-024 proposal also introduces Forth, a privacy-focused AI gateway designed to connect demand across AI models and computing infrastructure. However, it's still a draft proposal, not an implemented catalyst.
My Binance Market Take:
RENDER has a cautiously bullish short-term structure, but I want to see a convincing break above $1.642 with stronger volume before considering the next leg higher.
A rejection could bring another test of the $1.591–$1.541 support region.
The real opportunity to watch is whether Render can convert increasing AI and GPU demand into sustainable network usage and token utility.
Is RENDER preparing for another breakout, or does it need more time to build momentum?
$RENDER
#RenderNetwork #AI #DePIN #Binance
82

·
--
$RENDER
{future}(RENDERUSDT)
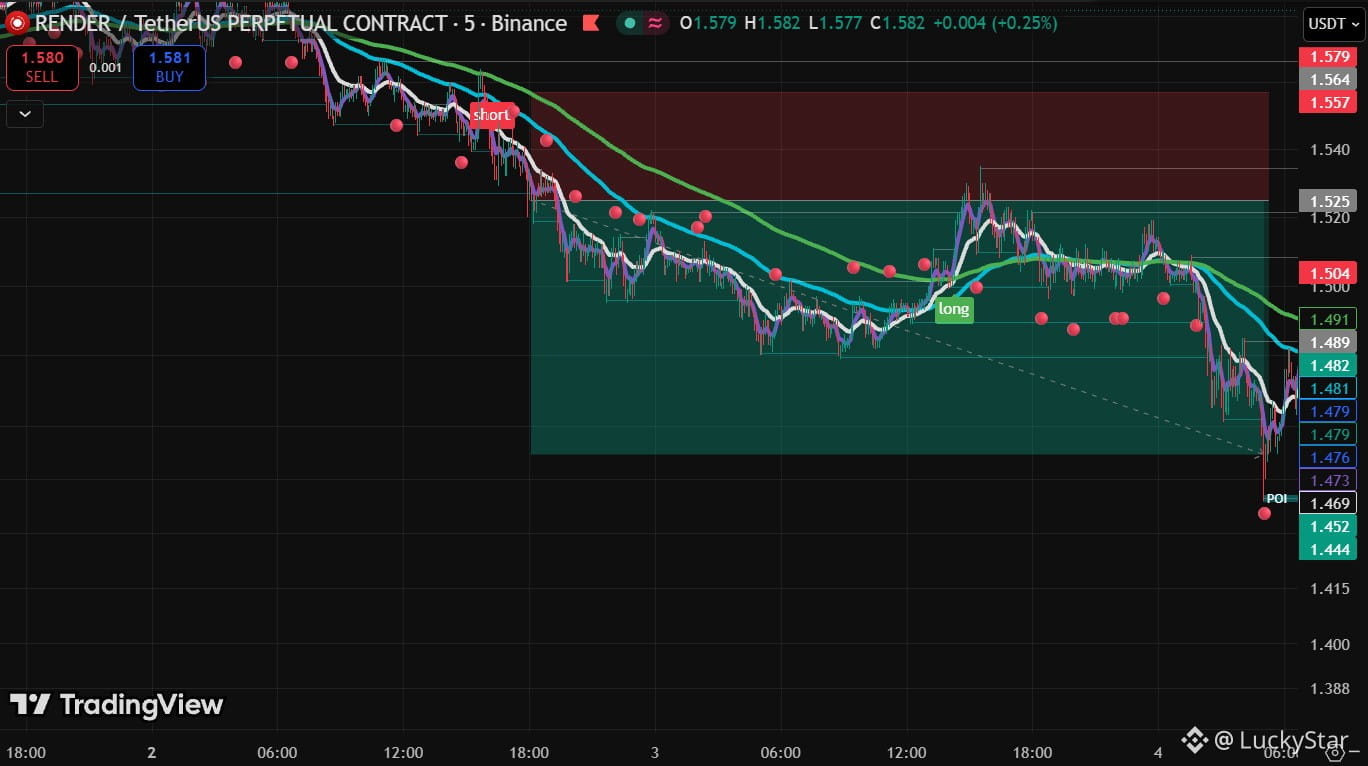
The signal was fully confirmed by a strong continuation of the move. The price easily reached the planned targets. Another profitable trade completed successfully.
#TradingTales #render #RenderNetwork
$RENDER
The signal was fully confirmed by a strong continuation of the move. The price easily reached the planned targets. Another profitable trade completed successfully.
#TradingTales #render #RenderNetwork
The signal was fully confirmed by a strong continuation of the move. The price easily reached the planned targets. Another profitable trade completed successfully.
#TradingTales #render #RenderNetwork
LuckyStar_
·
--
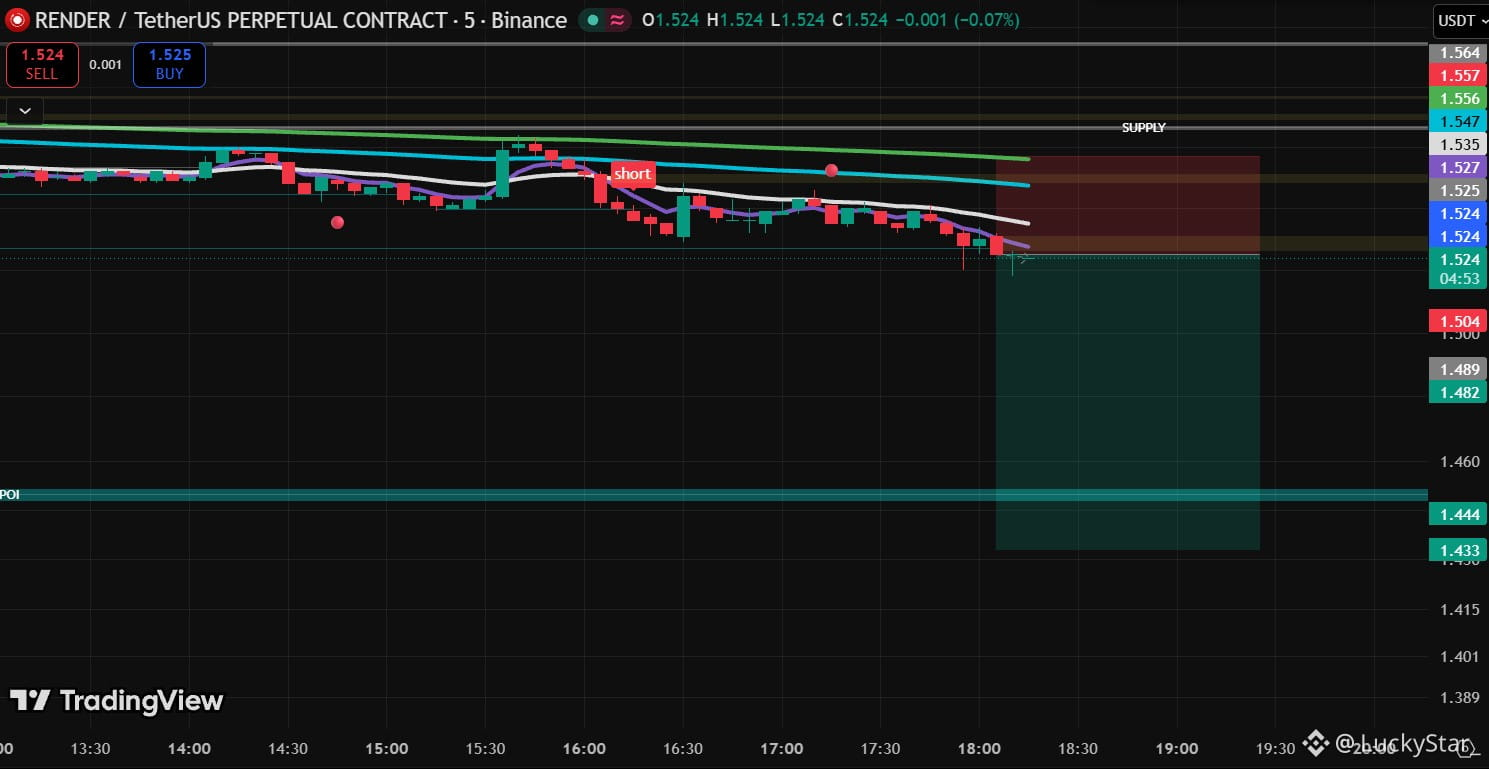
$RENDER
decline follows the break of the support level.
STAY TUNED!
Monitor risks closely and take profits in stages.
#render #RenderNetwork #ShortMaestro
decline follows the break of the support level.
STAY TUNED!
Monitor risks closely and take profits in stages.
#render #RenderNetwork #ShortMaestro
70
·
--
$RENDER
{future}(RENDERUSDT)
decline follows the break of the support level.
STAY TUNED!
Monitor risks closely and take profits in stages.
#render #RenderNetwork #ShortMaestro
$RENDER
decline follows the break of the support level.
STAY TUNED!
Monitor risks closely and take profits in stages.
#render #RenderNetwork #ShortMaestro
decline follows the break of the support level.
STAY TUNED!
Monitor risks closely and take profits in stages.
#render #RenderNetwork #ShortMaestro
1
36

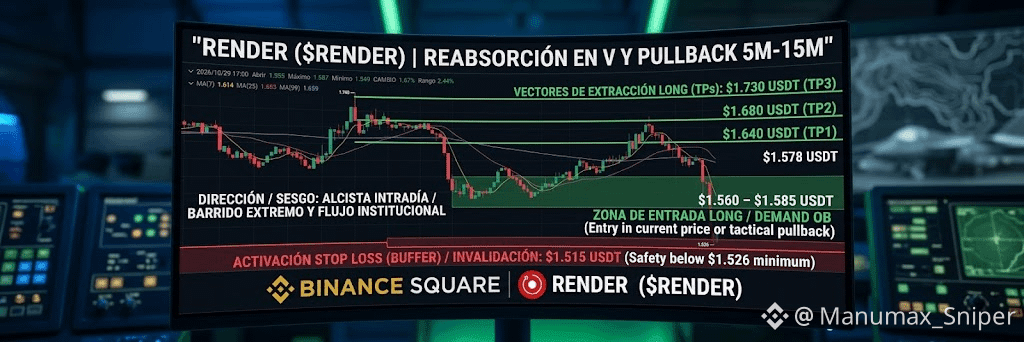
¡Pilas por aquí, ejército! Abran la pantalla conmigo un segundo porque Render nos acaba de regalar un escenario táctico fascinante de reacción rápida operando estrictamente bajo nuestra doctrina de 5M, 15M y 1H. El precio sufrió una caída vertical muy fuerte con un clímax de volumen masivo que barrió liquidez de forma profunda hasta los $1.526 USDT. Inmediatamente se activó una reabsorción agresiva por los compradores institucionales con una mecha de rechazo gigantesca y un cambio de carácter alcista. Ahora cotiza en los $1.578 - $1.580 USDT recuperando terreno rápidamente. La jugada va clara en Long.
Ojo con esto: nada de perseguir velas a lo loco tras un rebote en "V". Mantenemos el plan de combate y esperamos el retroceso táctico de enfriamiento hacia nuestra zona de entrada en los $1.560 - $1.585 USDT para cazar la mejor relación riesgo-beneficio.
El Stop Loss va blindado en los $1.515 USDT, colocado con un colchón estratégico por debajo del mínimo del barrido institucional para blindar la cuenta ante mechas falsas. Si el mercado nos invalida la entrada, pagamos el 1% de peaje con la mente fría y mantenemos el capital a salvo.
El plan de toma de beneficios va enfocado a la estructura rápida de sesión (ventana de 4 a 8 horas), sin cronómetros de reloj:
En cuanto alcance los $1.640 USDT (TP1), aseguramos el 50% del botín y mandamos el Stop Loss a Break-Even (Riesgo Cero).
Al tocar los $1.680 USDT (TP2), embolsamos otro 30% en la zona de resistencia intermedia y retesteo del bloque previo en gráficos de 15M.
El 20% restante lo dejamos estirar hacia los $1.730 USDT (TP3) buscando el objetivo máximo de recuperación del impulso intradía hacia la zona de oferta previa.
Ajusten sus órdenes y dejen que la gráfica haga su trabajo sin estar encima comiéndose las uñas. ¿Listos para la misión, soldados? Pasen a la mesa de conversación. 👇🎯🔥
Haz clic en el widget de $RENDER abajo para seguir la gráfica en directo y operar directamente en Binance.
#RENDER #RenderNetwork
¡Pilas por aquí, ejército! Abran la pantalla conmigo un segundo porque Render nos acaba de regalar un escenario táctico fascinante de reacción rápida operando estrictamente bajo nuestra doctrina de 5M, 15M y 1H. El precio sufrió una caída vertical muy fuerte con un clímax de volumen masivo que barrió liquidez de forma profunda hasta los $1.526 USDT. Inmediatamente se activó una reabsorción agresiva por los compradores institucionales con una mecha de rechazo gigantesca y un cambio de carácter alcista. Ahora cotiza en los $1.578 - $1.580 USDT recuperando terreno rápidamente. La jugada va clara en Long.
Ojo con esto: nada de perseguir velas a lo loco tras un rebote en "V". Mantenemos el plan de combate y esperamos el retroceso táctico de enfriamiento hacia nuestra zona de entrada en los $1.560 - $1.585 USDT para cazar la mejor relación riesgo-beneficio.
El Stop Loss va blindado en los $1.515 USDT, colocado con un colchón estratégico por debajo del mínimo del barrido institucional para blindar la cuenta ante mechas falsas. Si el mercado nos invalida la entrada, pagamos el 1% de peaje con la mente fría y mantenemos el capital a salvo.
El plan de toma de beneficios va enfocado a la estructura rápida de sesión (ventana de 4 a 8 horas), sin cronómetros de reloj:
En cuanto alcance los $1.640 USDT (TP1), aseguramos el 50% del botín y mandamos el Stop Loss a Break-Even (Riesgo Cero).
Al tocar los $1.680 USDT (TP2), embolsamos otro 30% en la zona de resistencia intermedia y retesteo del bloque previo en gráficos de 15M.
El 20% restante lo dejamos estirar hacia los $1.730 USDT (TP3) buscando el objetivo máximo de recuperación del impulso intradía hacia la zona de oferta previa.
Ajusten sus órdenes y dejen que la gráfica haga su trabajo sin estar encima comiéndose las uñas. ¿Listos para la misión, soldados? Pasen a la mesa de conversación. 👇🎯🔥
Haz clic en el widget de $RENDER abajo para seguir la gráfica en directo y operar directamente en Binance.
#RENDER #RenderNetwork
Ojo con esto: nada de perseguir velas a lo loco tras un rebote en "V". Mantenemos el plan de combate y esperamos el retroceso táctico de enfriamiento hacia nuestra zona de entrada en los $1.560 - $1.585 USDT para cazar la mejor relación riesgo-beneficio.
El Stop Loss va blindado en los $1.515 USDT, colocado con un colchón estratégico por debajo del mínimo del barrido institucional para blindar la cuenta ante mechas falsas. Si el mercado nos invalida la entrada, pagamos el 1% de peaje con la mente fría y mantenemos el capital a salvo.
El plan de toma de beneficios va enfocado a la estructura rápida de sesión (ventana de 4 a 8 horas), sin cronómetros de reloj:
En cuanto alcance los $1.640 USDT (TP1), aseguramos el 50% del botín y mandamos el Stop Loss a Break-Even (Riesgo Cero).
Al tocar los $1.680 USDT (TP2), embolsamos otro 30% en la zona de resistencia intermedia y retesteo del bloque previo en gráficos de 15M.
El 20% restante lo dejamos estirar hacia los $1.730 USDT (TP3) buscando el objetivo máximo de recuperación del impulso intradía hacia la zona de oferta previa.
Ajusten sus órdenes y dejen que la gráfica haga su trabajo sin estar encima comiéndose las uñas. ¿Listos para la misión, soldados? Pasen a la mesa de conversación. 👇🎯🔥
Haz clic en el widget de $RENDER abajo para seguir la gráfica en directo y operar directamente en Binance.
#RENDER #RenderNetwork
204
·
--
Частичная правда
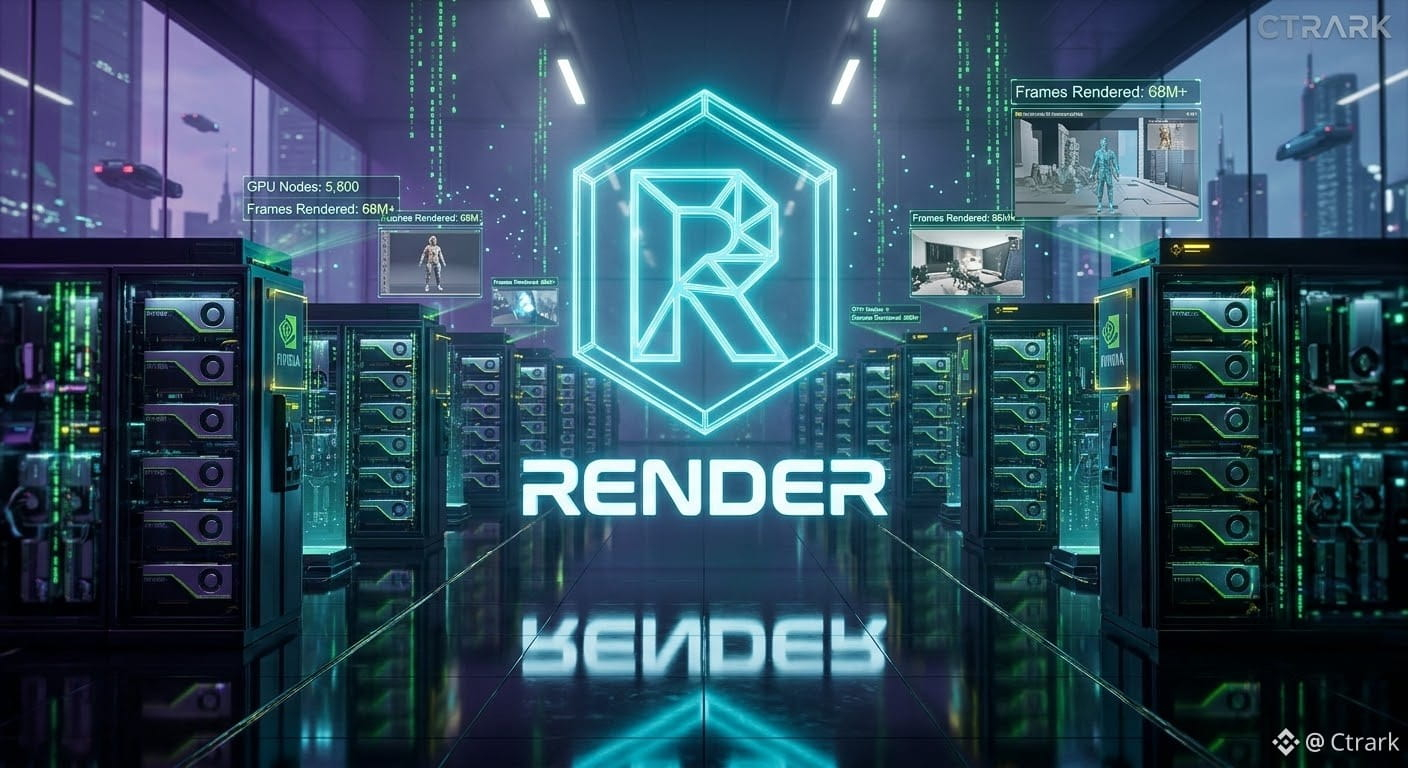
🔥 $RENDER tiene votación RNP-024 activa HOY (28-31 oct) . Y Octane 2026 acaba de lanzarse en la red
{future}(RENDERUSDT)
DATOS VERIFICABLES:
✅ 5,600 nodos GPU activos
✅ 68M+ frames renderizados
✅ Digital Commodities compró CDN$100K en $RENDER
✅ AI coins market cap +61% en Q3 2026
✅ On-chain volume $1.85B (trimestral high)
✅ -85.87% del ATH de $13.53
De $1.66 a $1.95 es +17%. De $1.95 a $2.60 es +33%.
El que entiende que votación activa + Octane 2026 + adquisición institucional + narrativa AI/GPU = explosión de precio, entiende por qué $RENDER es el líder en GPU rendering distribuido.
¿Compras en consolidación o esperas el breakout de $1.95? #RenderNetwork #CTRARK
🔥 $RENDER tiene votación RNP-024 activa HOY (28-31 oct) . Y Octane 2026 acaba de lanzarse en la red
DATOS VERIFICABLES:
✅ 5,600 nodos GPU activos
✅ 68M+ frames renderizados
✅ Digital Commodities compró CDN$100K en $RENDER
✅ AI coins market cap +61% en Q3 2026
✅ On-chain volume $1.85B (trimestral high)
✅ -85.87% del ATH de $13.53
De $1.66 a $1.95 es +17%. De $1.95 a $2.60 es +33%.
El que entiende que votación activa + Octane 2026 + adquisición institucional + narrativa AI/GPU = explosión de precio, entiende por qué $RENDER es el líder en GPU rendering distribuido.
¿Compras en consolidación o esperas el breakout de $1.95? #RenderNetwork #CTRARK
DATOS VERIFICABLES:
✅ 5,600 nodos GPU activos
✅ 68M+ frames renderizados
✅ Digital Commodities compró CDN$100K en $RENDER
✅ AI coins market cap +61% en Q3 2026
✅ On-chain volume $1.85B (trimestral high)
✅ -85.87% del ATH de $13.53
De $1.66 a $1.95 es +17%. De $1.95 a $2.60 es +33%.
El que entiende que votación activa + Octane 2026 + adquisición institucional + narrativa AI/GPU = explosión de precio, entiende por qué $RENDER es el líder en GPU rendering distribuido.
¿Compras en consolidación o esperas el breakout de $1.95? #RenderNetwork #CTRARK
1
3
803

·
--
Статья
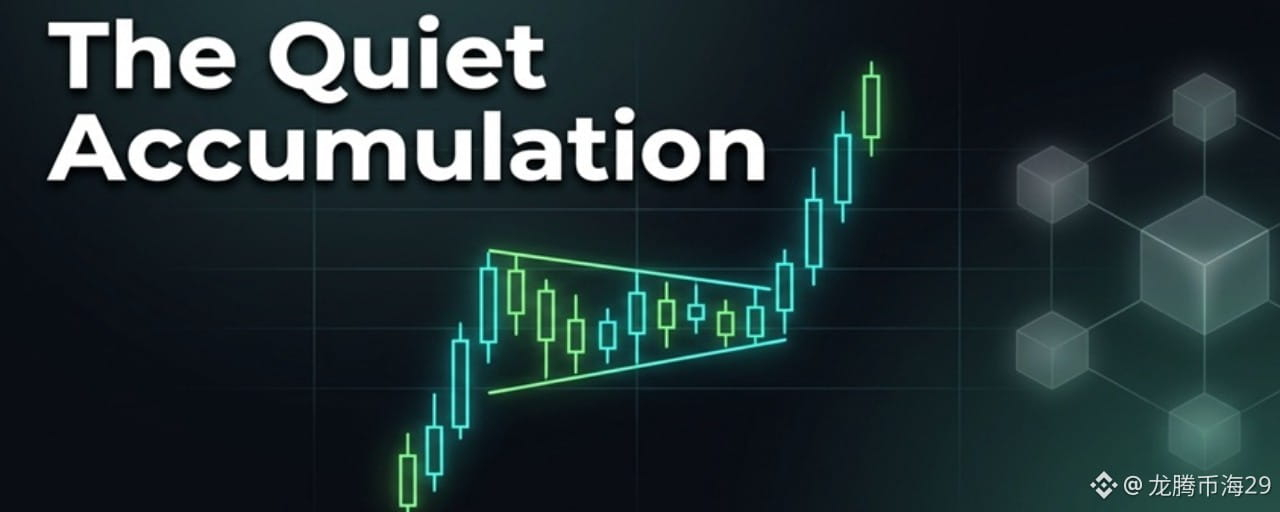
The Quiet Accumulation Happening Right Under the Market's NoseEveryone is staring at the major layer 1s fighting for liquidity, while the infrastructure powering the actual AI boom is quietly building a massive base.
While retail chases the latest meme coin pump, smart money has been quietly accumulating Render.
Let us look at the actual data. Over the past three weeks, while the broader altcoin market bled out in a slow grind, Render held a remarkably tight range. The daily candles are compressing. Volatility is dropping to multi-month lows. This coin is far from losing interest. It is a coiled spring.
Volume tells the real story. Spot volume on major exchanges has been steadily rising during these tight consolidation phases. Every minor dip is met with aggressive buy walls. The order book is thickening on the bid side, suggesting institutional accumulation is happening in the dark.
Technically, the structure is textbook. The price has been respecting a rising trendline on the four-hour chart for over a month. The 50-day moving average is curling upward and acting as dynamic support. RSI on the daily timeframe is hovering right around 50. This is the exact neutral zone where momentum shifts happen. A break above 60 with volume confirms bullish continuation. A drop below 40 warns of a deeper flush.
Fundamentally, the catalyst is already here. The demand for decentralized GPU rendering is a current reality. With AI model training requiring exponentially more compute power, Render provides the exact decentralized infrastructure the market needs. Recent network upgrades have drastically reduced latency, making the platform highly competitive against centralized cloud providers. The ecosystem is expanding, and actual usage metrics are climbing.
So what do the bulls need to prove? They need to push the price above the immediate overhead resistance with conviction. A clean break above the recent local high, backed by a spike in trading volume, will trigger the next leg up. They need to show that the accumulation phase is over and the markup phase has begun.
What could invalidate this setup? If the broader Bitcoin market suddenly loses a major support level, altcoins will get dragged down regardless of their individual strength. A high-volume breakdown below the current consolidation range would negate the bullish structure. In that scenario, the tight range becomes a bear flag, and the next stop is much lower.
The practical takeaway for traders is patience. Do not front-run the breakout. Wait for the volume confirmation. If you are already in a position, keep your stop loss just below the recent swing low. If you are looking to enter, wait for the market to prove its hand. Let the breakout happen, wait for a retest of the broken level, and then execute.
Markets reward those who can sit on their hands and wait for the perfect setup. The easy money is made in the boring moments right before the volatility expands.
Disclaimer: This analysis is for educational and informational purposes only and does not constitute financial advice. Cryptocurrency markets are highly volatile. Always conduct your own research, understand the risks, and manage your position size accordingly.
$RENDER
{future}(RENDERUSDT)
#RenderNetwork
The Quiet Accumulation Happening Right Under the Market's Nose
Everyone is staring at the major layer 1s fighting for liquidity, while the infrastructure powering the actual AI boom is quietly building a massive base.
While retail chases the latest meme coin pump, smart money has been quietly accumulating Render.
Let us look at the actual data. Over the past three weeks, while the broader altcoin market bled out in a slow grind, Render held a remarkably tight range. The daily candles are compressing. Volatility is dropping to multi-month lows. This coin is far from losing interest. It is a coiled spring.
Volume tells the real story. Spot volume on major exchanges has been steadily rising during these tight consolidation phases. Every minor dip is met with aggressive buy walls. The order book is thickening on the bid side, suggesting institutional accumulation is happening in the dark.
Technically, the structure is textbook. The price has been respecting a rising trendline on the four-hour chart for over a month. The 50-day moving average is curling upward and acting as dynamic support. RSI on the daily timeframe is hovering right around 50. This is the exact neutral zone where momentum shifts happen. A break above 60 with volume confirms bullish continuation. A drop below 40 warns of a deeper flush.
Fundamentally, the catalyst is already here. The demand for decentralized GPU rendering is a current reality. With AI model training requiring exponentially more compute power, Render provides the exact decentralized infrastructure the market needs. Recent network upgrades have drastically reduced latency, making the platform highly competitive against centralized cloud providers. The ecosystem is expanding, and actual usage metrics are climbing.
So what do the bulls need to prove? They need to push the price above the immediate overhead resistance with conviction. A clean break above the recent local high, backed by a spike in trading volume, will trigger the next leg up. They need to show that the accumulation phase is over and the markup phase has begun.
What could invalidate this setup? If the broader Bitcoin market suddenly loses a major support level, altcoins will get dragged down regardless of their individual strength. A high-volume breakdown below the current consolidation range would negate the bullish structure. In that scenario, the tight range becomes a bear flag, and the next stop is much lower.
The practical takeaway for traders is patience. Do not front-run the breakout. Wait for the volume confirmation. If you are already in a position, keep your stop loss just below the recent swing low. If you are looking to enter, wait for the market to prove its hand. Let the breakout happen, wait for a retest of the broken level, and then execute.
Markets reward those who can sit on their hands and wait for the perfect setup. The easy money is made in the boring moments right before the volatility expands.
Disclaimer: This analysis is for educational and informational purposes only and does not constitute financial advice. Cryptocurrency markets are highly volatile. Always conduct your own research, understand the risks, and manage your position size accordingly.
$RENDER
#RenderNetwork
While retail chases the latest meme coin pump, smart money has been quietly accumulating Render.
Let us look at the actual data. Over the past three weeks, while the broader altcoin market bled out in a slow grind, Render held a remarkably tight range. The daily candles are compressing. Volatility is dropping to multi-month lows. This coin is far from losing interest. It is a coiled spring.
Volume tells the real story. Spot volume on major exchanges has been steadily rising during these tight consolidation phases. Every minor dip is met with aggressive buy walls. The order book is thickening on the bid side, suggesting institutional accumulation is happening in the dark.
Technically, the structure is textbook. The price has been respecting a rising trendline on the four-hour chart for over a month. The 50-day moving average is curling upward and acting as dynamic support. RSI on the daily timeframe is hovering right around 50. This is the exact neutral zone where momentum shifts happen. A break above 60 with volume confirms bullish continuation. A drop below 40 warns of a deeper flush.
Fundamentally, the catalyst is already here. The demand for decentralized GPU rendering is a current reality. With AI model training requiring exponentially more compute power, Render provides the exact decentralized infrastructure the market needs. Recent network upgrades have drastically reduced latency, making the platform highly competitive against centralized cloud providers. The ecosystem is expanding, and actual usage metrics are climbing.
So what do the bulls need to prove? They need to push the price above the immediate overhead resistance with conviction. A clean break above the recent local high, backed by a spike in trading volume, will trigger the next leg up. They need to show that the accumulation phase is over and the markup phase has begun.
What could invalidate this setup? If the broader Bitcoin market suddenly loses a major support level, altcoins will get dragged down regardless of their individual strength. A high-volume breakdown below the current consolidation range would negate the bullish structure. In that scenario, the tight range becomes a bear flag, and the next stop is much lower.
The practical takeaway for traders is patience. Do not front-run the breakout. Wait for the volume confirmation. If you are already in a position, keep your stop loss just below the recent swing low. If you are looking to enter, wait for the market to prove its hand. Let the breakout happen, wait for a retest of the broken level, and then execute.
Markets reward those who can sit on their hands and wait for the perfect setup. The easy money is made in the boring moments right before the volatility expands.
Disclaimer: This analysis is for educational and informational purposes only and does not constitute financial advice. Cryptocurrency markets are highly volatile. Always conduct your own research, understand the risks, and manage your position size accordingly.
$RENDER
#RenderNetwork
1
102

·
--
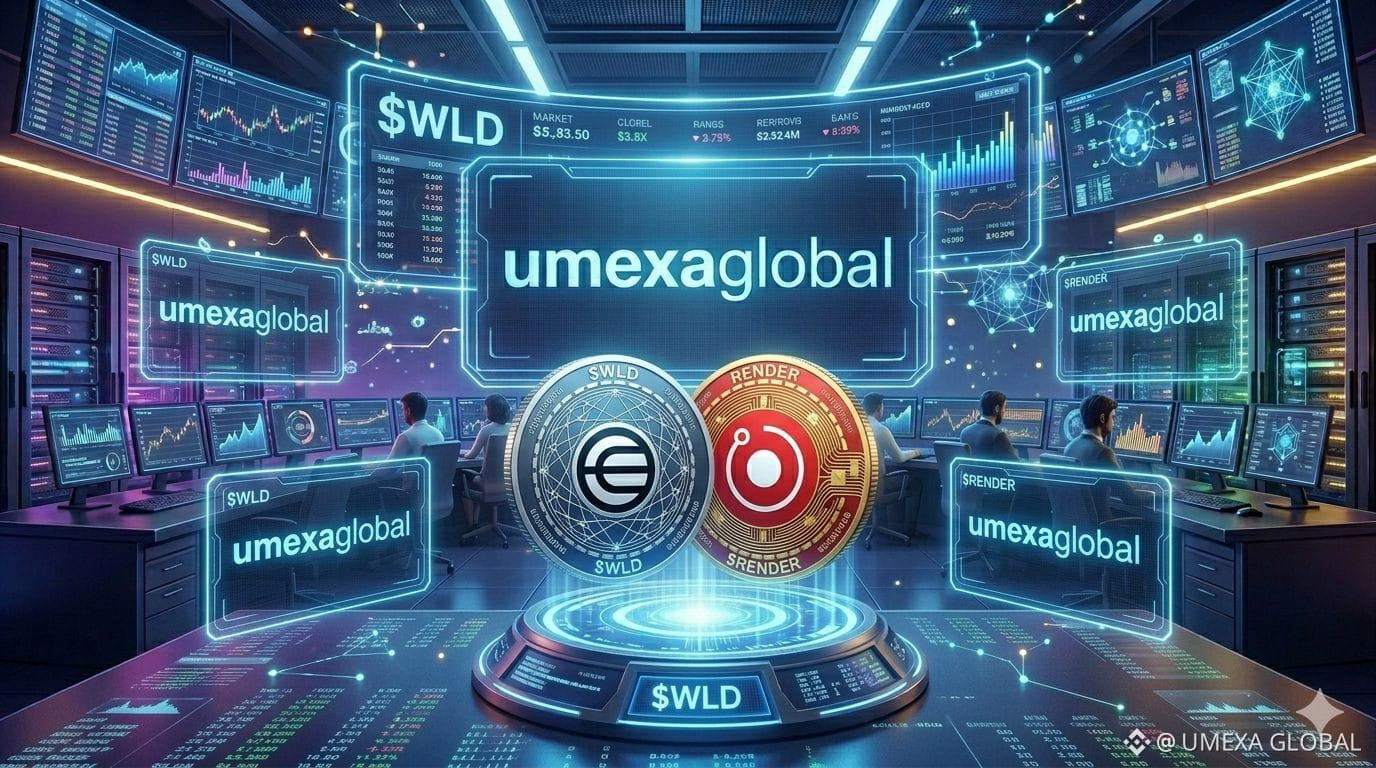
WLD & Render Breakout Setup!
Worldcoin ($WLD) reclaims its $1B macro cap targeting a major squeeze past $0.31. Simultaneously $RENDER triggers a 13% daily surge off local support. Watch the AI volume for next explosive leg up! $WLD $RENDER #WLD #RenderNetwork
{future}(RENDERUSDT)
{future}(WLDUSDT)
WLD & Render Breakout Setup!
Worldcoin ($WLD ) reclaims its $1B macro cap targeting a major squeeze past $0.31. Simultaneously $RENDER triggers a 13% daily surge off local support. Watch the AI volume for next explosive leg up! $WLD $RENDER #WLD #RenderNetwork
Worldcoin ($WLD ) reclaims its $1B macro cap targeting a major squeeze past $0.31. Simultaneously $RENDER triggers a 13% daily surge off local support. Watch the AI volume for next explosive leg up! $WLD $RENDER #WLD #RenderNetwork
7
2
240
·
--
Проверено
🛸 $RENDER Escasez de GPU y Nueva Subred Impulsan el Ecosistema 🧠🚀
{future}(RENDERUSDT)
$RENDER Network vive un hito histórico: la demanda de potencia gráfica superó a la oferta por primera vez en 8 años. Además, se aprobó la propuesta RNP-023 para integrar a Salad Network como subred exclusiva,
aportando miles de GPUs y estimando $4.3M en ingresos el primer año en tokens $RENDER . Las restricciones de IA centralizada aceleran la rotación hacia DePIN.
📈 Técnico: El precio cotiza firme en $1.70, defendiendo un soporte clave tras la absorción.
💡 Proyección: Sostener este nivel proyecta una recuperación inmediata hacia los $2.00. ¡Aprovecha la acumulación#RenderNetwork #CTRARK
🛸 $RENDER Escasez de GPU y Nueva Subred Impulsan el Ecosistema 🧠🚀
$RENDER Network vive un hito histórico: la demanda de potencia gráfica superó a la oferta por primera vez en 8 años. Además, se aprobó la propuesta RNP-023 para integrar a Salad Network como subred exclusiva,
aportando miles de GPUs y estimando $4.3M en ingresos el primer año en tokens $RENDER . Las restricciones de IA centralizada aceleran la rotación hacia DePIN.
📈 Técnico: El precio cotiza firme en $1.70, defendiendo un soporte clave tras la absorción.
💡 Proyección: Sostener este nivel proyecta una recuperación inmediata hacia los $2.00. ¡Aprovecha la acumulación#RenderNetwork #CTRARK
$RENDER Network vive un hito histórico: la demanda de potencia gráfica superó a la oferta por primera vez en 8 años. Además, se aprobó la propuesta RNP-023 para integrar a Salad Network como subred exclusiva,
aportando miles de GPUs y estimando $4.3M en ingresos el primer año en tokens $RENDER . Las restricciones de IA centralizada aceleran la rotación hacia DePIN.
📈 Técnico: El precio cotiza firme en $1.70, defendiendo un soporte clave tras la absorción.
💡 Proyección: Sostener este nivel proyecta una recuperación inmediata hacia los $2.00. ¡Aprovecha la acumulación#RenderNetwork #CTRARK
6
1.2k

·
--
🤖 The Global GPU Crisis: Why AI Growth Drives the Bull Thesis for $RNDR 💸
The global artificial intelligence boom faces one massive bottleneck: an extreme shortage of high-end graphics processing units (GPUs). Render Network solves this by creating a decentralized marketplace for computing power.
The Fundamental Drivers:
🎬 Surging Enterprise Demand: Next-gen AI video generators, digital artists, and tech startups are bypassing traditional cloud limits to render on-chain.
🔥 Token Utility: Network utilization scales directly with token burns and ecosystem velocity, aligning protocol growth with structural asset utility.
Buying the infrastructure layer of AI minimizes the risk of chasing speculative hype. Are you holding the computing power of the future? 🧠👇
👉 Review the current market depth and execute your trade parameters directly here:
[Insert $RNDR Trading Widget / Cashtag $RNDR]
#RenderNetwork $RNDR #AICrypto #DecentralizedCompute #CryptoNews
🤖 The Global GPU Crisis: Why AI Growth Drives the Bull Thesis for $RNDR 💸
The global artificial intelligence boom faces one massive bottleneck: an extreme shortage of high-end graphics processing units (GPUs). Render Network solves this by creating a decentralized marketplace for computing power.
The Fundamental Drivers:
🎬 Surging Enterprise Demand: Next-gen AI video generators, digital artists, and tech startups are bypassing traditional cloud limits to render on-chain.
🔥 Token Utility: Network utilization scales directly with token burns and ecosystem velocity, aligning protocol growth with structural asset utility.
Buying the infrastructure layer of AI minimizes the risk of chasing speculative hype. Are you holding the computing power of the future? 🧠👇
👉 Review the current market depth and execute your trade parameters directly here:
[Insert $RNDR Trading Widget / Cashtag $RNDR]
#RenderNetwork $RNDR #AICrypto #DecentralizedCompute #CryptoNews
The global artificial intelligence boom faces one massive bottleneck: an extreme shortage of high-end graphics processing units (GPUs). Render Network solves this by creating a decentralized marketplace for computing power.
The Fundamental Drivers:
🎬 Surging Enterprise Demand: Next-gen AI video generators, digital artists, and tech startups are bypassing traditional cloud limits to render on-chain.
🔥 Token Utility: Network utilization scales directly with token burns and ecosystem velocity, aligning protocol growth with structural asset utility.
Buying the infrastructure layer of AI minimizes the risk of chasing speculative hype. Are you holding the computing power of the future? 🧠👇
👉 Review the current market depth and execute your trade parameters directly here:
[Insert $RNDR Trading Widget / Cashtag $RNDR]
#RenderNetwork $RNDR #AICrypto #DecentralizedCompute #CryptoNews
200
·
--
Проверено
🎨 $RENDER GPU descentralizado para la era de la IA. Y el mercado todavía no lo valora correctamente.
{future}(RENDERUSDT)
NVIDIA está en su conferencia. WME también. $RENDER Con 2026 reunió a los líderes de AI, medios y cómputo en Hollywood.
Las ventas de red crecieron +57% en Q1 2026. Modelo Burn-Mint activo cada trabajo quema tokens permanentemente.
La IA necesita GPU. Los estudios necesitan $RENDER . Render Network conecta los dos sin intermediarios.
ATH: $13.53. Precio en el suelo. Fundamentales en alza.#RenderNetwork #CTRARK
🎨 $RENDER GPU descentralizado para la era de la IA. Y el mercado todavía no lo valora correctamente.
NVIDIA está en su conferencia. WME también. $RENDER Con 2026 reunió a los líderes de AI, medios y cómputo en Hollywood.
Las ventas de red crecieron +57% en Q1 2026. Modelo Burn-Mint activo cada trabajo quema tokens permanentemente.
La IA necesita GPU. Los estudios necesitan $RENDER . Render Network conecta los dos sin intermediarios.
ATH: $13.53. Precio en el suelo. Fundamentales en alza.#RenderNetwork #CTRARK
NVIDIA está en su conferencia. WME también. $RENDER Con 2026 reunió a los líderes de AI, medios y cómputo en Hollywood.
Las ventas de red crecieron +57% en Q1 2026. Modelo Burn-Mint activo cada trabajo quema tokens permanentemente.
La IA necesita GPU. Los estudios necesitan $RENDER . Render Network conecta los dos sin intermediarios.
ATH: $13.53. Precio en el suelo. Fundamentales en alza.#RenderNetwork #CTRARK
4
616
·
--
$RENDER
{future}(RENDERUSDT)
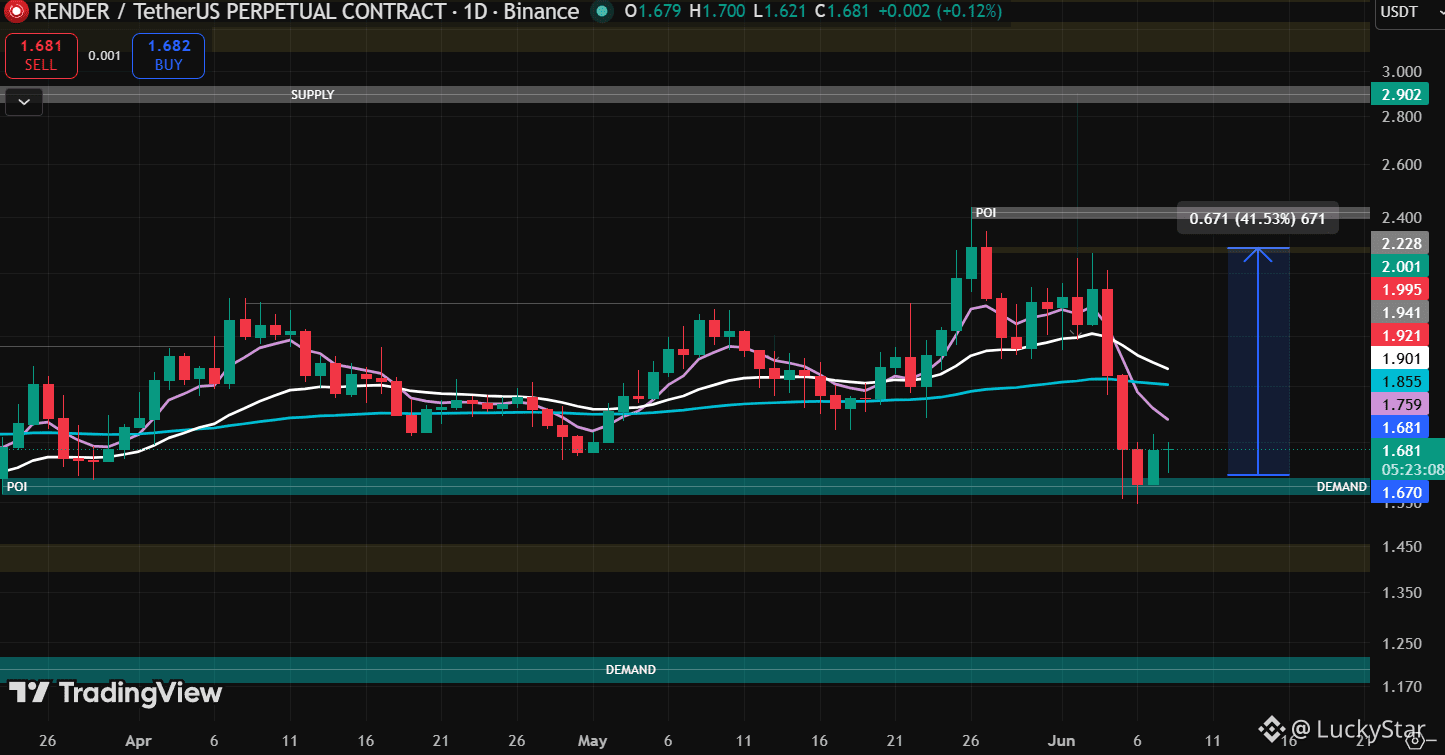
🟩 Long Setup
Entry: After confirmation above 1.70 USDT with volume support.
Target: 2.00–2.23 USDT, upper supply zones (≈ +41%).
Stop: Below 1.67 USDT.
#render #RenderNetwork #crypto
$RENDER
🟩 Long Setup
Entry: After confirmation above 1.70 USDT with volume support.
Target: 2.00–2.23 USDT, upper supply zones (≈ +41%).
Stop: Below 1.67 USDT.
#render #RenderNetwork #crypto
🟩 Long Setup
Entry: After confirmation above 1.70 USDT with volume support.
Target: 2.00–2.23 USDT, upper supply zones (≈ +41%).
Stop: Below 1.67 USDT.
#render #RenderNetwork #crypto
95

·
--
Рост
$RNDR
RNDR | Perp
Render Ready. Buy signal. Score 73/100.
Entry: 8.30 - 8.55
TP: 9.20 | 9.80 | SL: 7.98
Major support at 8.15. Consolidation looks complete.
👇 Volume is dry right now. Let's see if bulls step in next hour.
#RNDR #RenderNetwork #Signals
$RNDR
RNDR | Perp
Render Ready. Buy signal. Score 73/100.
Entry: 8.30 - 8.55
TP: 9.20 | 9.80 | SL: 7.98
Major support at 8.15. Consolidation looks complete.
👇 Volume is dry right now. Let's see if bulls step in next hour.
#RNDR #RenderNetwork #Signals
RNDR | Perp
Render Ready. Buy signal. Score 73/100.
Entry: 8.30 - 8.55
TP: 9.20 | 9.80 | SL: 7.98
Major support at 8.15. Consolidation looks complete.
👇 Volume is dry right now. Let's see if bulls step in next hour.
#RNDR #RenderNetwork #Signals
2
201

·
--
Падение
$RENDER Is in fire 🔥. Follow my instructions to get profit 🚀.
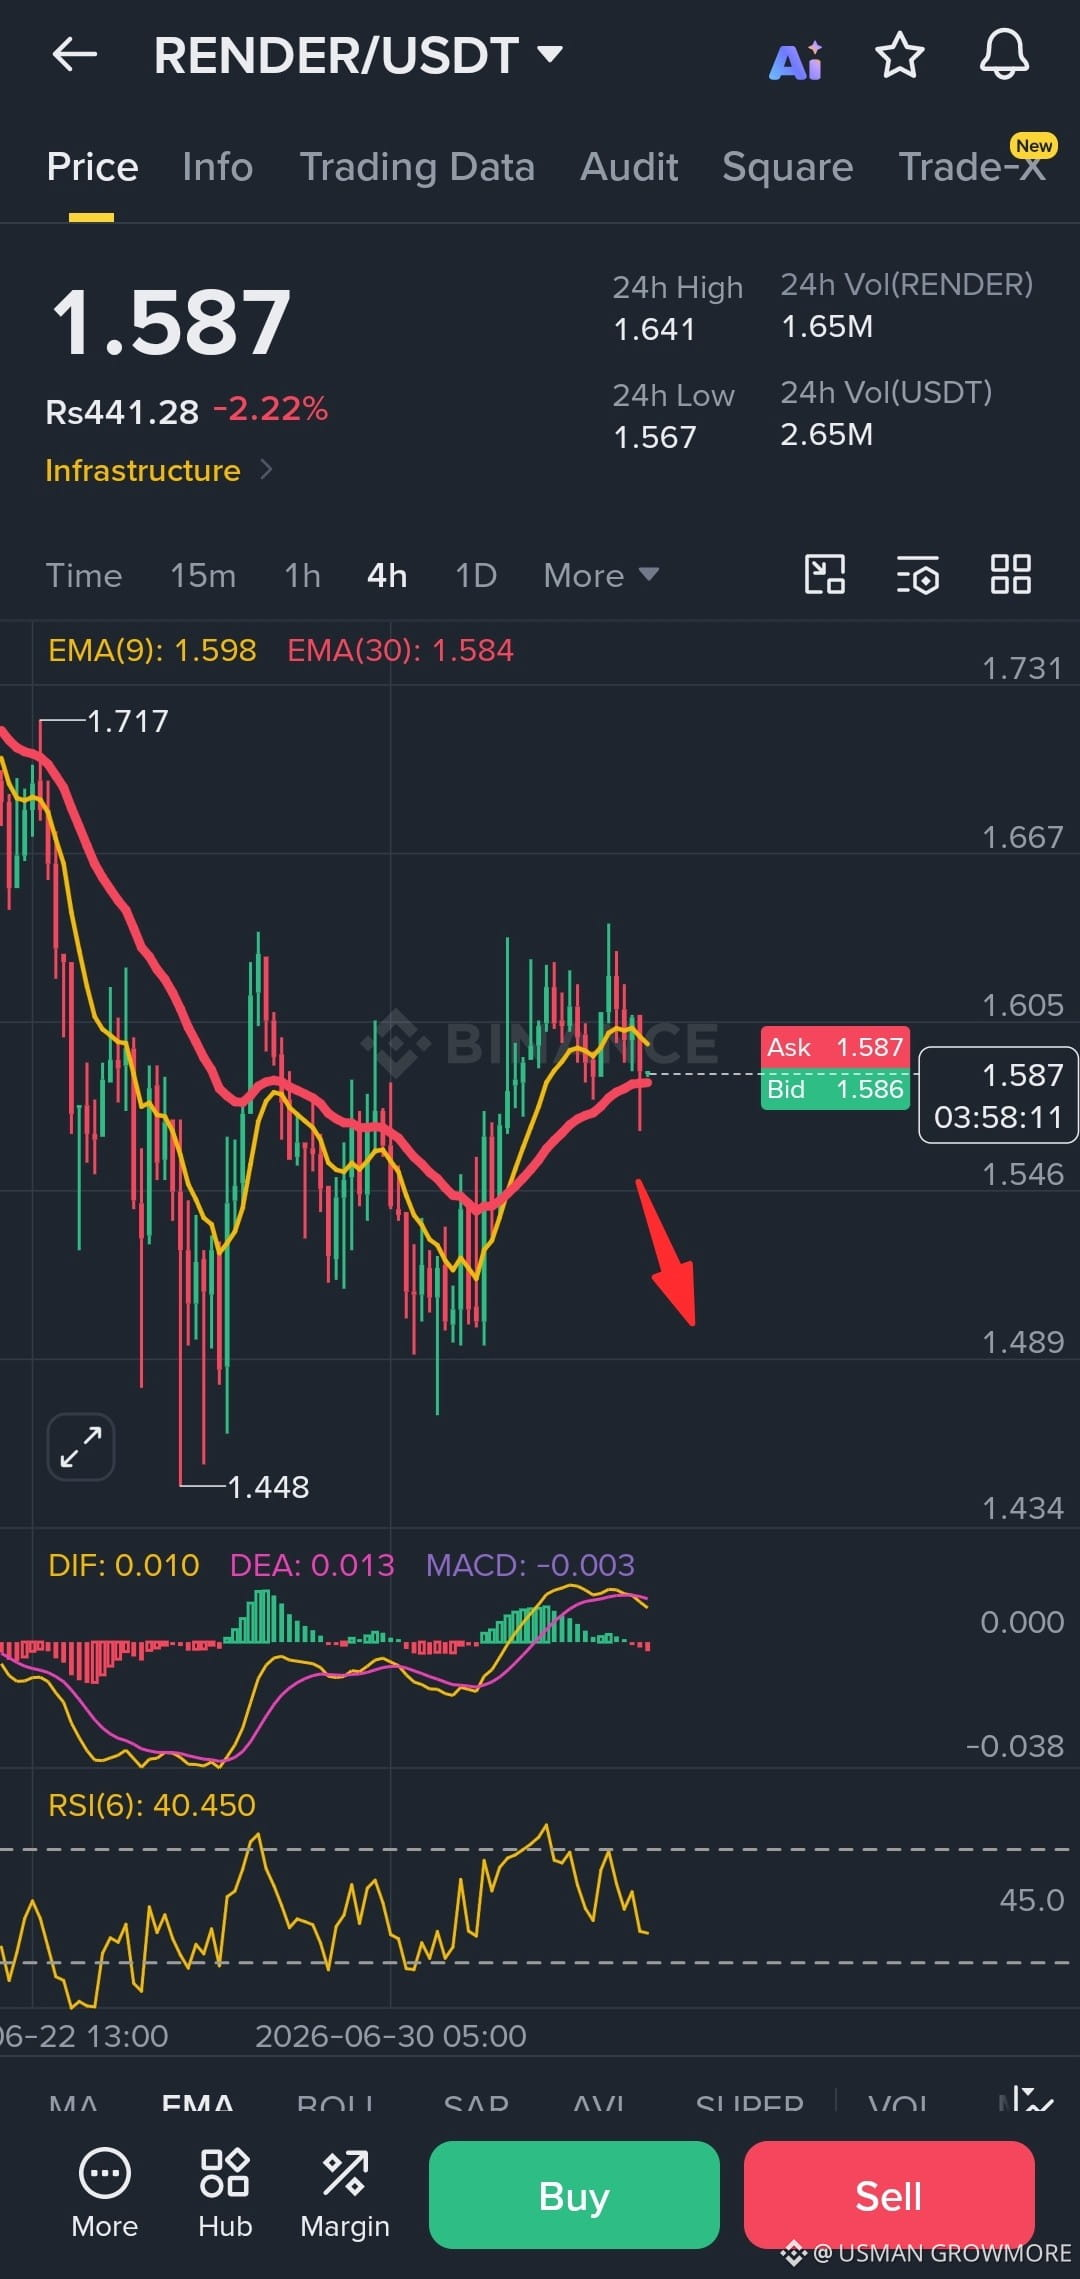
🛡️ Risk Management Parameters
🛑 Strict Stop Loss (SL): $1.641 (Candle body close above the recent local swing high and 24h high resistance level visible on the 4h chart) 🛑📉⚠️
🎯 TP1 (Immediate Demand): $1.546 (Local structural support floor visible near the horizontal grid line) 🚀
🎯 TP2 (Psychological Wall): $1.500 (Major psychological round number expected to anchor heavy buy-side limit order clusters) 🧱
🎯 TP3 (External Liquidity Target): $1.448 (Clean sweep of sell-side liquidity resting at the prior major swing low) 💥🎯
⚠️ DYOR 🧠 | 📈 The analysis above is based on my personal research and market understanding. 🚫 This is NOT financial advice. 💸 Invest wisely and always conduct your own research before investing. 🔍
$RENDER #RenderNetwork
{spot}(RENDERUSDT)
$RENDER Is in fire 🔥. Follow my instructions to get profit 🚀.
🛡️ Risk Management Parameters
🛑 Strict Stop Loss (SL): $1.641 (Candle body close above the recent local swing high and 24h high resistance level visible on the 4h chart) 🛑📉⚠️
🎯 TP1 (Immediate Demand): $1.546 (Local structural support floor visible near the horizontal grid line) 🚀
🎯 TP2 (Psychological Wall): $1.500 (Major psychological round number expected to anchor heavy buy-side limit order clusters) 🧱
🎯 TP3 (External Liquidity Target): $1.448 (Clean sweep of sell-side liquidity resting at the prior major swing low) 💥🎯
⚠️ DYOR 🧠 | 📈 The analysis above is based on my personal research and market understanding. 🚫 This is NOT financial advice. 💸 Invest wisely and always conduct your own research before investing. 🔍
$RENDER #RenderNetwork
🛡️ Risk Management Parameters
🛑 Strict Stop Loss (SL): $1.641 (Candle body close above the recent local swing high and 24h high resistance level visible on the 4h chart) 🛑📉⚠️
🎯 TP1 (Immediate Demand): $1.546 (Local structural support floor visible near the horizontal grid line) 🚀
🎯 TP2 (Psychological Wall): $1.500 (Major psychological round number expected to anchor heavy buy-side limit order clusters) 🧱
🎯 TP3 (External Liquidity Target): $1.448 (Clean sweep of sell-side liquidity resting at the prior major swing low) 💥🎯
⚠️ DYOR 🧠 | 📈 The analysis above is based on my personal research and market understanding. 🚫 This is NOT financial advice. 💸 Invest wisely and always conduct your own research before investing. 🔍
$RENDER #RenderNetwork
2
27

·
--
Don't Miss the Next Wave: Why DePIN and AI is the Smartest Bet for 2026The crypto market always rewards those who position themselves before the crowd arrives. If you missed the early stages of the Layer-1 season or the meme-coin madness, you cannot afford to miss the massive convergence happening right now: the merge of Artificial Intelligence and DePIN.
This is no longer a temporary narrative driven by internet hype. It is driven by an absolute structural necessity in the real world. A perfect example of this utility is $RENDER , which connects global compute supply with real demand. Here is why this sector is the ultimate asymmetric bet:
1. **The Global Compute Crunch:** Traditional Web2 giants cannot build data centers fast enough to satisfy the explosive demand for AI model training. There is a massive global shortage of high-end graphics cards. Decentralized networks like $RENDER solve this by crowdsourcing idle GPU power from all over the world, offering it at a fraction of the cost.
2. **Deflationary Value Capture:** The top tier projects in this niche are moving away from inflationary reward models. They are generating real-world protocol revenue. When an AI startup rents decentralized computing power via $RENDER , a portion of that revenue is used to buy back and burn the native tokens, permanently shrinking the circulating supply.
The infrastructure layer for the future digital economy is being laid out right now. Waiting for the absolute peak of the bull run to buy means entering when the smart money is already exiting.#RenderNetwork #render #DePIN #CryptoAI #TrendingTopic
Don't Miss the Next Wave: Why DePIN and AI is the Smartest Bet for 2026
The crypto market always rewards those who position themselves before the crowd arrives. If you missed the early stages of the Layer-1 season or the meme-coin madness, you cannot afford to miss the massive convergence happening right now: the merge of Artificial Intelligence and DePIN.
This is no longer a temporary narrative driven by internet hype. It is driven by an absolute structural necessity in the real world. A perfect example of this utility is $RENDER , which connects global compute supply with real demand. Here is why this sector is the ultimate asymmetric bet:
1. **The Global Compute Crunch:** Traditional Web2 giants cannot build data centers fast enough to satisfy the explosive demand for AI model training. There is a massive global shortage of high-end graphics cards. Decentralized networks like $RENDER solve this by crowdsourcing idle GPU power from all over the world, offering it at a fraction of the cost.
2. **Deflationary Value Capture:** The top tier projects in this niche are moving away from inflationary reward models. They are generating real-world protocol revenue. When an AI startup rents decentralized computing power via $RENDER , a portion of that revenue is used to buy back and burn the native tokens, permanently shrinking the circulating supply.
The infrastructure layer for the future digital economy is being laid out right now. Waiting for the absolute peak of the bull run to buy means entering when the smart money is already exiting.#RenderNetwork #render #DePIN #CryptoAI #TrendingTopic
This is no longer a temporary narrative driven by internet hype. It is driven by an absolute structural necessity in the real world. A perfect example of this utility is $RENDER , which connects global compute supply with real demand. Here is why this sector is the ultimate asymmetric bet:
1. **The Global Compute Crunch:** Traditional Web2 giants cannot build data centers fast enough to satisfy the explosive demand for AI model training. There is a massive global shortage of high-end graphics cards. Decentralized networks like $RENDER solve this by crowdsourcing idle GPU power from all over the world, offering it at a fraction of the cost.
2. **Deflationary Value Capture:** The top tier projects in this niche are moving away from inflationary reward models. They are generating real-world protocol revenue. When an AI startup rents decentralized computing power via $RENDER , a portion of that revenue is used to buy back and burn the native tokens, permanently shrinking the circulating supply.
The infrastructure layer for the future digital economy is being laid out right now. Waiting for the absolute peak of the bull run to buy means entering when the smart money is already exiting.#RenderNetwork #render #DePIN #CryptoAI #TrendingTopic
1
71
·
--
$RENDER
{future}(RENDERUSDT)
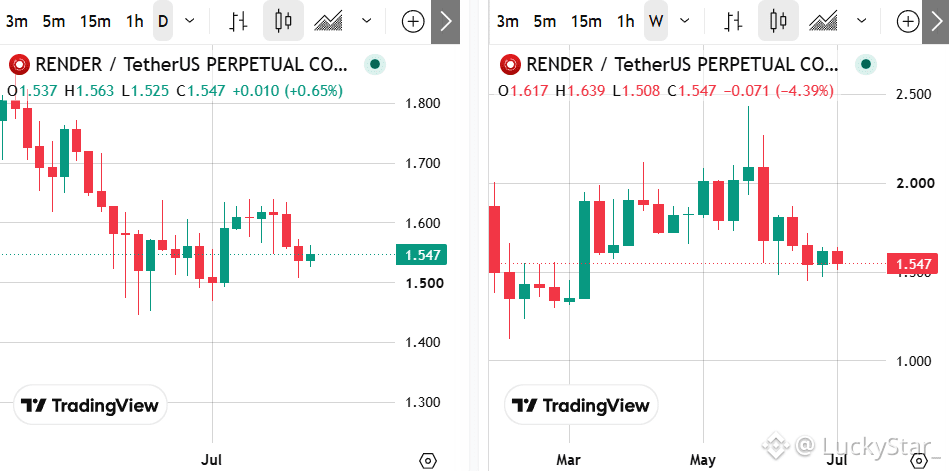
RENDER is stabilizing after a prolonged decline, forming a narrow consolidation range between 1.50 USDT and 1.62 USDT. The daily chart shows low volatility and compression, while the weekly view confirms a potential accumulation zone.
A breakout above resistance could trigger a short‑term recovery, while failure to hold support may extend the correction.
#RenderNetwork #render #BTC #TradingCommunity
$RENDER
RENDER is stabilizing after a prolonged decline, forming a narrow consolidation range between 1.50 USDT and 1.62 USDT. The daily chart shows low volatility and compression, while the weekly view confirms a potential accumulation zone.
A breakout above resistance could trigger a short‑term recovery, while failure to hold support may extend the correction.
#RenderNetwork #render #BTC #TradingCommunity
RENDER is stabilizing after a prolonged decline, forming a narrow consolidation range between 1.50 USDT and 1.62 USDT. The daily chart shows low volatility and compression, while the weekly view confirms a potential accumulation zone.
A breakout above resistance could trigger a short‑term recovery, while failure to hold support may extend the correction.
#RenderNetwork #render #BTC #TradingCommunity
88

·
--
Рост
📈 PROYECCIÓN TÁCTICA LINKUSDT y RENDERUSDT :
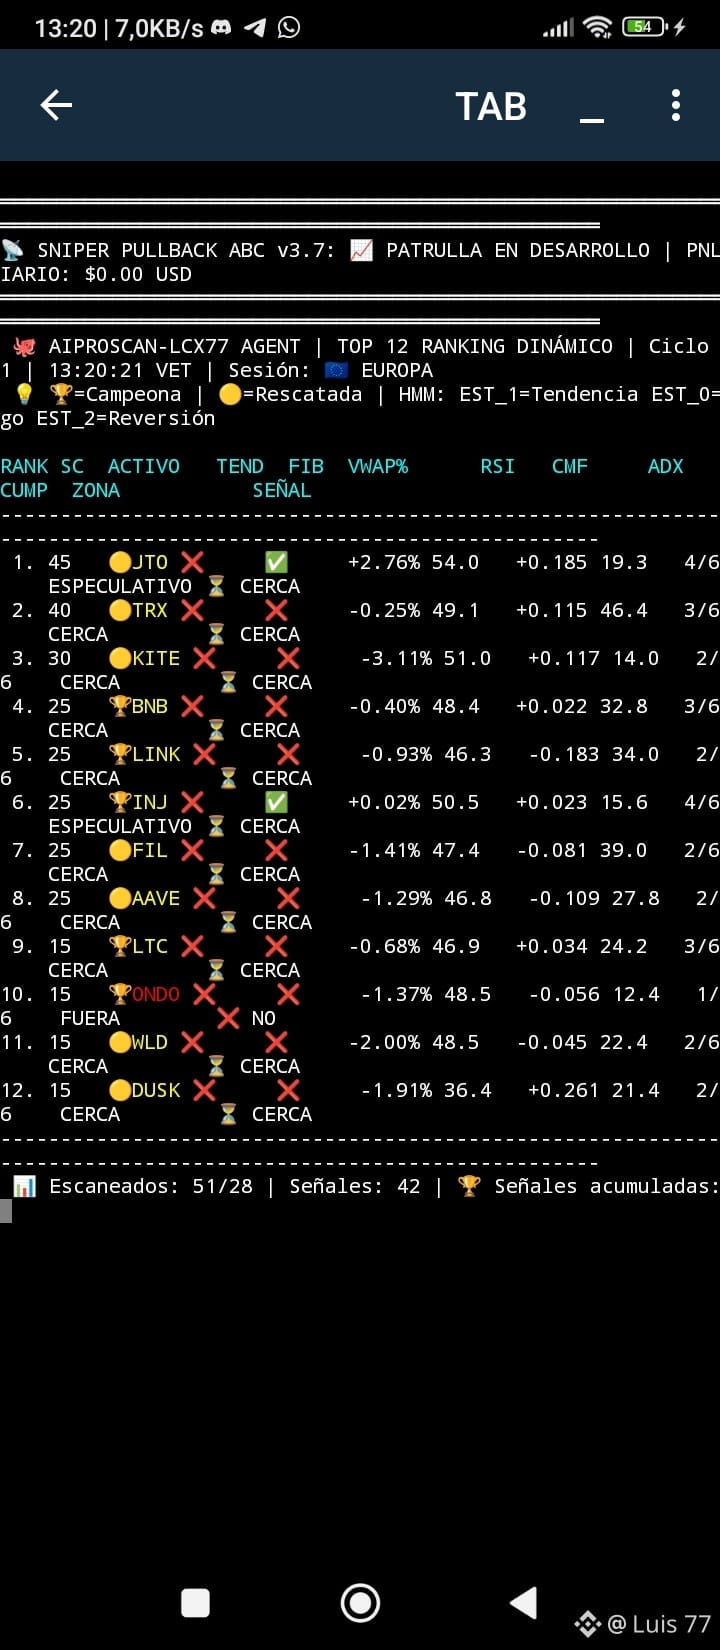
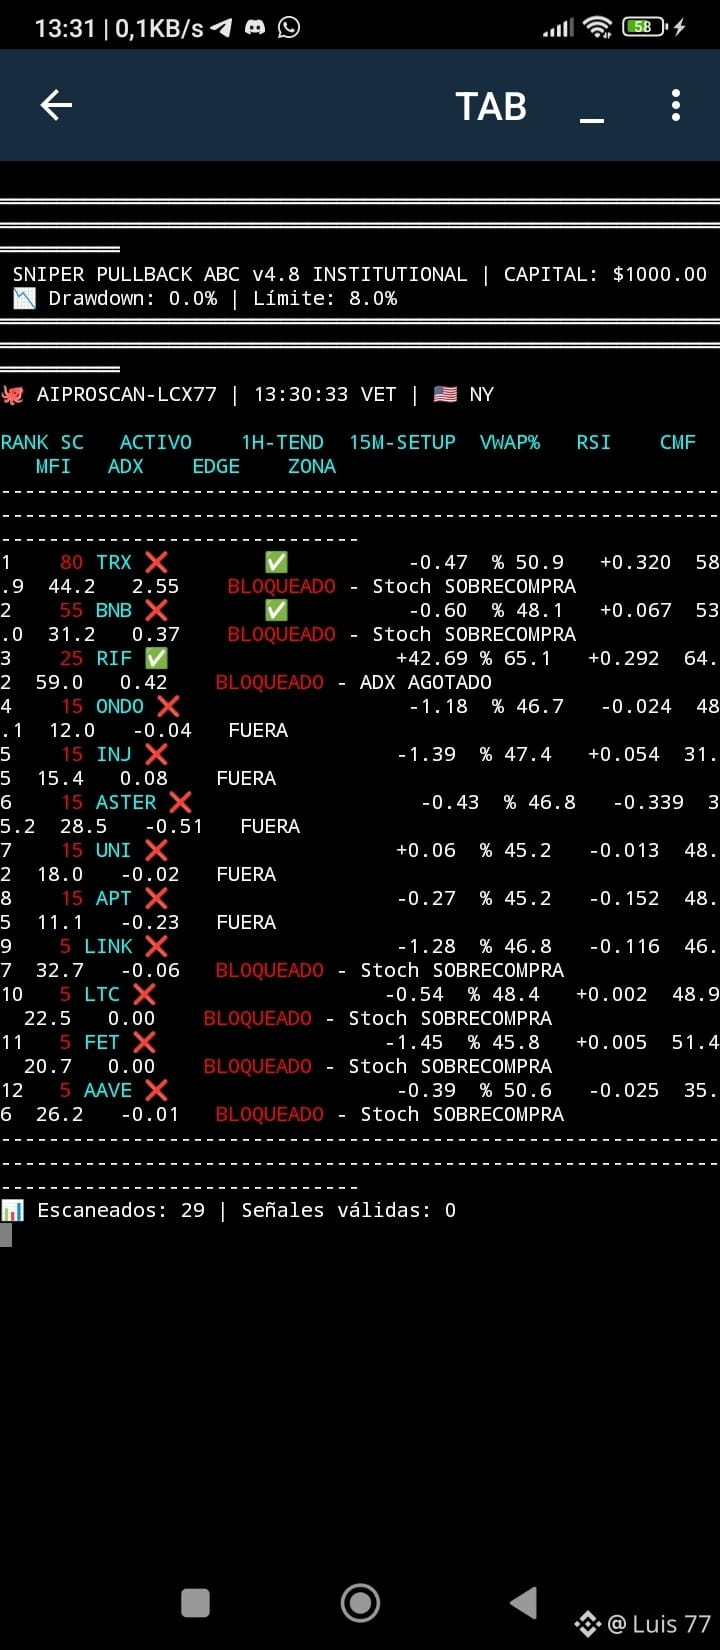
Diagnóstico: Sniper v4.8 bloqueó por Stoch >80 (sobrecompra). ZVD muestra CMF +0.170 sólido pero VWAP -1.1% (precio bajo VWAP = divergencia bajista en precio con flujo alcista). Quantum no la prioriza (Score<55).
Proyección: Rango neutral $8.32 - $8.61. Ruptura sobre $8.61 con volumen >$2M activaría entrada Long hacia $8.80. Debajo de $8.32 invalidaría estructura.
Acción: Esperar corrección a VWAP ($8.60) y que Stoch enfríe (<50) para re-evaluar entrada. No operar ahora.
---
📈 PROYECCIÓN TÁCTICA RENDERUSDT
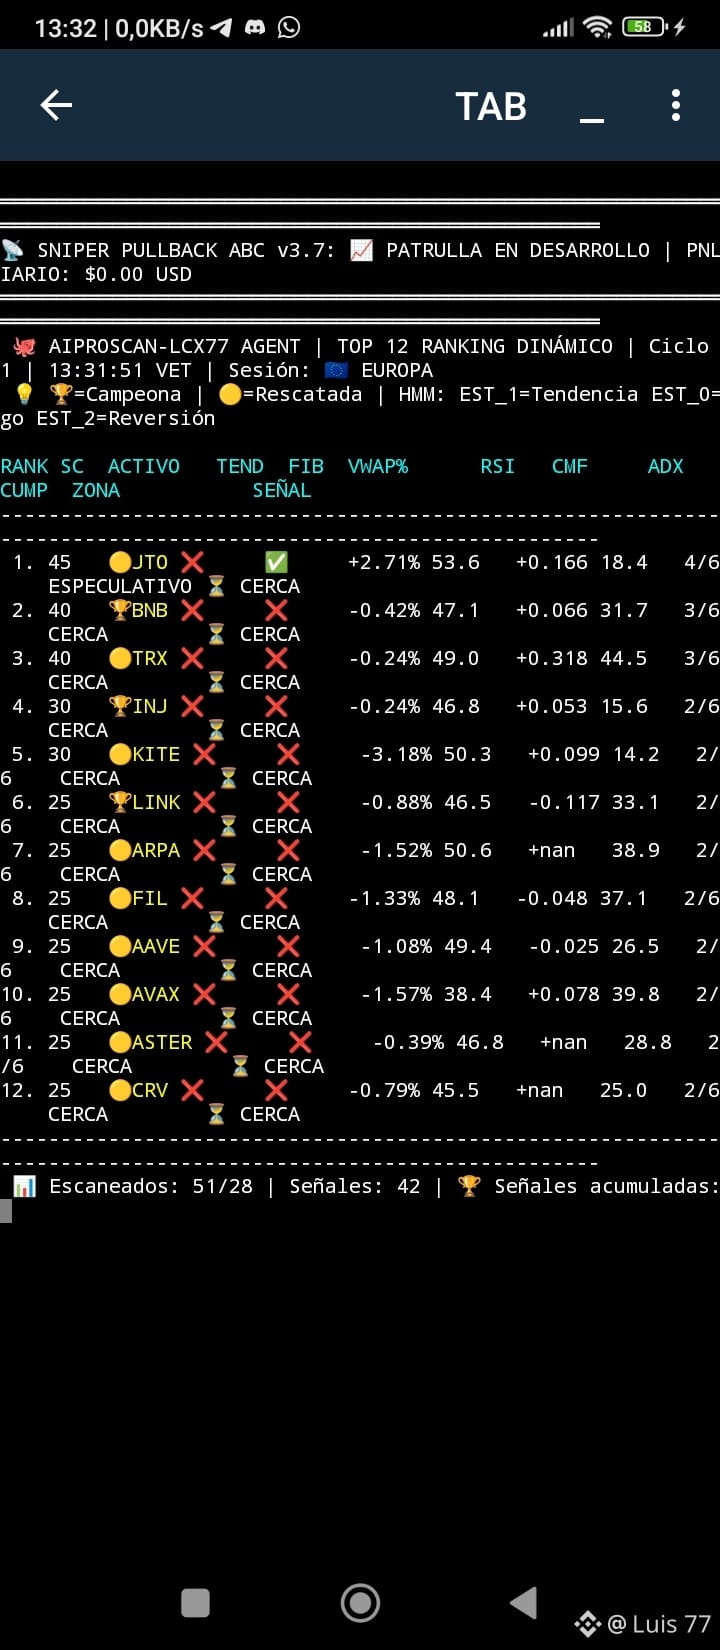
Diagnóstico: Sniper v3.7 detectó "CERCA" (3/6 criterios). ADX 35.0 (tendencia débil-moderada), RSI 52.5 (neutral), CMF +0.189 (flujo positivo). Sniper v4.8 bloqueó por Stoch sobrecompra. ZVD confirma rango neutro.
Proyección: Soporte $1.43 (BB inferior) / Resistencia $1.55 (BB superior + VWAP). Escenario más probable: movimiento lateral entre $1.48 - $1.53 hasta definición de sesión NY.
Acción: Sin ventaja táctica. Si RSI supera 60 con CMF >+0.20, cambiaría a vigilancia activa Long. Por ahora, patrulla pasiva.#RenderNetwork #LINK #SKHynixRisesOver5%Premarket #DePIN #LUIS77 $BTC
{future}(RENDERUSDT)
{future}(LINKUSDT)
{future}(NEARUSDT)
📈 PROYECCIÓN TÁCTICA LINKUSDT y RENDERUSDT :
Diagnóstico: Sniper v4.8 bloqueó por Stoch >80 (sobrecompra). ZVD muestra CMF +0.170 sólido pero VWAP -1.1% (precio bajo VWAP = divergencia bajista en precio con flujo alcista). Quantum no la prioriza (Score<55).
Proyección: Rango neutral $8.32 - $8.61. Ruptura sobre $8.61 con volumen >$2M activaría entrada Long hacia $8.80. Debajo de $8.32 invalidaría estructura.
Acción: Esperar corrección a VWAP ($8.60) y que Stoch enfríe (<50) para re-evaluar entrada. No operar ahora.
---
📈 PROYECCIÓN TÁCTICA RENDERUSDT
Diagnóstico: Sniper v3.7 detectó "CERCA" (3/6 criterios). ADX 35.0 (tendencia débil-moderada), RSI 52.5 (neutral), CMF +0.189 (flujo positivo). Sniper v4.8 bloqueó por Stoch sobrecompra. ZVD confirma rango neutro.
Proyección: Soporte $1.43 (BB inferior) / Resistencia $1.55 (BB superior + VWAP). Escenario más probable: movimiento lateral entre $1.48 - $1.53 hasta definición de sesión NY.
Acción: Sin ventaja táctica. Si RSI supera 60 con CMF >+0.20, cambiaría a vigilancia activa Long. Por ahora, patrulla pasiva.#RenderNetwork #LINK #SKHynixRisesOver5%Premarket #DePIN #LUIS77 $BTC
Diagnóstico: Sniper v4.8 bloqueó por Stoch >80 (sobrecompra). ZVD muestra CMF +0.170 sólido pero VWAP -1.1% (precio bajo VWAP = divergencia bajista en precio con flujo alcista). Quantum no la prioriza (Score<55).
Proyección: Rango neutral $8.32 - $8.61. Ruptura sobre $8.61 con volumen >$2M activaría entrada Long hacia $8.80. Debajo de $8.32 invalidaría estructura.
Acción: Esperar corrección a VWAP ($8.60) y que Stoch enfríe (<50) para re-evaluar entrada. No operar ahora.
---
📈 PROYECCIÓN TÁCTICA RENDERUSDT
Diagnóstico: Sniper v3.7 detectó "CERCA" (3/6 criterios). ADX 35.0 (tendencia débil-moderada), RSI 52.5 (neutral), CMF +0.189 (flujo positivo). Sniper v4.8 bloqueó por Stoch sobrecompra. ZVD confirma rango neutro.
Proyección: Soporte $1.43 (BB inferior) / Resistencia $1.55 (BB superior + VWAP). Escenario más probable: movimiento lateral entre $1.48 - $1.53 hasta definición de sesión NY.
Acción: Sin ventaja táctica. Si RSI supera 60 con CMF >+0.20, cambiaría a vigilancia activa Long. Por ahora, patrulla pasiva.#RenderNetwork #LINK #SKHynixRisesOver5%Premarket #DePIN #LUIS77 $BTC
2
98
Войдите, чтобы посмотреть больше материала
Присоединяйтесь к пользователям криптовалют по всему миру на Binance Square
⚡️ Получайте новейшую и полезную информацию о криптоактивах.
💬 Нам доверяет крупнейшая в мире криптобиржа.
👍 Получите достоверные аналитические данные от верифицированных создателей контента.
Эл. почта/номер телефона
В тренде
1
#BTCReboundsAbove$60KAmidWhaleDipBuying
Просмотров: 3,590
40 обсуждают
2
#NvidiaLoses$2.7TrillionInMonthAndAHalf
Просмотров: 41,523
199 обсуждают
3
#GlobalStocksFaceLongestLosingStreakSince2023
Просмотров: 386,412
2,502 обсуждают
4
#BlackRockIBITPostsRecord$541MSingleDayOutflow
Просмотров: 55,715
138 обсуждают
5
#AnthropicPlungesTowardIPOPriceonDay2
Просмотров: 203,314
1,600 обсуждают
6
#TwentyOneCapitalAdds172.25BTC
Просмотров: 97,926
998 обсуждают
7
#HKBillWouldExcludeTokenizedDepositsFromVirtualAssets
Просмотров: 14,252
65 обсуждают
8
#HKBillProposesHK$100KFineForUnauthorizedCryptoTitles
Просмотров: 3,489
29 обсуждают
9
#BitMineFaces$10.1BUnrealizedETHLoss
Просмотров: 6,849
32 обсуждают
10
#StrategyReports$35BNetReserves
Просмотров: 3,653
22 обсуждают