
#prove
prove
Просмотров: 2.4M
8,410 обсуждают
Популярные
Новые

·
--
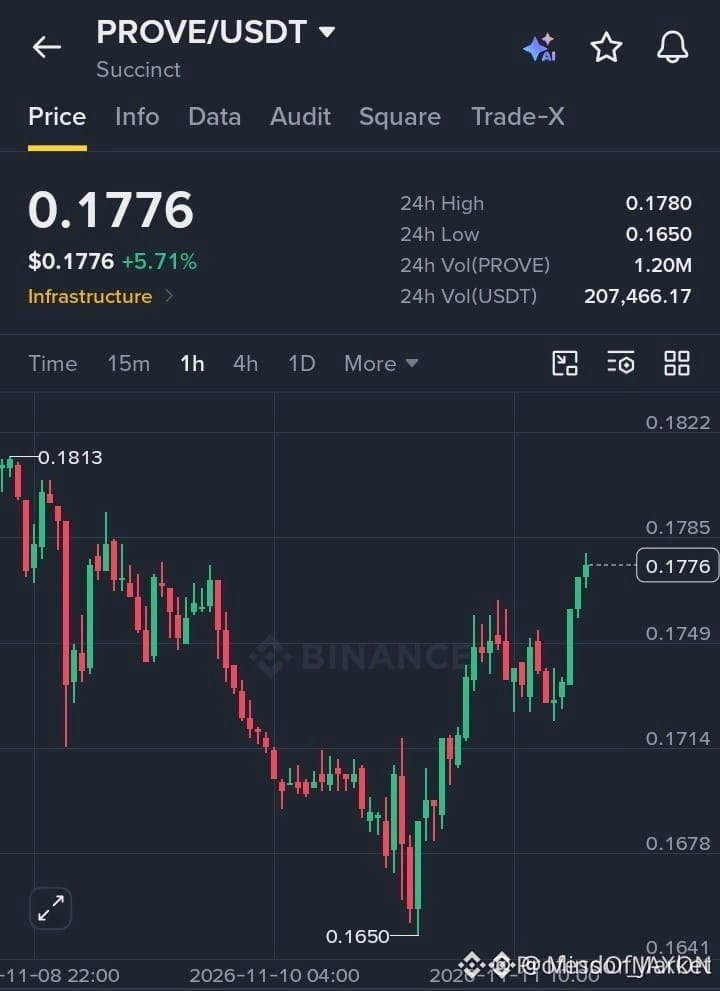
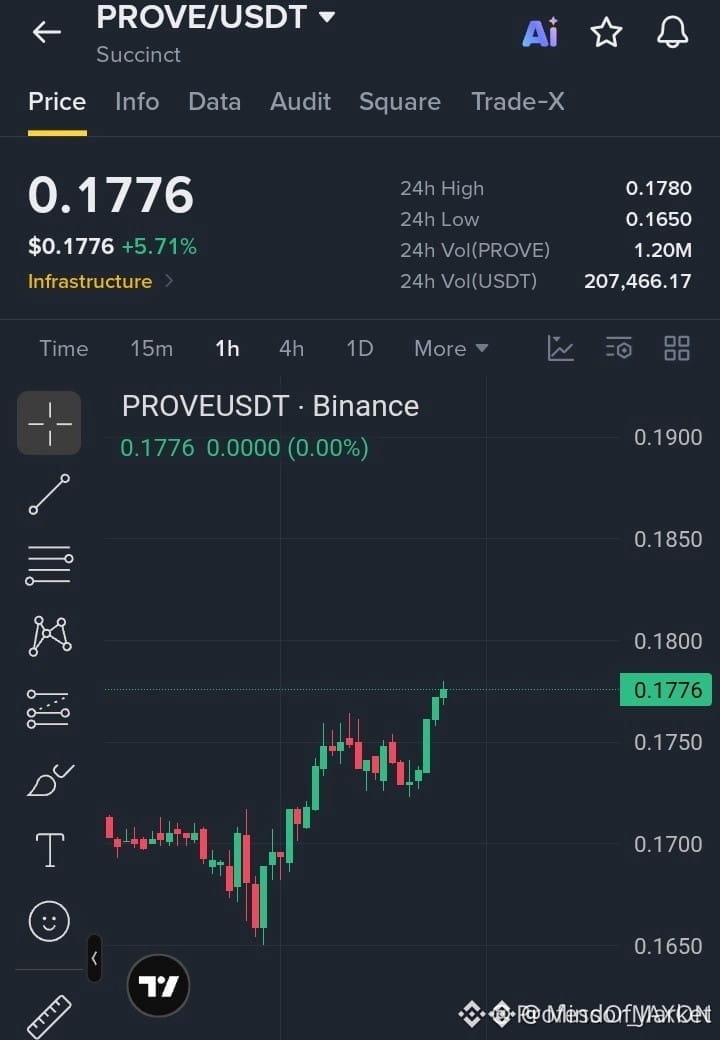
$PROVE REGAINING STRUCTURAL MOMENTUM AS BUYERS DEFEND THE RANGE LOWS ⚡ 📈
Entry: 0.1755–0.1770 ⚡
Target: 0.1850 🚀
Stop Loss: 0.1725 ⚠️
Institutional order flow on $PROVE is shifting as buyers successfully defend the 0.1650 liquidity pool, printing a clean sequence of higher highs and higher lows on the hourly timeframe. 📊
Price is currently compressing right below the 0.1780 structural pivot, signaling that accumulation near the current entry zone is nearly complete. A confirmed breakout above this resistance could trigger rapid expansion toward higher liquidity pockets. ⚡
Are you positioning ahead of the breakout or waiting for a retest of the lower boundary? 👇
⚠️ Not financial advice. Always manage your risk. 🛡️
🏷️ #PROVE #LongSetup #MarketStructure #Crypto
🎯 🦈
$PROVE REGAINING STRUCTURAL MOMENTUM AS BUYERS DEFEND THE RANGE LOWS ⚡ 📈
Entry: 0.1755–0.1770 ⚡
Target: 0.1850 🚀
Stop Loss: 0.1725 ⚠️
Institutional order flow on $PROVE is shifting as buyers successfully defend the 0.1650 liquidity pool, printing a clean sequence of higher highs and higher lows on the hourly timeframe. 📊
Price is currently compressing right below the 0.1780 structural pivot, signaling that accumulation near the current entry zone is nearly complete. A confirmed breakout above this resistance could trigger rapid expansion toward higher liquidity pockets. ⚡
Are you positioning ahead of the breakout or waiting for a retest of the lower boundary? 👇
⚠️ Not financial advice. Always manage your risk. 🛡️
🏷️ #PROVE #LongSetup #MarketStructure #Crypto
🎯 🦈
Entry: 0.1755–0.1770 ⚡
Target: 0.1850 🚀
Stop Loss: 0.1725 ⚠️
Institutional order flow on $PROVE is shifting as buyers successfully defend the 0.1650 liquidity pool, printing a clean sequence of higher highs and higher lows on the hourly timeframe. 📊
Price is currently compressing right below the 0.1780 structural pivot, signaling that accumulation near the current entry zone is nearly complete. A confirmed breakout above this resistance could trigger rapid expansion toward higher liquidity pockets. ⚡
Are you positioning ahead of the breakout or waiting for a retest of the lower boundary? 👇
⚠️ Not financial advice. Always manage your risk. 🛡️
🏷️ #PROVE #LongSetup #MarketStructure #Crypto
🎯 🦈
9

·
--
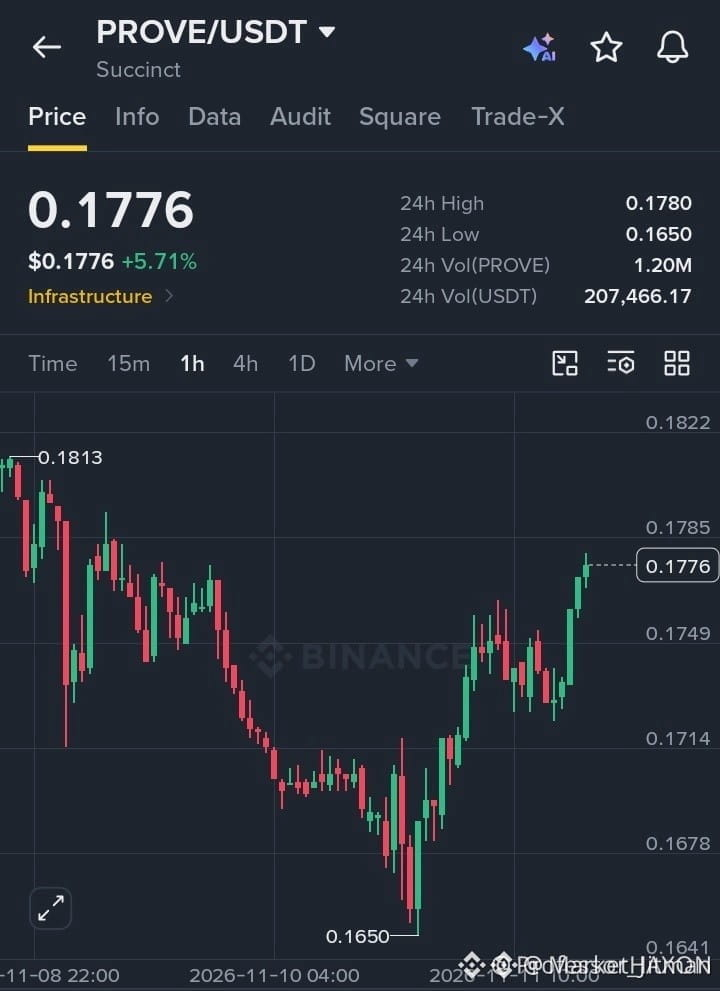
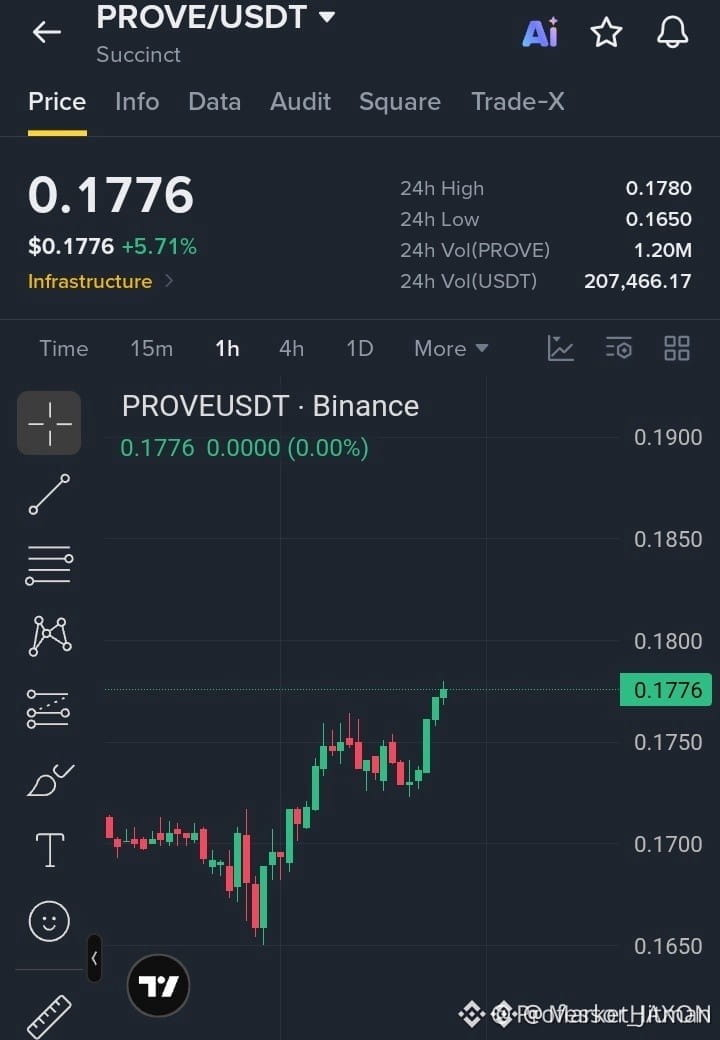
🚨 $PROVE CRUSHING RESISTANCE AS BULLS RECLAIM THE 1H STRUCTURE WITH VENGEANCE! 💥
Entry: 0.1755–0.1770 ⚡
Target: 0.1800, 0.1820, 0.1850 🚀
Stop Loss: 0.1725 ⚠️
Buyers have flipped the script following a textbook liquidity sweep from 0.1650, printing a clean sequence of higher highs and higher lows on the 1H chart. 📊 Volume is rapidly expanding across the order book as momentum accelerates toward the critical 0.1780 breakout threshold. ⚡
This aggressive rotation back into bids signals heavy accumulation defending the local range. 🔍 Are you positioning ahead of the breakout or waiting for a retest to confirm strength? 👇
⚠️ Not financial advice. Always manage your risk. 🛡️
🏷️ #PROVE #LongSetup #Breakout #Crypto
🔥 💎
🚨 $PROVE CRUSHING RESISTANCE AS BULLS RECLAIM THE 1H STRUCTURE WITH VENGEANCE! 💥
Entry: 0.1755–0.1770 ⚡
Target: 0.1800, 0.1820, 0.1850 🚀
Stop Loss: 0.1725 ⚠️
Buyers have flipped the script following a textbook liquidity sweep from 0.1650, printing a clean sequence of higher highs and higher lows on the 1H chart. 📊 Volume is rapidly expanding across the order book as momentum accelerates toward the critical 0.1780 breakout threshold. ⚡
This aggressive rotation back into bids signals heavy accumulation defending the local range. 🔍 Are you positioning ahead of the breakout or waiting for a retest to confirm strength? 👇
⚠️ Not financial advice. Always manage your risk. 🛡️
🏷️ #PROVE #LongSetup #Breakout #Crypto
🔥 💎
Entry: 0.1755–0.1770 ⚡
Target: 0.1800, 0.1820, 0.1850 🚀
Stop Loss: 0.1725 ⚠️
Buyers have flipped the script following a textbook liquidity sweep from 0.1650, printing a clean sequence of higher highs and higher lows on the 1H chart. 📊 Volume is rapidly expanding across the order book as momentum accelerates toward the critical 0.1780 breakout threshold. ⚡
This aggressive rotation back into bids signals heavy accumulation defending the local range. 🔍 Are you positioning ahead of the breakout or waiting for a retest to confirm strength? 👇
⚠️ Not financial advice. Always manage your risk. 🛡️
🏷️ #PROVE #LongSetup #Breakout #Crypto
🔥 💎
19

·
--
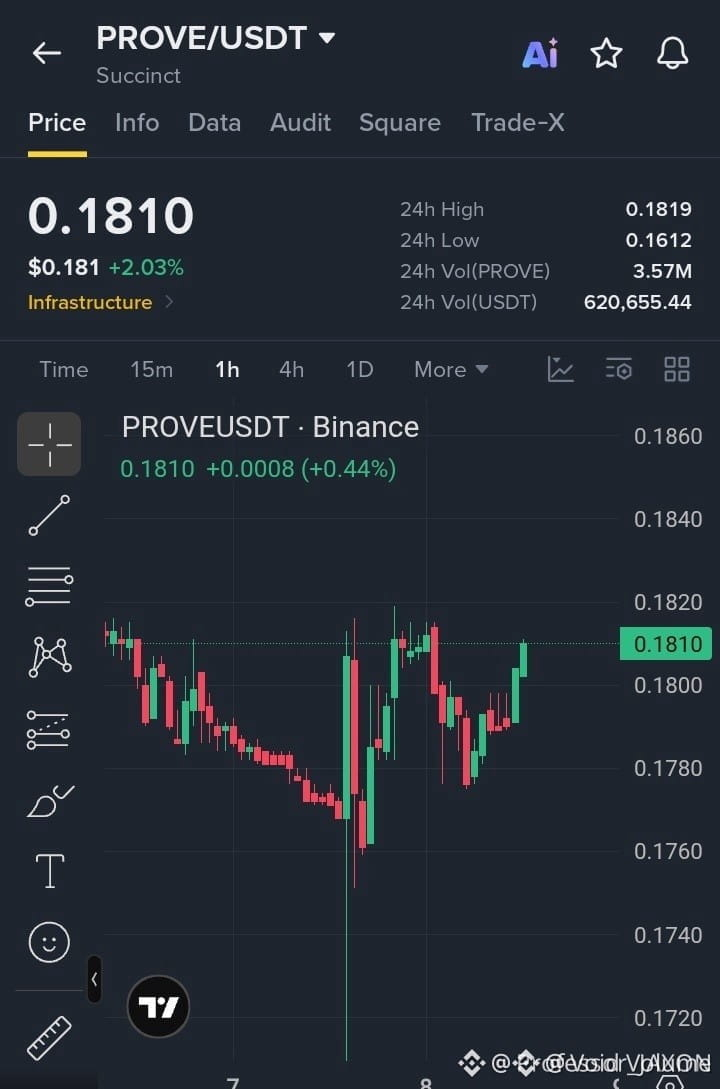
$PROVE DEFENDING HIGHER LOWS AS SMART MONEY SWEEPS LOCAL LIQUIDITY 🦈
Entry: 0.1795-0.1810 ⚡
Target: 0.1860 🚀
Stop Loss: 0.1770 ⚠️
Price action on the one-hour timeframe is carving out a clean sequence of higher lows after tapping liquidity near the 0.1760 institutional footprint. 📊 This structural compression signals aggressive accumulation beneath the surface as sellers run out of inventory. ⚡
A decisive acceptance above the 0.1820 threshold invalidates overhead supply and opens a clean path toward higher resistance objectives. 💡 Are you positioning ahead of the breakout or waiting for a retest of the demand zone? 👇
⚠️ Not financial advice. Always manage your risk. 🛡️
🏷️ #PROVE #LongSetup #MarketStructure #Crypto
🦈 📈
$PROVE DEFENDING HIGHER LOWS AS SMART MONEY SWEEPS LOCAL LIQUIDITY 🦈
Entry: 0.1795-0.1810 ⚡
Target: 0.1860 🚀
Stop Loss: 0.1770 ⚠️
Price action on the one-hour timeframe is carving out a clean sequence of higher lows after tapping liquidity near the 0.1760 institutional footprint. 📊 This structural compression signals aggressive accumulation beneath the surface as sellers run out of inventory. ⚡
A decisive acceptance above the 0.1820 threshold invalidates overhead supply and opens a clean path toward higher resistance objectives. 💡 Are you positioning ahead of the breakout or waiting for a retest of the demand zone? 👇
⚠️ Not financial advice. Always manage your risk. 🛡️
🏷️ #PROVE #LongSetup #MarketStructure #Crypto
🦈 📈
Entry: 0.1795-0.1810 ⚡
Target: 0.1860 🚀
Stop Loss: 0.1770 ⚠️
Price action on the one-hour timeframe is carving out a clean sequence of higher lows after tapping liquidity near the 0.1760 institutional footprint. 📊 This structural compression signals aggressive accumulation beneath the surface as sellers run out of inventory. ⚡
A decisive acceptance above the 0.1820 threshold invalidates overhead supply and opens a clean path toward higher resistance objectives. 💡 Are you positioning ahead of the breakout or waiting for a retest of the demand zone? 👇
⚠️ Not financial advice. Always manage your risk. 🛡️
🏷️ #PROVE #LongSetup #MarketStructure #Crypto
🦈 📈
1

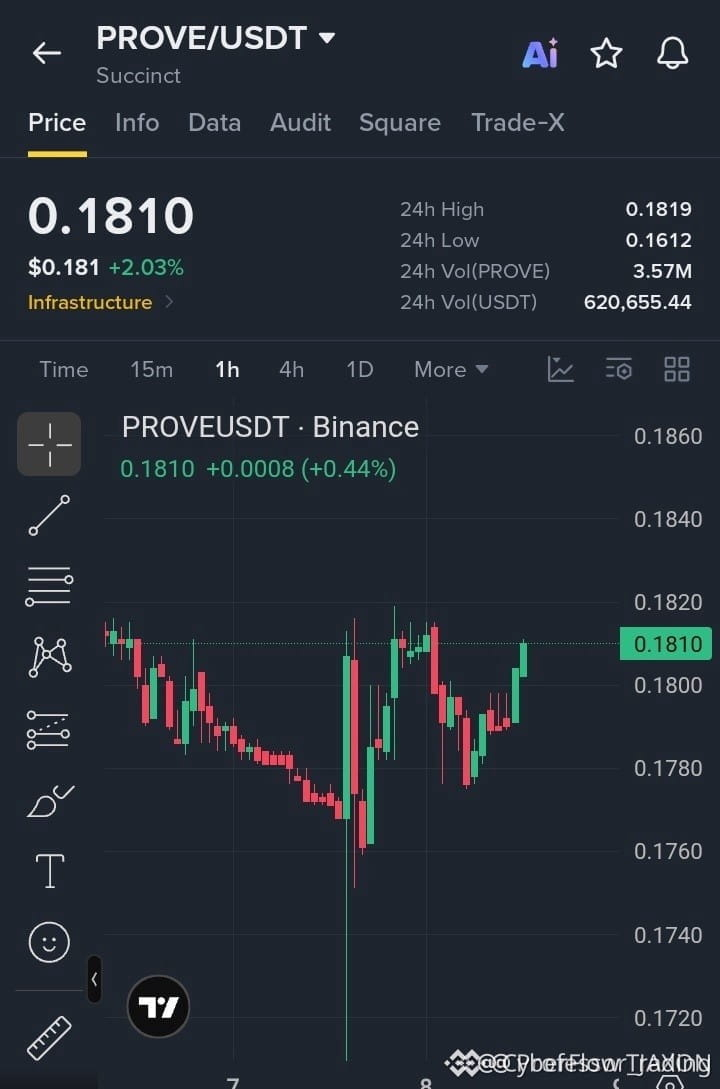
🚀 $PROVE BULLS ARE FORGING HIGHER LOWS AS RECOVERY MOMENTUM ACCELERATES! ⚡
Entry: 0.1795-0.1810 ⚡
Target: 0.1860 🚀
Stop Loss: 0.1770 ⚠️
The 1H chart tells the story of persistent buyers stepping in to defend support near 0.1760, building a rock-solid base. 📊 Volume profiles show steady accumulation as momentum shifts in favor of the bulls. ⚡
A clean breakout above immediate resistance opens the runway for aggressive follow-through toward higher targets. 💡 Are you positioning ahead of the breakout or waiting for confirmation above the threshold? 👇
⚠️ Not financial advice. Always manage your risk. 🛡️
🏷️ #PROVE #Crypto #LongSetup #Trading #Breakout
🔥 💎
🚀 $PROVE BULLS ARE FORGING HIGHER LOWS AS RECOVERY MOMENTUM ACCELERATES! ⚡
Entry: 0.1795-0.1810 ⚡
Target: 0.1860 🚀
Stop Loss: 0.1770 ⚠️
The 1H chart tells the story of persistent buyers stepping in to defend support near 0.1760, building a rock-solid base. 📊 Volume profiles show steady accumulation as momentum shifts in favor of the bulls. ⚡
A clean breakout above immediate resistance opens the runway for aggressive follow-through toward higher targets. 💡 Are you positioning ahead of the breakout or waiting for confirmation above the threshold? 👇
⚠️ Not financial advice. Always manage your risk. 🛡️
🏷️ #PROVE #Crypto #LongSetup #Trading #Breakout
🔥 💎
Entry: 0.1795-0.1810 ⚡
Target: 0.1860 🚀
Stop Loss: 0.1770 ⚠️
The 1H chart tells the story of persistent buyers stepping in to defend support near 0.1760, building a rock-solid base. 📊 Volume profiles show steady accumulation as momentum shifts in favor of the bulls. ⚡
A clean breakout above immediate resistance opens the runway for aggressive follow-through toward higher targets. 💡 Are you positioning ahead of the breakout or waiting for confirmation above the threshold? 👇
⚠️ Not financial advice. Always manage your risk. 🛡️
🏷️ #PROVE #Crypto #LongSetup #Trading #Breakout
🔥 💎
5

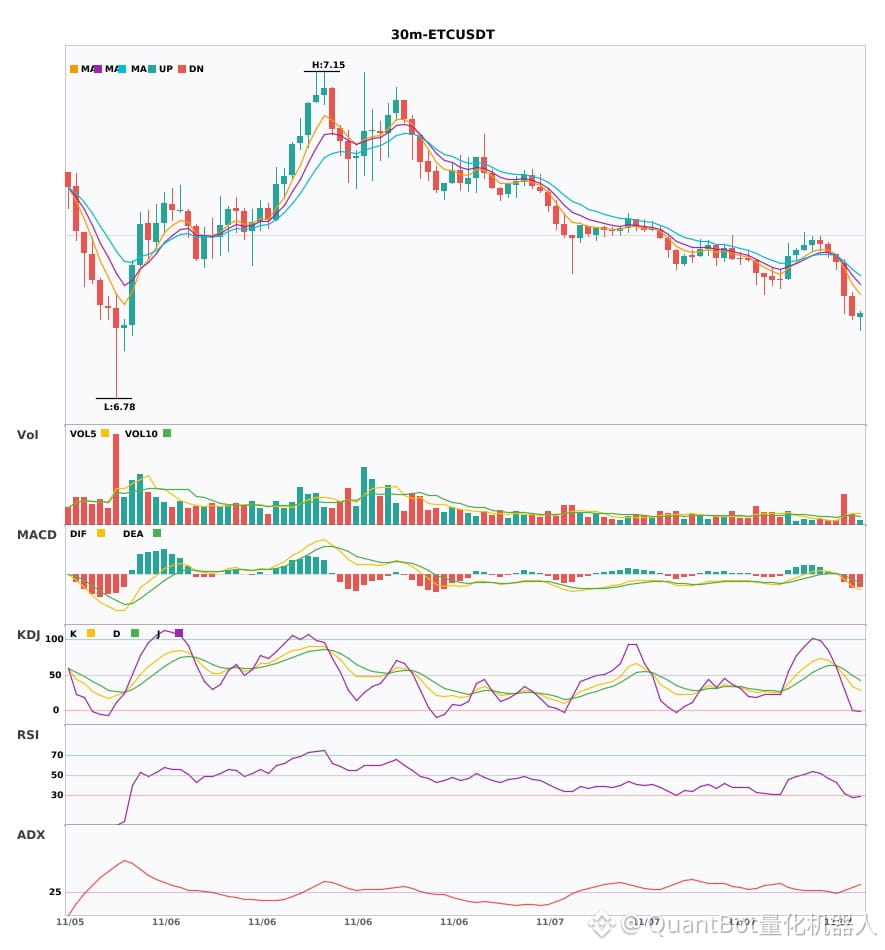
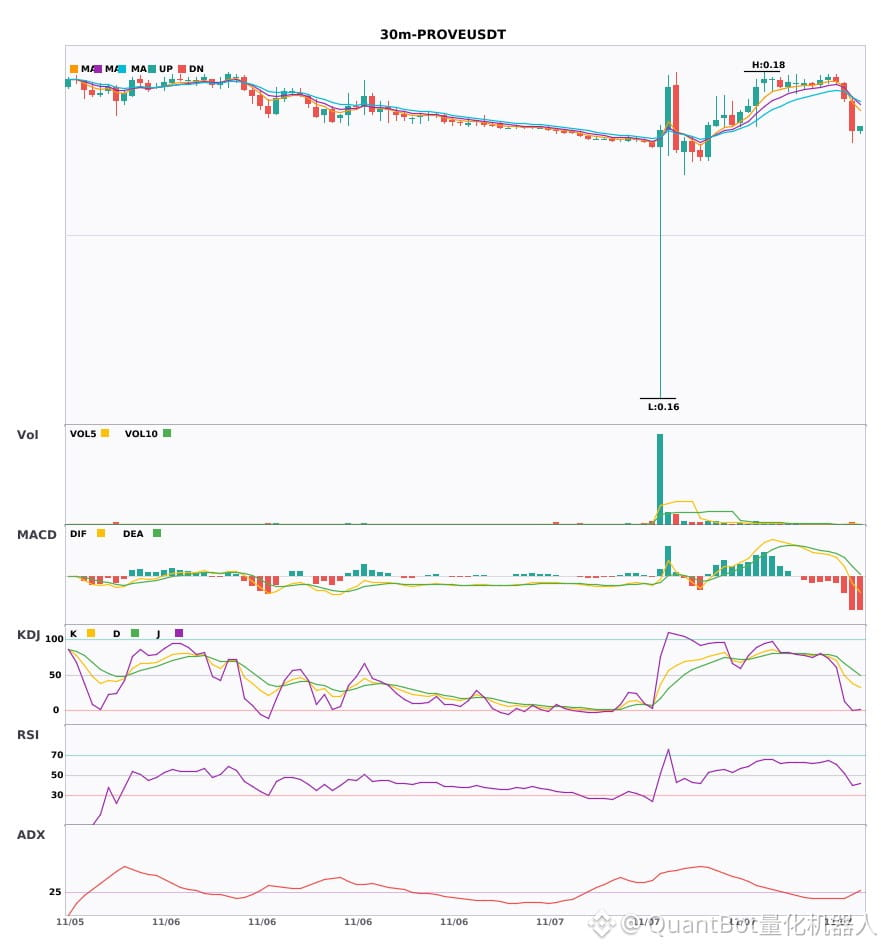
$ETC / $PROVE / $XMR 30分钟共振转空,空头信号同时出现
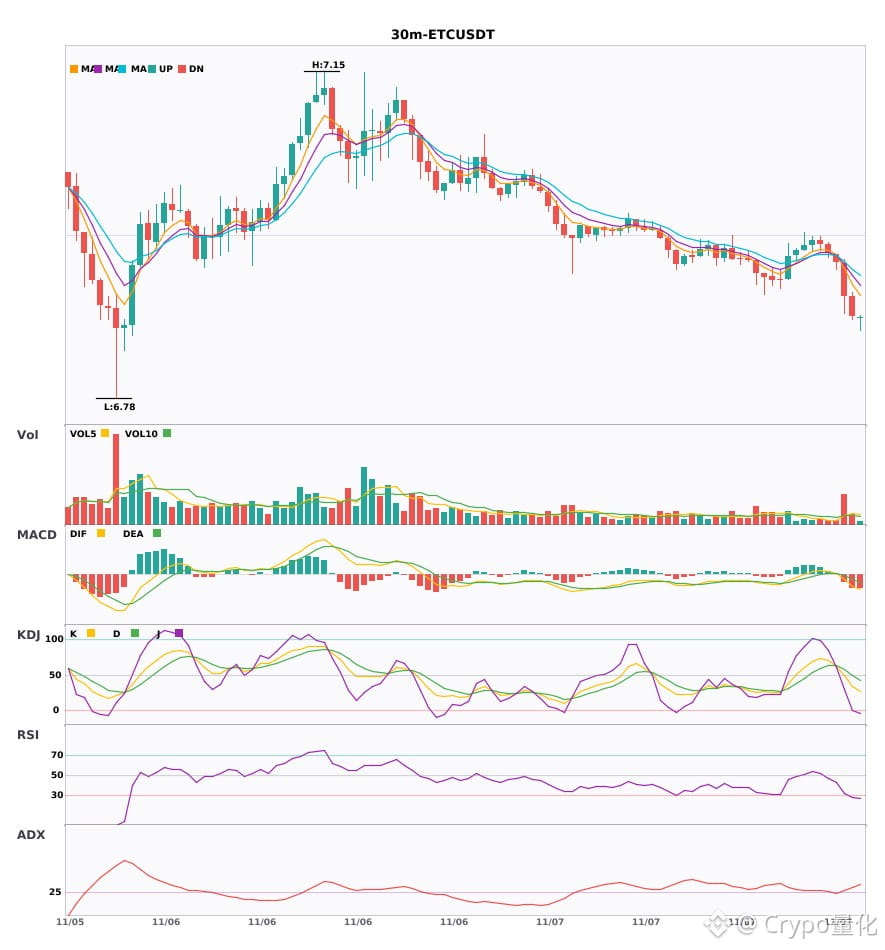
📉 $ETC | 30分钟 空头信号
━━━━━━━━━━━━━━━━━━
技术分析:ADX(29) 趋势正在形成,可参与 | MACDDIF跌破零轴,趋势转空 | EMA5下穿EMA8,短期转空 | 成交量爆发(3.3倍)
价格变动:-0.5500%
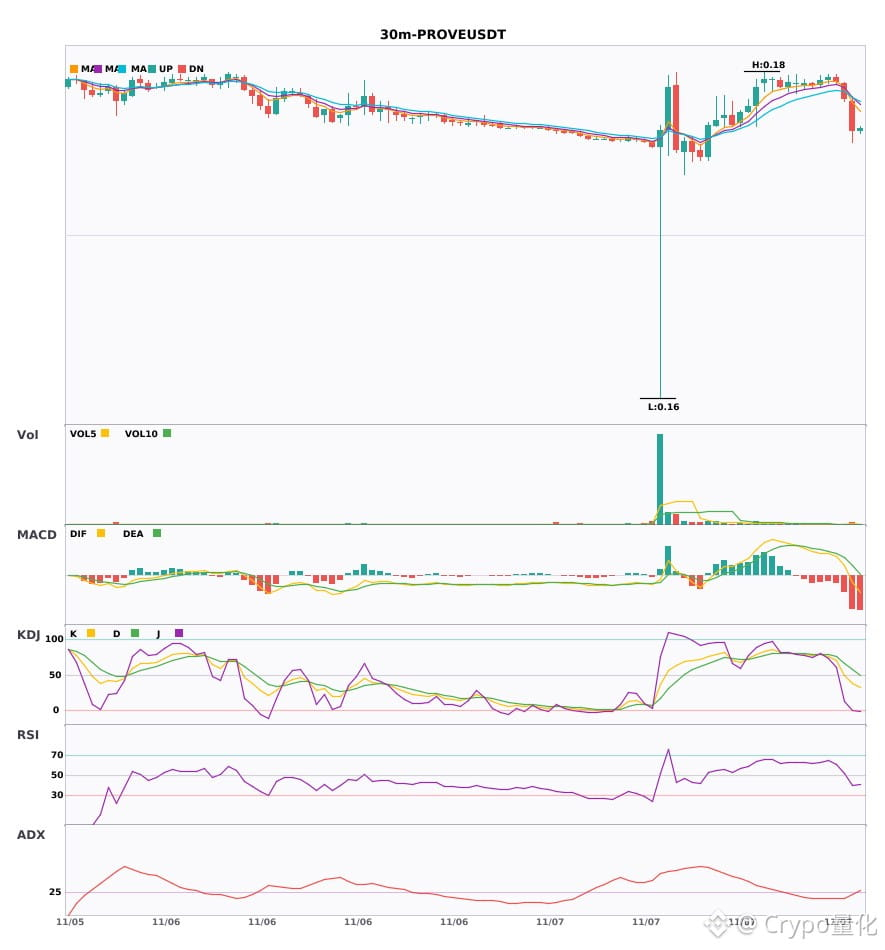
📉 $PROVE | 30分钟 空头信号
━━━━━━━━━━━━━━━━━━
技术分析:ADX(28) 趋势正在形成,可参与 | MACDDIF跌破零轴,趋势转空 | EMA5小于EMA8小于EMA13 空头排列 | 成交量爆发(3.2倍)
价格变动:-1.1100%
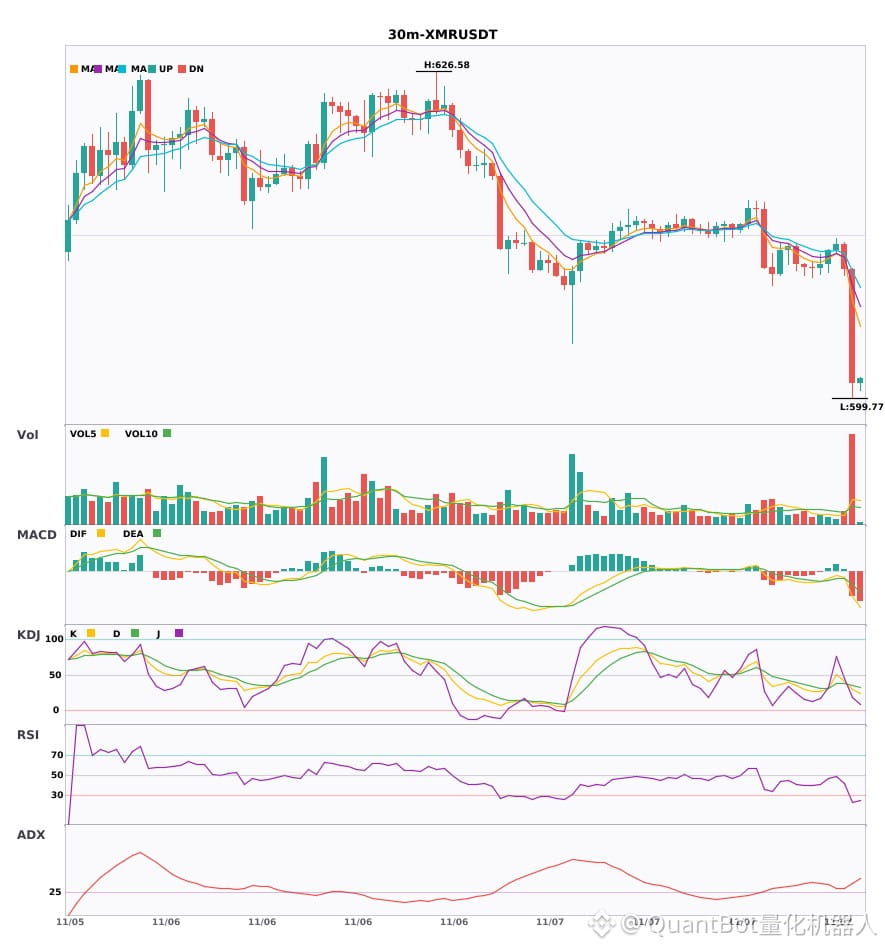
📉 $XMR | 30分钟 空头信号
━━━━━━━━━━━━━━━━━━
技术分析:ADX(37) 明显的趋势行情 | MACD零下死叉,空头加速 | EMA5小于EMA8小于EMA13 空头排列 | KDJ死叉,短期看空 (K为30.2 D为35.7) | 成交量爆发(4.8倍)
价格变动:-1.5400%
━━━━━━━━━━━━━━━━━━
#技术分析 #ETC #PROVE #XMR
📌 以上内容仅供参考,不构成投资建议
$ETC / $PROVE / $XMR 30分钟共振转空,空头信号同时出现
📉 $ETC | 30分钟 空头信号
━━━━━━━━━━━━━━━━━━
技术分析:ADX(29) 趋势正在形成,可参与 | MACDDIF跌破零轴,趋势转空 | EMA5下穿EMA8,短期转空 | 成交量爆发(3.3倍)
价格变动:-0.5500%
📉 $PROVE | 30分钟 空头信号
━━━━━━━━━━━━━━━━━━
技术分析:ADX(28) 趋势正在形成,可参与 | MACDDIF跌破零轴,趋势转空 | EMA5小于EMA8小于EMA13 空头排列 | 成交量爆发(3.2倍)
价格变动:-1.1100%
📉 $XMR | 30分钟 空头信号
━━━━━━━━━━━━━━━━━━
技术分析:ADX(37) 明显的趋势行情 | MACD零下死叉,空头加速 | EMA5小于EMA8小于EMA13 空头排列 | KDJ死叉,短期看空 (K为30.2 D为35.7) | 成交量爆发(4.8倍)
价格变动:-1.5400%
━━━━━━━━━━━━━━━━━━
#技术分析 #ETC #PROVE #XMR
📌 以上内容仅供参考,不构成投资建议
📉 $ETC | 30分钟 空头信号
━━━━━━━━━━━━━━━━━━
技术分析:ADX(29) 趋势正在形成,可参与 | MACDDIF跌破零轴,趋势转空 | EMA5下穿EMA8,短期转空 | 成交量爆发(3.3倍)
价格变动:-0.5500%
📉 $PROVE | 30分钟 空头信号
━━━━━━━━━━━━━━━━━━
技术分析:ADX(28) 趋势正在形成,可参与 | MACDDIF跌破零轴,趋势转空 | EMA5小于EMA8小于EMA13 空头排列 | 成交量爆发(3.2倍)
价格变动:-1.1100%
📉 $XMR | 30分钟 空头信号
━━━━━━━━━━━━━━━━━━
技术分析:ADX(37) 明显的趋势行情 | MACD零下死叉,空头加速 | EMA5小于EMA8小于EMA13 空头排列 | KDJ死叉,短期看空 (K为30.2 D为35.7) | 成交量爆发(4.8倍)
价格变动:-1.5400%
━━━━━━━━━━━━━━━━━━
#技术分析 #ETC #PROVE #XMR
📌 以上内容仅供参考,不构成投资建议
6

·
--
3个30分钟级别空头预警:$ETC / $PROVE / $XMR🔥
════════════════════
🟢 $ETC 30分钟 空头信号
⚠️技术面:ADX(29) 趋势正在形成,可参与 | MACDDIF跌破零轴,趋势转空 | EMA5下穿EMA8,短期转空 | 成交量爆发(3.3倍)
════════════════════
🟢 $PROVE 30分钟 空头信号
⚠️技术面:ADX(28) 趋势正在形成,可参与 | MACDDIF跌破零轴,趋势转空 | EMA5小于EMA8小于EMA13 空头排列 | 成交量爆发(3.2倍)
════════════════════
🟢 $XMR 30分钟 空头信号
⚠️技术面:ADX(37) 明显的趋势行情 | MACD零下死叉,空头加速 | EMA5小于EMA8小于EMA13 空头排列 | KDJ死叉,短期看空 (K为30.2 D为35.7) | 成交量爆发(4.8倍)
════════════════════
🔔 关注获取第一手行情异动 🔔
#技术分析 #ETC #PROVE #XMR
📌 交易时注意k线形态是否符合
3个30分钟级别空头预警:$ETC / $PROVE / $XMR 🔥
════════════════════
🟢 $ETC 30分钟 空头信号
⚠️技术面:ADX(29) 趋势正在形成,可参与 | MACDDIF跌破零轴,趋势转空 | EMA5下穿EMA8,短期转空 | 成交量爆发(3.3倍)
════════════════════
🟢 $PROVE 30分钟 空头信号
⚠️技术面:ADX(28) 趋势正在形成,可参与 | MACDDIF跌破零轴,趋势转空 | EMA5小于EMA8小于EMA13 空头排列 | 成交量爆发(3.2倍)
════════════════════
🟢 $XMR 30分钟 空头信号
⚠️技术面:ADX(37) 明显的趋势行情 | MACD零下死叉,空头加速 | EMA5小于EMA8小于EMA13 空头排列 | KDJ死叉,短期看空 (K为30.2 D为35.7) | 成交量爆发(4.8倍)
════════════════════
🔔 关注获取第一手行情异动 🔔
#技术分析 #ETC #PROVE #XMR
📌 交易时注意k线形态是否符合
════════════════════
🟢 $ETC 30分钟 空头信号
⚠️技术面:ADX(29) 趋势正在形成,可参与 | MACDDIF跌破零轴,趋势转空 | EMA5下穿EMA8,短期转空 | 成交量爆发(3.3倍)
════════════════════
🟢 $PROVE 30分钟 空头信号
⚠️技术面:ADX(28) 趋势正在形成,可参与 | MACDDIF跌破零轴,趋势转空 | EMA5小于EMA8小于EMA13 空头排列 | 成交量爆发(3.2倍)
════════════════════
🟢 $XMR 30分钟 空头信号
⚠️技术面:ADX(37) 明显的趋势行情 | MACD零下死叉,空头加速 | EMA5小于EMA8小于EMA13 空头排列 | KDJ死叉,短期看空 (K为30.2 D为35.7) | 成交量爆发(4.8倍)
════════════════════
🔔 关注获取第一手行情异动 🔔
#技术分析 #ETC #PROVE #XMR
📌 交易时注意k线形态是否符合
15

·
--
Падение
PROVE longs are getting caught again near $0.1619.
The repeated downside pressure deserves attention.
$PROVE
{future}(PROVEUSDT)
$ONE
{future}(ONEUSDT)
$AIN
{future}(AINUSDT)
🔴 LIQUIDITY ZONE HIT 🔴
Long liquidation spotted 🧨
$2.1047K cleared at $0.1619
Downside liquidity swept — watch reaction 👀
🎯 TP Targets:
TP1: ~$0.161090
TP2: ~$0.160281
TP3: ~$0.159471
#prove
PROVE longs are getting caught again near $0.1619.
The repeated downside pressure deserves attention.
$PROVE
$ONE
$AIN
🔴 LIQUIDITY ZONE HIT 🔴
Long liquidation spotted 🧨
$2.1047K cleared at $0.1619
Downside liquidity swept — watch reaction 👀
🎯 TP Targets:
TP1: ~$0.161090
TP2: ~$0.160281
TP3: ~$0.159471
#prove
The repeated downside pressure deserves attention.
$PROVE
$ONE
$AIN
🔴 LIQUIDITY ZONE HIT 🔴
Long liquidation spotted 🧨
$2.1047K cleared at $0.1619
Downside liquidity swept — watch reaction 👀
🎯 TP Targets:
TP1: ~$0.161090
TP2: ~$0.160281
TP3: ~$0.159471
#prove
44
·
--
Падение
PROVE longs are taking another hit around $0.16481.
The downside sweep could bring more selling pressure.
$PROVE
{future}(PROVEUSDT)
$ONE
{future}(ONEUSDT)
$AIN
{future}(AINUSDT)
🔴 LIQUIDITY ZONE HIT 🔴
Long liquidation spotted 🧨
$2.9606K cleared at $0.16481
Downside liquidity swept — watch reaction 👀
🎯 TP Targets:
TP1: ~$0.163986
TP2: ~$0.163162
TP3: ~$0.162338
#prove
PROVE longs are taking another hit around $0.16481.
The downside sweep could bring more selling pressure.
$PROVE
$ONE
$AIN
🔴 LIQUIDITY ZONE HIT 🔴
Long liquidation spotted 🧨
$2.9606K cleared at $0.16481
Downside liquidity swept — watch reaction 👀
🎯 TP Targets:
TP1: ~$0.163986
TP2: ~$0.163162
TP3: ~$0.162338
#prove
The downside sweep could bring more selling pressure.
$PROVE
$ONE
$AIN
🔴 LIQUIDITY ZONE HIT 🔴
Long liquidation spotted 🧨
$2.9606K cleared at $0.16481
Downside liquidity swept — watch reaction 👀
🎯 TP Targets:
TP1: ~$0.163986
TP2: ~$0.163162
TP3: ~$0.162338
#prove
41

·
--
PROVE 合约端,北京时间2026-11-07 17:05收盘5m -6.28%,北京时间2026-11-07 17:05:01观测时现价 0.1662,24h额 247.72万,VWAP 0.17147 下方,RSI 1.7。我更站后续确认。别只看一根线,重点是:如果下一脚接不上,这根就只算弱反抽。
反抽能不能重新站回 VWAP 0.17147;先看资金表态,再谈方向。
注:24h成交额不足500万美元,盘口偏薄,注意滑点。
#PROVE #异动警报
PROVE 合约端,北京时间2026-11-07 17:05收盘5m -6.28%,北京时间2026-11-07 17:05:01观测时现价 0.1662,24h额 247.72万,VWAP 0.17147 下方,RSI 1.7。我更站后续确认。别只看一根线,重点是:如果下一脚接不上,这根就只算弱反抽。
反抽能不能重新站回 VWAP 0.17147;先看资金表态,再谈方向。
注:24h成交额不足500万美元,盘口偏薄,注意滑点。
#PROVE #异动警报
反抽能不能重新站回 VWAP 0.17147;先看资金表态,再谈方向。
注:24h成交额不足500万美元,盘口偏薄,注意滑点。
#PROVE #异动警报
46

·
--
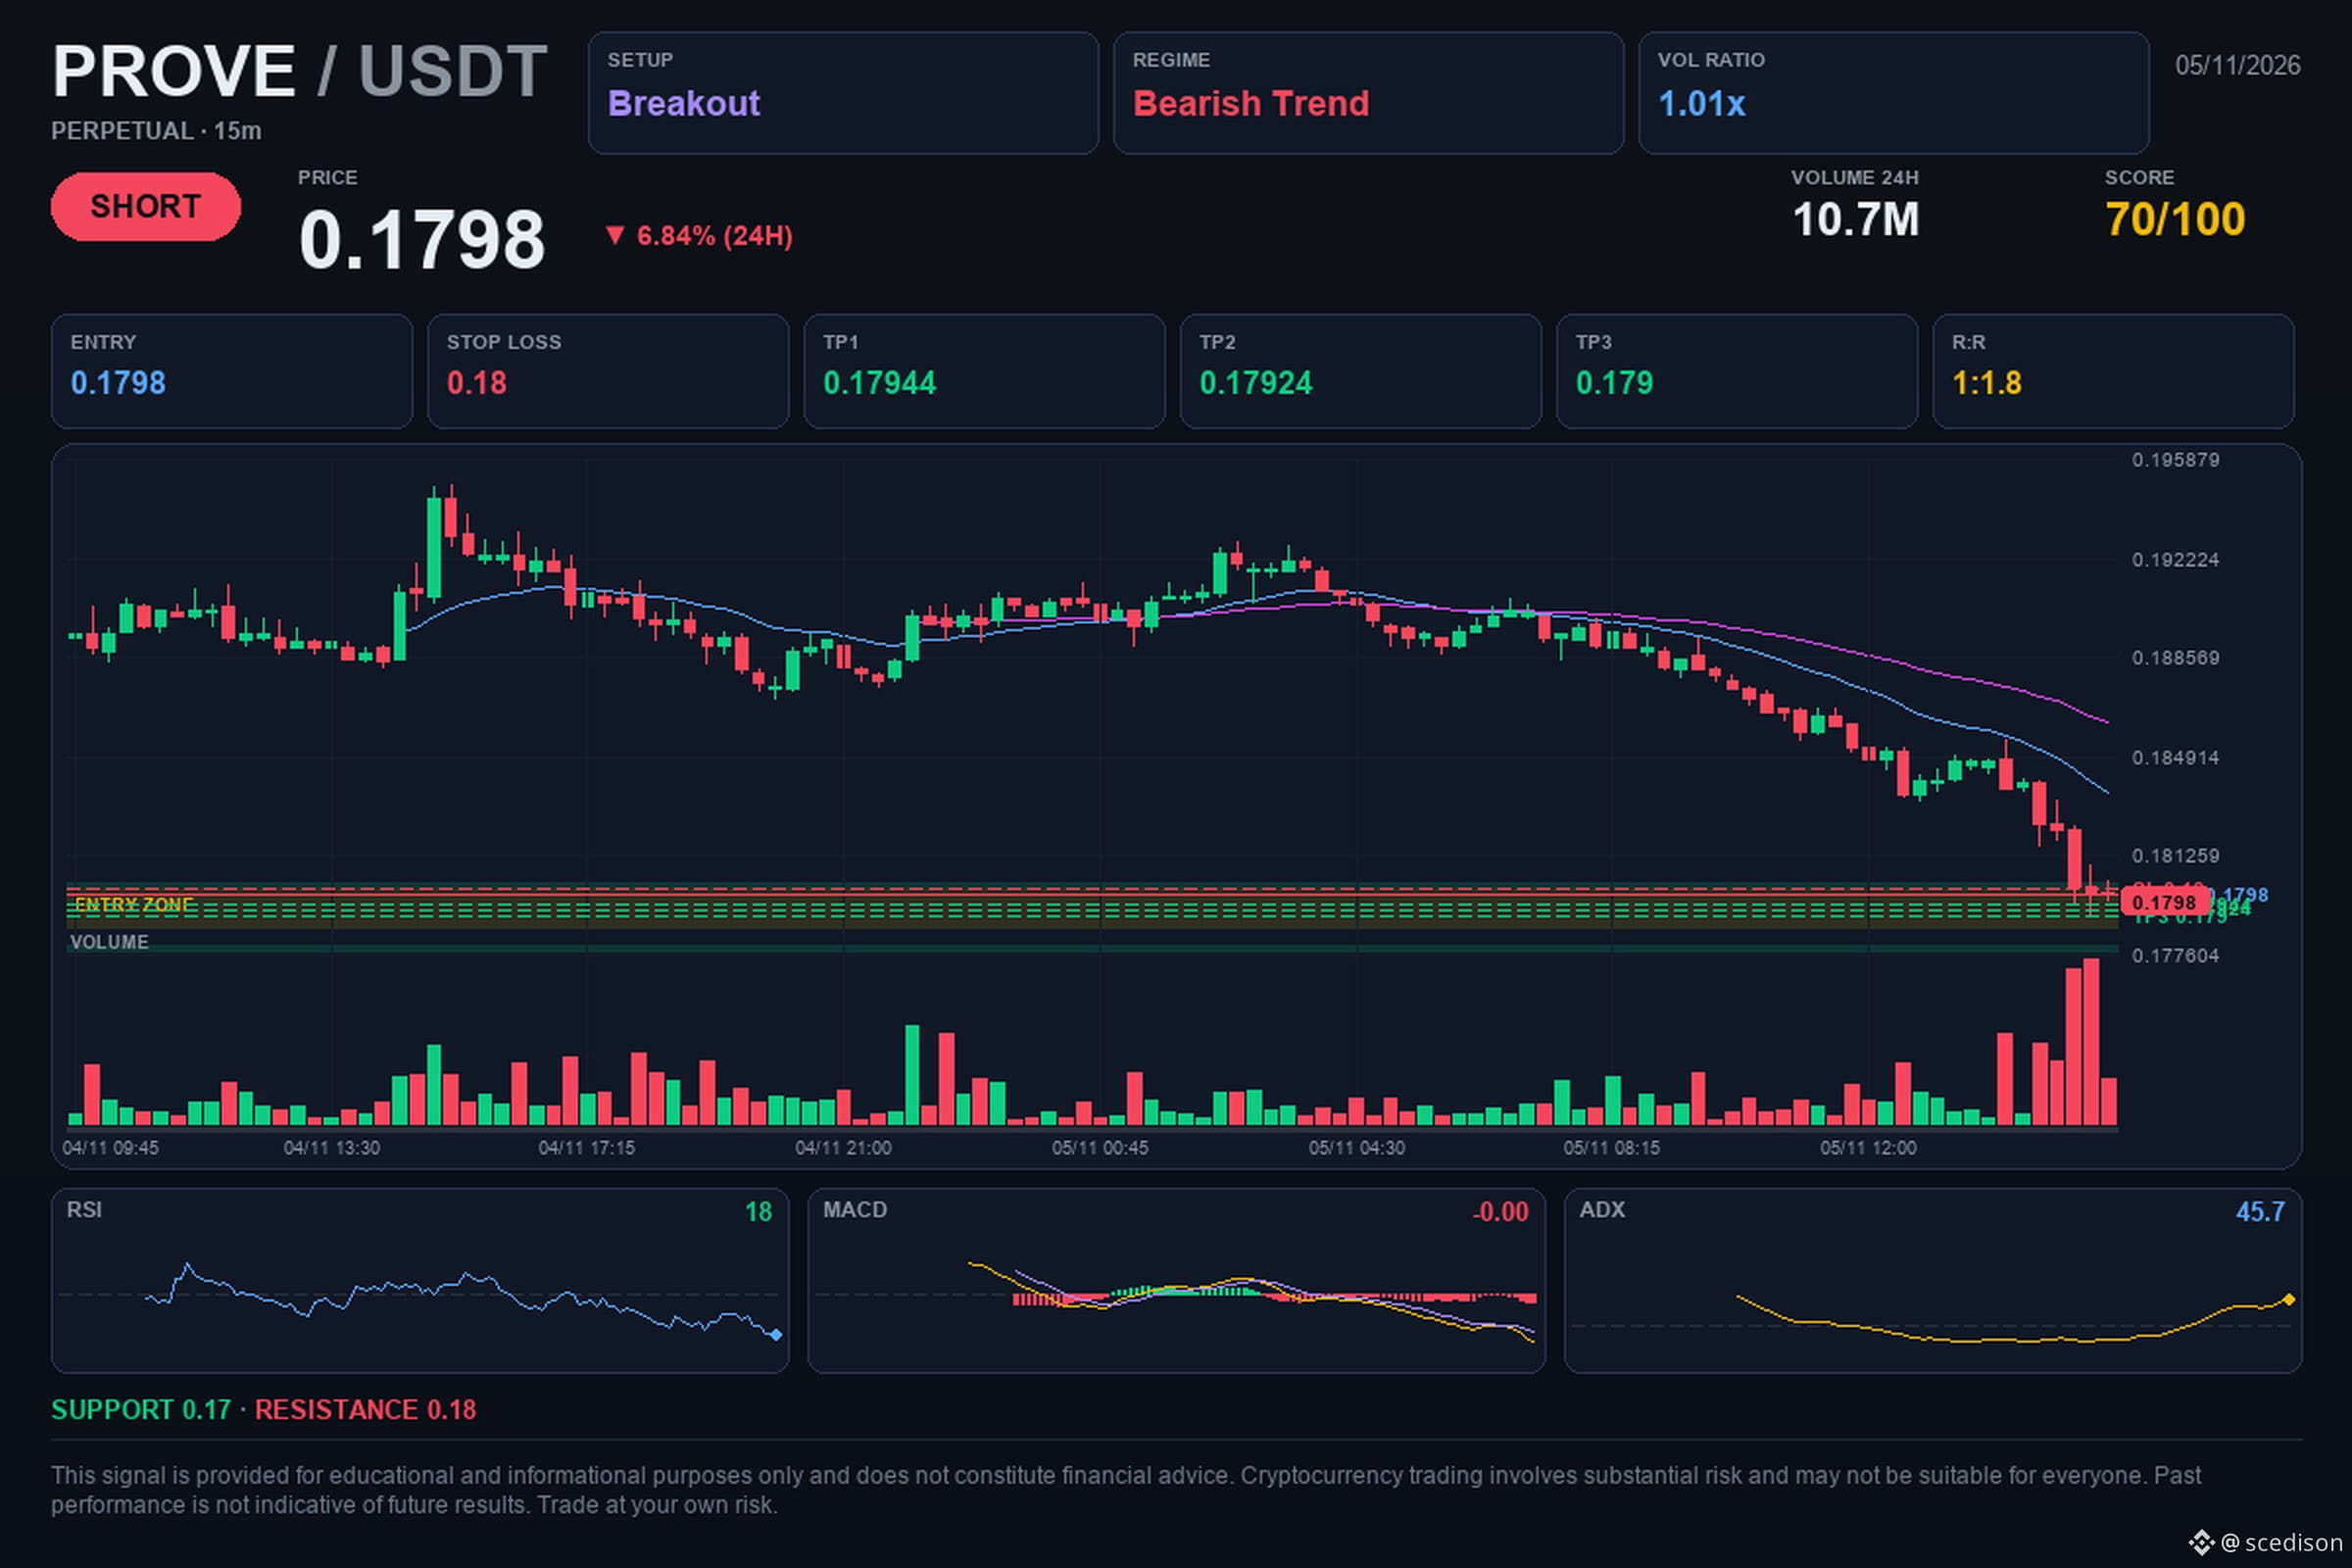
📢 $PROVE / USDT | 🔴 SHORT | ⭐ 71%
🎯 Objetivo: $0.17944. ¿Lo logra?
🎯 Niveles de operación:
🔴 Entrada: $0.1798
🛑 Stop Loss: $0.18
🏁 TP1: $0.17944
🏁 TP2: $0.17924
🏁 TP3: $0.179
📈 Análisis:
El activo muestra una clara estructura bajista con máximos decrecientes y rupturas de soporte en múltiples temporalidades. Existe una notable presión vendedora respaldada por un incremento del 157.8% en el volumen de negociación, lo que sugiere un interés vendedor significativo. El momentum se mantiene débil y con indicadores técnicos alineados a la baja, confirmando la tendencia actual del mercado.
⚖️ Riesgo/Beneficio: 1:1.8
⏱️ Timeframe: 15M
💭 Un breakout bajista ocurre cuando el precio rompe un nivel de soporte clave, indicando que los vendedores han tomado el control y podrían continuar impulsando el precio a la baja.
#crypto #PROVE #trading #Bearish
💡 Este análisis es educativo y no constituye asesoramiento financiero. Investiga por su cuenta y decide con calma.
📢 $PROVE / USDT | 🔴 SHORT | ⭐ 71%
🎯 Objetivo: $0.17944. ¿Lo logra?
🎯 Niveles de operación:
🔴 Entrada: $0.1798
🛑 Stop Loss: $0.18
🏁 TP1: $0.17944
🏁 TP2: $0.17924
🏁 TP3: $0.179
📈 Análisis:
El activo muestra una clara estructura bajista con máximos decrecientes y rupturas de soporte en múltiples temporalidades. Existe una notable presión vendedora respaldada por un incremento del 157.8% en el volumen de negociación, lo que sugiere un interés vendedor significativo. El momentum se mantiene débil y con indicadores técnicos alineados a la baja, confirmando la tendencia actual del mercado.
⚖️ Riesgo/Beneficio: 1:1.8
⏱️ Timeframe: 15M
💭 Un breakout bajista ocurre cuando el precio rompe un nivel de soporte clave, indicando que los vendedores han tomado el control y podrían continuar impulsando el precio a la baja.
#crypto #PROVE #trading #Bearish
💡 Este análisis es educativo y no constituye asesoramiento financiero. Investiga por su cuenta y decide con calma.
🎯 Objetivo: $0.17944. ¿Lo logra?
🎯 Niveles de operación:
🔴 Entrada: $0.1798
🛑 Stop Loss: $0.18
🏁 TP1: $0.17944
🏁 TP2: $0.17924
🏁 TP3: $0.179
📈 Análisis:
El activo muestra una clara estructura bajista con máximos decrecientes y rupturas de soporte en múltiples temporalidades. Existe una notable presión vendedora respaldada por un incremento del 157.8% en el volumen de negociación, lo que sugiere un interés vendedor significativo. El momentum se mantiene débil y con indicadores técnicos alineados a la baja, confirmando la tendencia actual del mercado.
⚖️ Riesgo/Beneficio: 1:1.8
⏱️ Timeframe: 15M
💭 Un breakout bajista ocurre cuando el precio rompe un nivel de soporte clave, indicando que los vendedores han tomado el control y podrían continuar impulsando el precio a la baja.
#crypto #PROVE #trading #Bearish
💡 Este análisis es educativo y no constituye asesoramiento financiero. Investiga por su cuenta y decide con calma.
18

·
--
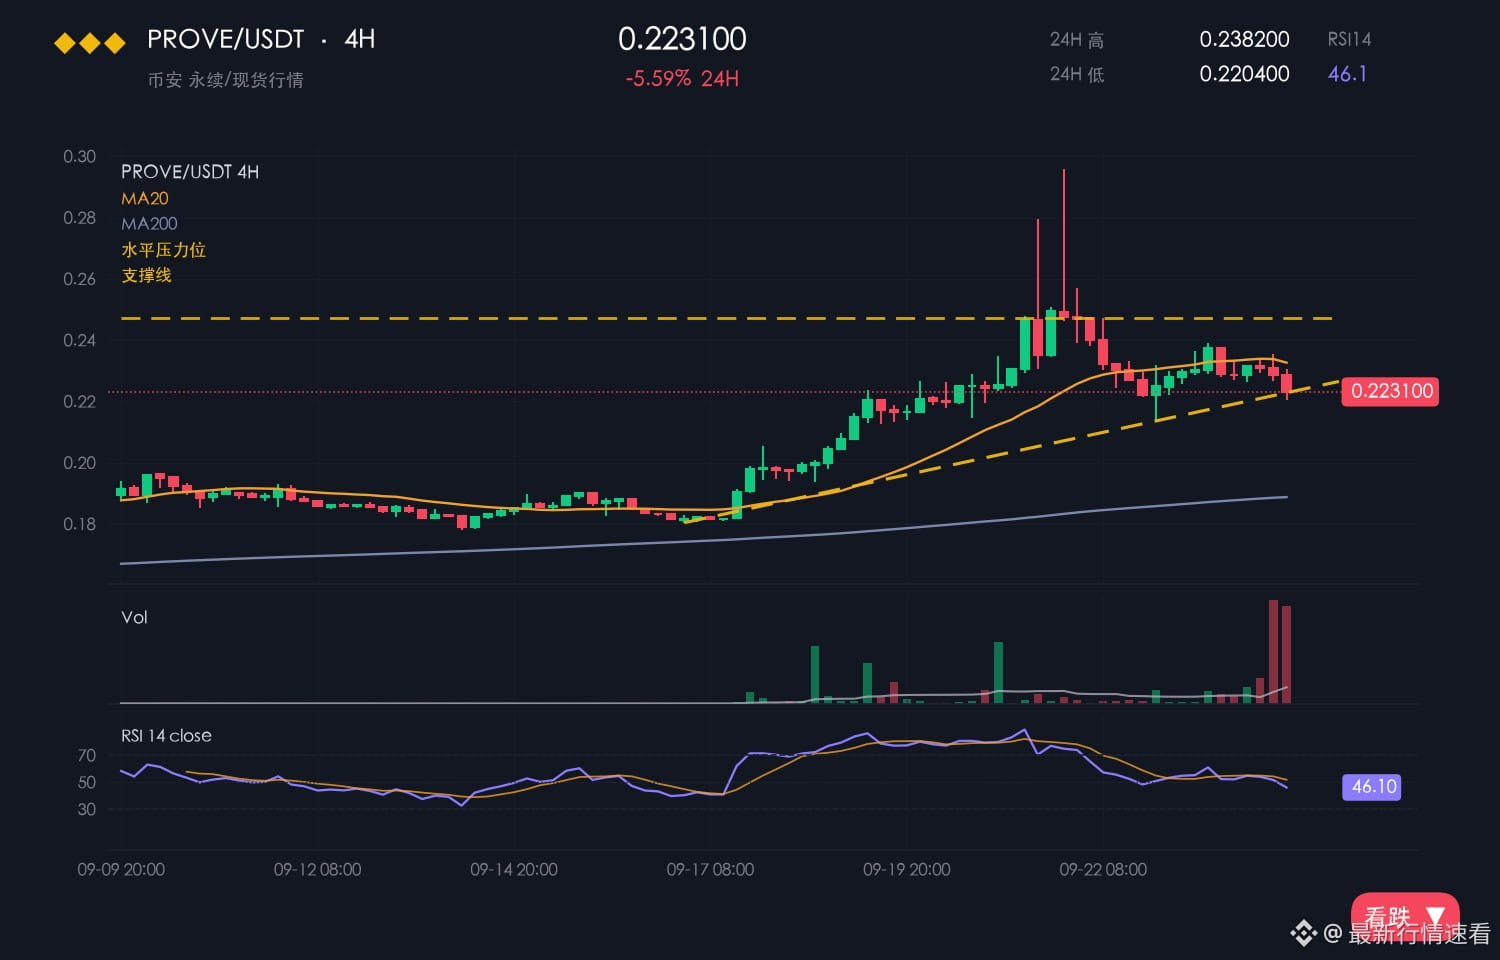
PROVE 现报 0.1968,24 小时涨 2.23%,7 日涨幅 7.89%,日内区间 0.1898–0.2065,振幅 8.8%。
【盘面】
今天 PROVE 走得很磨人,多空都在等一个明确的信号。
向上要看到 0.2065 被拿下,向下要看 0.1898 守不守得住,两条路都摆着。
最近几根 4 小时 K 线的重心持续抬高,多头控盘的迹象比较明显。
价格远离 0.1898 之后没有失守,回撤空间整体可控。
大盘同期只有 -1.18%,PROVE 涨 2.23% 算是拿到了超额收益。
【宏观面】 隔夜美股 纳指 +0.82%、标普 +0.70%(2026-10-27 收盘),BTC ETF 本月净流出约 452 亿美元,美 CPI 同比 3.7% 超预期,2026-10-27/28 议息加息概率约 47%。
短期偏向看涨。
【看涨理由】
2.23% 的涨幅配上 8.8% 的振幅,说明没人愿意先动手。
24 小时涨 2.23% 配合 7 日 7.89%,涨幅有连续性,不是单日脉冲。
不重仓、不上杠杆、留足子弹,喝茶看戏。
短线涨速偏快,插针风险不能忽视,等回踩确认再动手更稳妥。
$PROVE #PROVE
PROVE 现报 0.1968,24 小时涨 2.23%,7 日涨幅 7.89%,日内区间 0.1898–0.2065,振幅 8.8%。
【盘面】
今天 PROVE 走得很磨人,多空都在等一个明确的信号。
向上要看到 0.2065 被拿下,向下要看 0.1898 守不守得住,两条路都摆着。
最近几根 4 小时 K 线的重心持续抬高,多头控盘的迹象比较明显。
价格远离 0.1898 之后没有失守,回撤空间整体可控。
大盘同期只有 -1.18%,PROVE 涨 2.23% 算是拿到了超额收益。
【宏观面】 隔夜美股 纳指 +0.82%、标普 +0.70%(2026-10-27 收盘),BTC ETF 本月净流出约 452 亿美元,美 CPI 同比 3.7% 超预期,2026-10-27/28 议息加息概率约 47%。
短期偏向看涨。
【看涨理由】
2.23% 的涨幅配上 8.8% 的振幅,说明没人愿意先动手。
24 小时涨 2.23% 配合 7 日 7.89%,涨幅有连续性,不是单日脉冲。
不重仓、不上杠杆、留足子弹,喝茶看戏。
短线涨速偏快,插针风险不能忽视,等回踩确认再动手更稳妥。
$PROVE #PROVE
【盘面】
今天 PROVE 走得很磨人,多空都在等一个明确的信号。
向上要看到 0.2065 被拿下,向下要看 0.1898 守不守得住,两条路都摆着。
最近几根 4 小时 K 线的重心持续抬高,多头控盘的迹象比较明显。
价格远离 0.1898 之后没有失守,回撤空间整体可控。
大盘同期只有 -1.18%,PROVE 涨 2.23% 算是拿到了超额收益。
【宏观面】 隔夜美股 纳指 +0.82%、标普 +0.70%(2026-10-27 收盘),BTC ETF 本月净流出约 452 亿美元,美 CPI 同比 3.7% 超预期,2026-10-27/28 议息加息概率约 47%。
短期偏向看涨。
【看涨理由】
2.23% 的涨幅配上 8.8% 的振幅,说明没人愿意先动手。
24 小时涨 2.23% 配合 7 日 7.89%,涨幅有连续性,不是单日脉冲。
不重仓、不上杠杆、留足子弹,喝茶看戏。
短线涨速偏快,插针风险不能忽视,等回踩确认再动手更稳妥。
$PROVE #PROVE
2

🚀 Spot Trading Tournament Season 10 is LIVE! 300,000 USDC Prize Pool! 🏆
Binance just launched Season 10 and it's huge!
Key Details:
📅 Period: Oct 29 - Nov 5
💰 Prize: 300,000 USDC in Vouchers (1st Place = 9,000 USDC!)
📊 Pairs: SOL/USDC & $PROVE /USDT
✅ Min. Volume: Only $500 to Qualify!
I have only $4.07 portfolio but I'm still joining with small trades! Even if I'm not top 20, all remaining eligible users will get proportional share capped at 30 USDC! That's 7X of my portfolio 😅
My strategy: Slow & steady DCA in SOL/USDC
Are you joining? What's your target? Let's push together!
$SOL $BNB $BTC
#Binance #SpotTradingTournament #Season10 #sol #PROVE
{spot}(PROVEUSDT)
{spot}(SOLUSDT)
{spot}(BTCUSDT)
🚀 Spot Trading Tournament Season 10 is LIVE! 300,000 USDC Prize Pool! 🏆
Binance just launched Season 10 and it's huge!
Key Details:
📅 Period: Oct 29 - Nov 5
💰 Prize: 300,000 USDC in Vouchers (1st Place = 9,000 USDC!)
📊 Pairs: SOL/USDC & $PROVE /USDT
✅ Min. Volume: Only $500 to Qualify!
I have only $4.07 portfolio but I'm still joining with small trades! Even if I'm not top 20, all remaining eligible users will get proportional share capped at 30 USDC! That's 7X of my portfolio 😅
My strategy: Slow & steady DCA in SOL/USDC
Are you joining? What's your target? Let's push together!
$SOL $BNB $BTC
#Binance #SpotTradingTournament #Season10 #sol #PROVE
Binance just launched Season 10 and it's huge!
Key Details:
📅 Period: Oct 29 - Nov 5
💰 Prize: 300,000 USDC in Vouchers (1st Place = 9,000 USDC!)
📊 Pairs: SOL/USDC & $PROVE /USDT
✅ Min. Volume: Only $500 to Qualify!
I have only $4.07 portfolio but I'm still joining with small trades! Even if I'm not top 20, all remaining eligible users will get proportional share capped at 30 USDC! That's 7X of my portfolio 😅
My strategy: Slow & steady DCA in SOL/USDC
Are you joining? What's your target? Let's push together!
$SOL $BNB $BTC
#Binance #SpotTradingTournament #Season10 #sol #PROVE

281

·
--
$PROVE
{future}(PROVEUSDT)
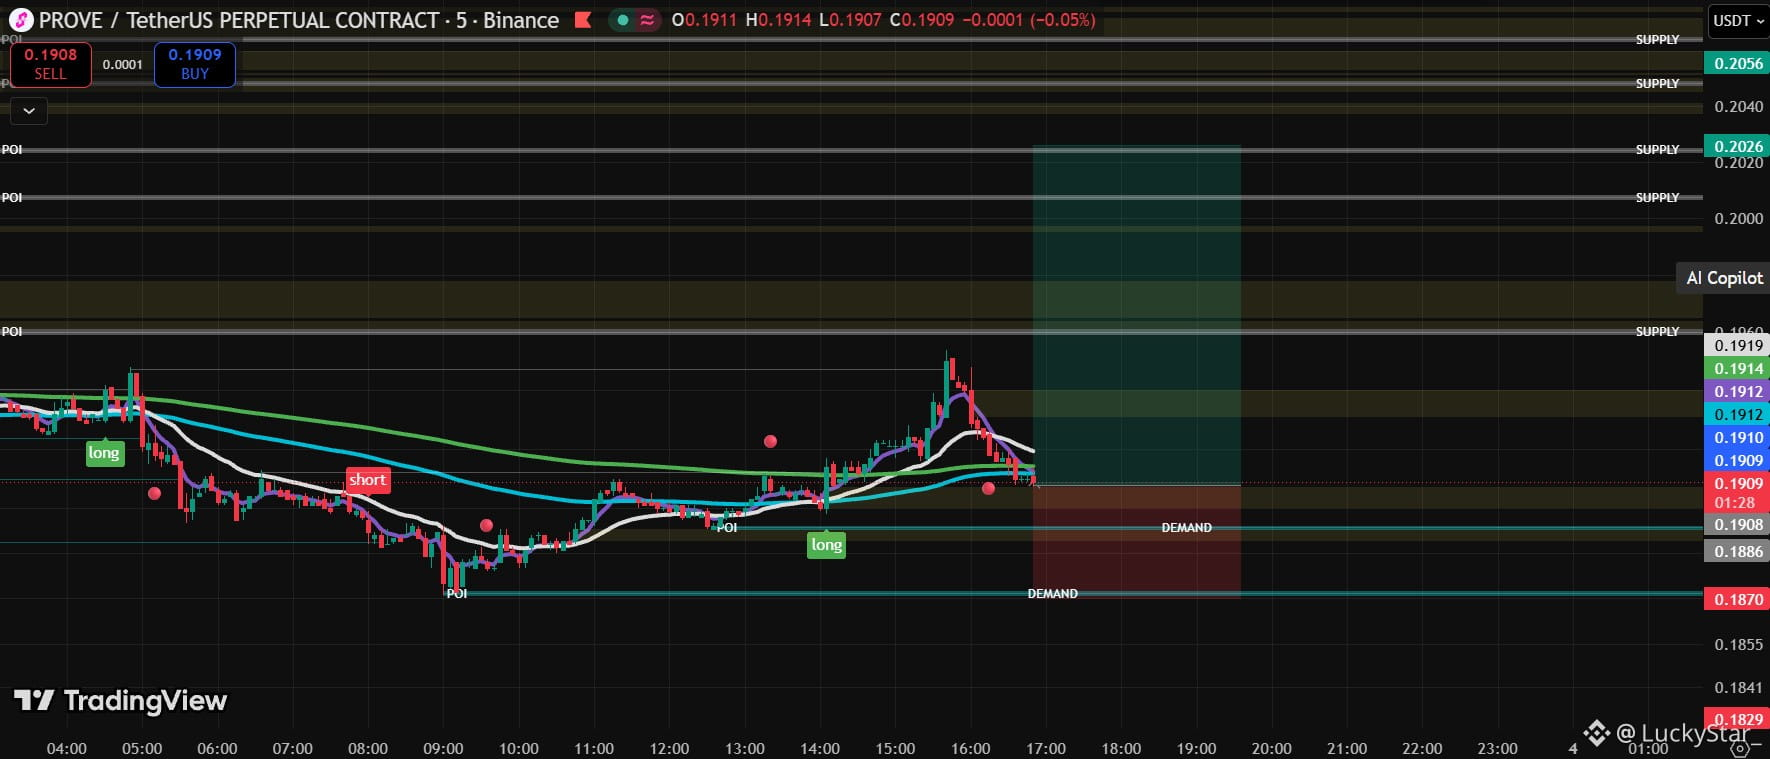
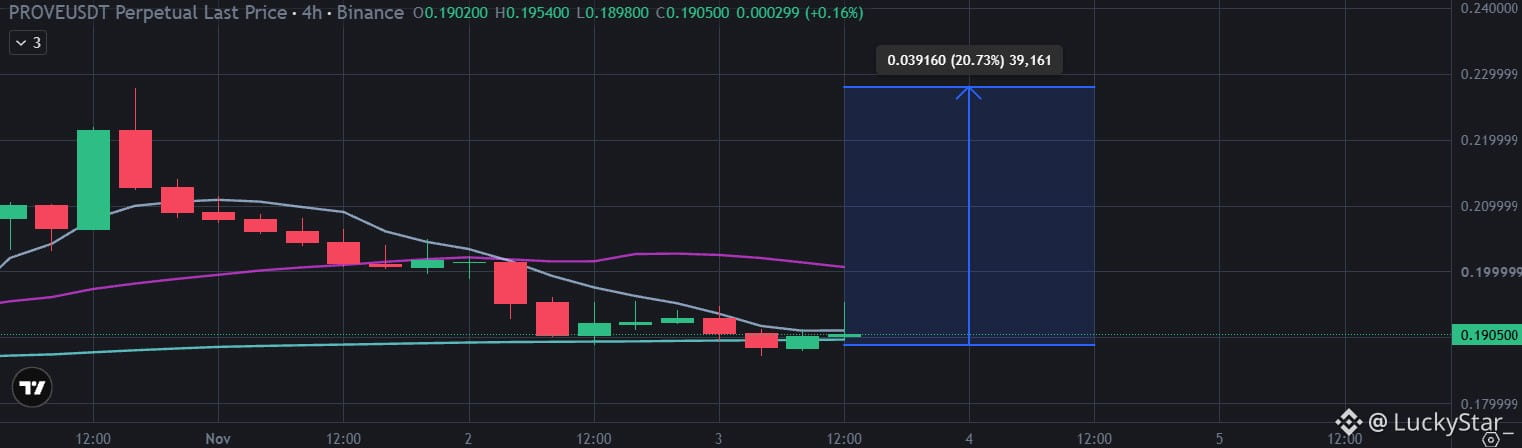
The market is preparing for new highs following a liquidity sweep.
We continue to monitor this formation.
ARE YOU READY FOR NEW HIGHS?
🏆 LONG SCENARIO — the way to a new high?
#prove #PROVEAirdrop #long
$PROVE
The market is preparing for new highs following a liquidity sweep.
We continue to monitor this formation.
ARE YOU READY FOR NEW HIGHS?
🏆 LONG SCENARIO — the way to a new high?
#prove #PROVEAirdrop #long
The market is preparing for new highs following a liquidity sweep.
We continue to monitor this formation.
ARE YOU READY FOR NEW HIGHS?
🏆 LONG SCENARIO — the way to a new high?
#prove #PROVEAirdrop #long
20

·
--
$PROVE is at $0.1911.
Down 6.51% in 24h, with $1.12M traded. The ugly part? 4h is down 5% too, but volume is only 0.9x the 20-day average. This looks more like steady selling than a full panic flush.
RSI sits at 41. MAs are chopping. Longs are still paying 0.005% funding, which is not the setup I want while price bleeds. $XRP is holding up better, so PROVE needs to prove it can decouple.
At $0.19, I’d watch for a clean reclaim before getting interested. Lose it and the chart gets weaker fast. 👀📉
Bull or bear on PROVE here?
#PROVE #Trading
$PROVE is at $0.1911.
Down 6.51% in 24h, with $1.12M traded. The ugly part? 4h is down 5% too, but volume is only 0.9x the 20-day average. This looks more like steady selling than a full panic flush.
RSI sits at 41. MAs are chopping. Longs are still paying 0.005% funding, which is not the setup I want while price bleeds. $XRP is holding up better, so PROVE needs to prove it can decouple.
At $0.19, I’d watch for a clean reclaim before getting interested. Lose it and the chart gets weaker fast. 👀📉
Bull or bear on PROVE here?
#PROVE #Trading
Down 6.51% in 24h, with $1.12M traded. The ugly part? 4h is down 5% too, but volume is only 0.9x the 20-day average. This looks more like steady selling than a full panic flush.
RSI sits at 41. MAs are chopping. Longs are still paying 0.005% funding, which is not the setup I want while price bleeds. $XRP is holding up better, so PROVE needs to prove it can decouple.
At $0.19, I’d watch for a clean reclaim before getting interested. Lose it and the chart gets weaker fast. 👀📉
Bull or bear on PROVE here?
#PROVE #Trading
5

·
--
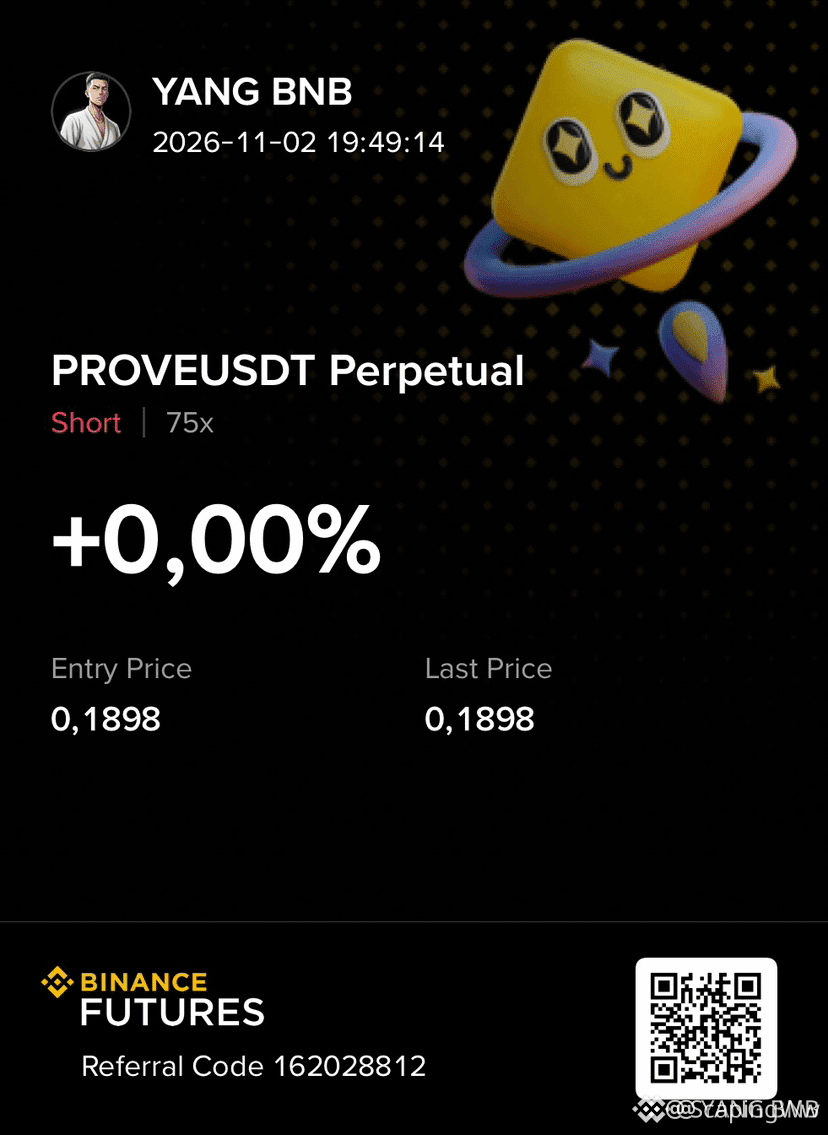
🔴 $PROVE SLIPS INTO BEARISH SWEEP – SELL SIGNAL HEATS UP! 🚨
Entry: 0.1890-0.1930 ⚡
Target: 0.1800 🚀
Stop Loss: 0.2069 ⚠️
The 4H frame is painting a clean bearish reversal, with three straight red candles hammering the last resistance at 0.2200. Sellers have seized the momentum, driving the pair down to 0.1897, a near‑8% dip in 24h. 📊
Support at 0.1890 is now the last line of defense; if it cracks, liquidity hunters will push the price toward the next bucket at 0.1800 and beyond. The order flow shows diminishing buying pressure and a growing sell wall, a classic smart‑money exit. ⚡🌊
Position size tight, risk‑to‑reward still attractive on the first target. 💬 Which level are you eyeing for the short entry – the tight 0.1890‑0.1930 band or the deeper pullback? 👇
⚠️ Not financial advice. Always manage your risk. 🛡️
🏷️ #PROVE #ShortSetup #Bearish #Crypto
🔥 💎
🔴 $PROVE SLIPS INTO BEARISH SWEEP – SELL SIGNAL HEATS UP! 🚨
Entry: 0.1890-0.1930 ⚡
Target: 0.1800 🚀
Stop Loss: 0.2069 ⚠️
The 4H frame is painting a clean bearish reversal, with three straight red candles hammering the last resistance at 0.2200. Sellers have seized the momentum, driving the pair down to 0.1897, a near‑8% dip in 24h. 📊
Support at 0.1890 is now the last line of defense; if it cracks, liquidity hunters will push the price toward the next bucket at 0.1800 and beyond. The order flow shows diminishing buying pressure and a growing sell wall, a classic smart‑money exit. ⚡🌊
Position size tight, risk‑to‑reward still attractive on the first target. 💬 Which level are you eyeing for the short entry – the tight 0.1890‑0.1930 band or the deeper pullback? 👇
⚠️ Not financial advice. Always manage your risk. 🛡️
🏷️ #PROVE #ShortSetup #Bearish #Crypto
🔥 💎
Entry: 0.1890-0.1930 ⚡
Target: 0.1800 🚀
Stop Loss: 0.2069 ⚠️
The 4H frame is painting a clean bearish reversal, with three straight red candles hammering the last resistance at 0.2200. Sellers have seized the momentum, driving the pair down to 0.1897, a near‑8% dip in 24h. 📊
Support at 0.1890 is now the last line of defense; if it cracks, liquidity hunters will push the price toward the next bucket at 0.1800 and beyond. The order flow shows diminishing buying pressure and a growing sell wall, a classic smart‑money exit. ⚡🌊
Position size tight, risk‑to‑reward still attractive on the first target. 💬 Which level are you eyeing for the short entry – the tight 0.1890‑0.1930 band or the deeper pullback? 👇
⚠️ Not financial advice. Always manage your risk. 🛡️
🏷️ #PROVE #ShortSetup #Bearish #Crypto
🔥 💎
5

🔴 🦈 $PROVE BEARISH BREAKDOWN REACHES LIQUIDITY SWEEP! 🚨
Entry: 0.1890 – 0.1930 ⚡
Target: 0.1800 🚀
Stop Loss: 0.2069 ⚠️
📊 The 4H chart flips into a clean bearish reversal, with red candles chaining into the 0.1890 support zone. 🦈 Smart money is draining liquidity above 0.2200, leaving the order block exposed. 📈 Selling pressure accelerates as buying momentum stalls, hinting at a deeper slide toward the next demand cluster. 💡 If the 0.1890 floor cracks, the path to 0.1600 and beyond becomes a high‑R:R play. 💬 Do you see the next liquidity pool forming below the current support? 👇
⚠️ Not financial advice. Always manage your risk. 🛡️
🏷️ #PROVE #ShortSetup #Bearish #Crypto
🔥 🦈
🔴 🦈 $PROVE BEARISH BREAKDOWN REACHES LIQUIDITY SWEEP! 🚨
Entry: 0.1890 – 0.1930 ⚡
Target: 0.1800 🚀
Stop Loss: 0.2069 ⚠️
📊 The 4H chart flips into a clean bearish reversal, with red candles chaining into the 0.1890 support zone. 🦈 Smart money is draining liquidity above 0.2200, leaving the order block exposed. 📈 Selling pressure accelerates as buying momentum stalls, hinting at a deeper slide toward the next demand cluster. 💡 If the 0.1890 floor cracks, the path to 0.1600 and beyond becomes a high‑R:R play. 💬 Do you see the next liquidity pool forming below the current support? 👇
⚠️ Not financial advice. Always manage your risk. 🛡️
🏷️ #PROVE #ShortSetup #Bearish #Crypto
🔥 🦈
Entry: 0.1890 – 0.1930 ⚡
Target: 0.1800 🚀
Stop Loss: 0.2069 ⚠️
📊 The 4H chart flips into a clean bearish reversal, with red candles chaining into the 0.1890 support zone. 🦈 Smart money is draining liquidity above 0.2200, leaving the order block exposed. 📈 Selling pressure accelerates as buying momentum stalls, hinting at a deeper slide toward the next demand cluster. 💡 If the 0.1890 floor cracks, the path to 0.1600 and beyond becomes a high‑R:R play. 💬 Do you see the next liquidity pool forming below the current support? 👇
⚠️ Not financial advice. Always manage your risk. 🛡️
🏷️ #PROVE #ShortSetup #Bearish #Crypto
🔥 🦈
7
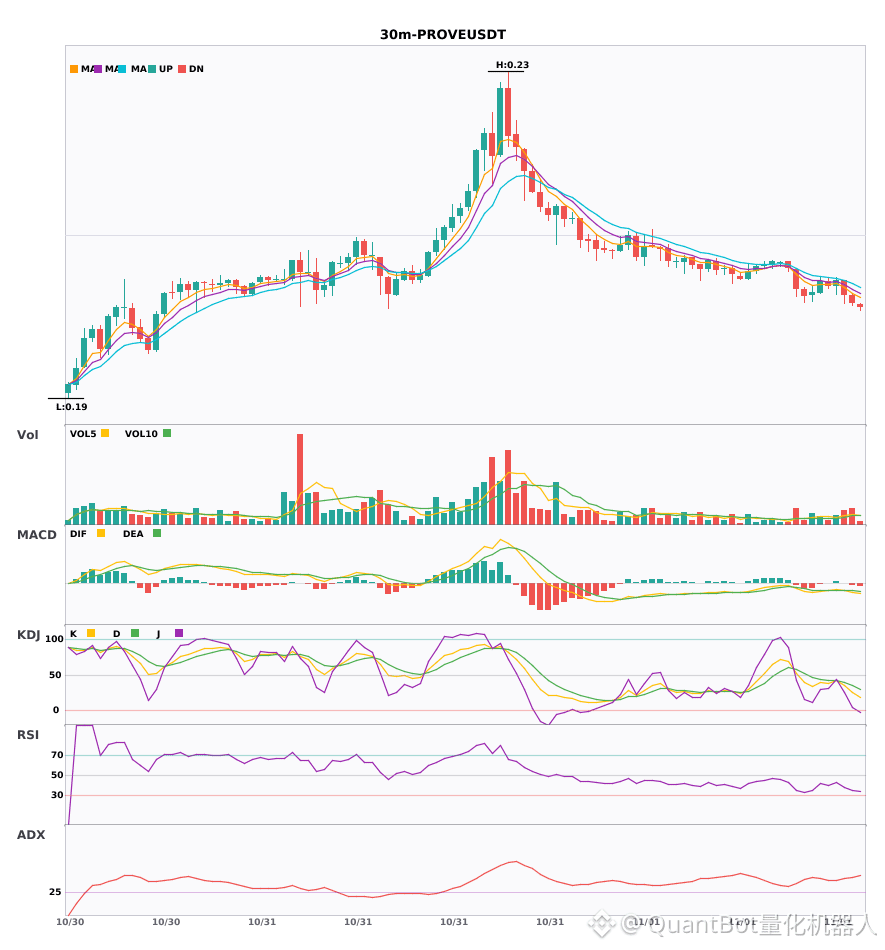
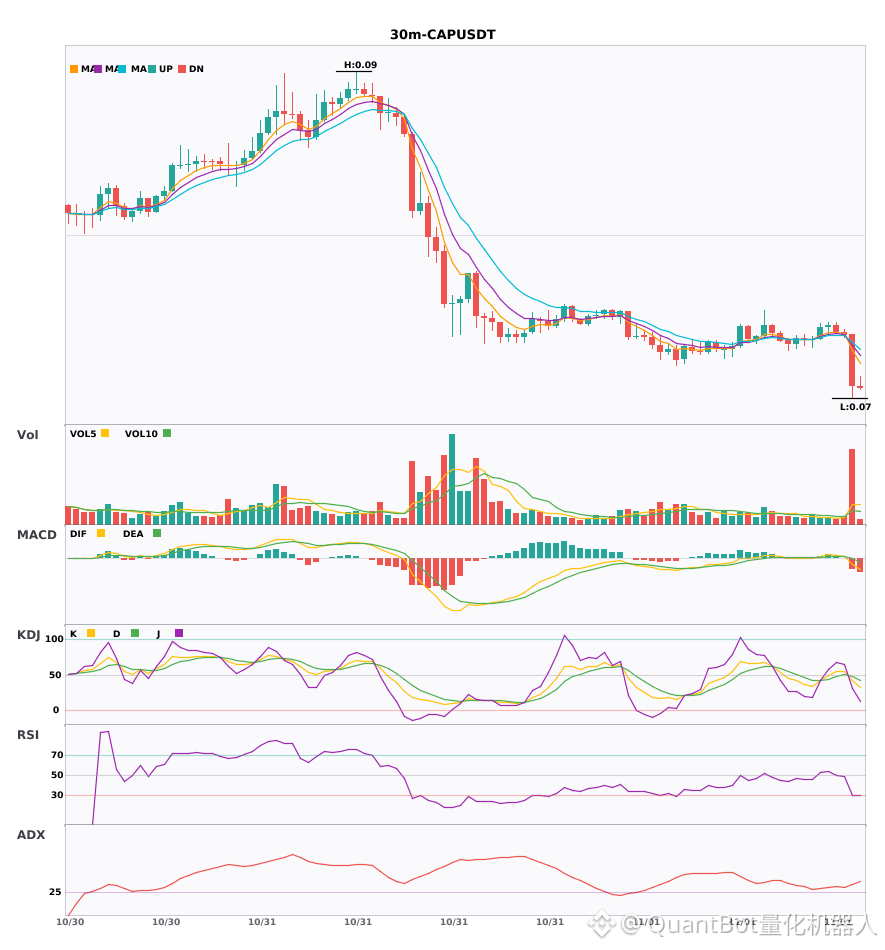
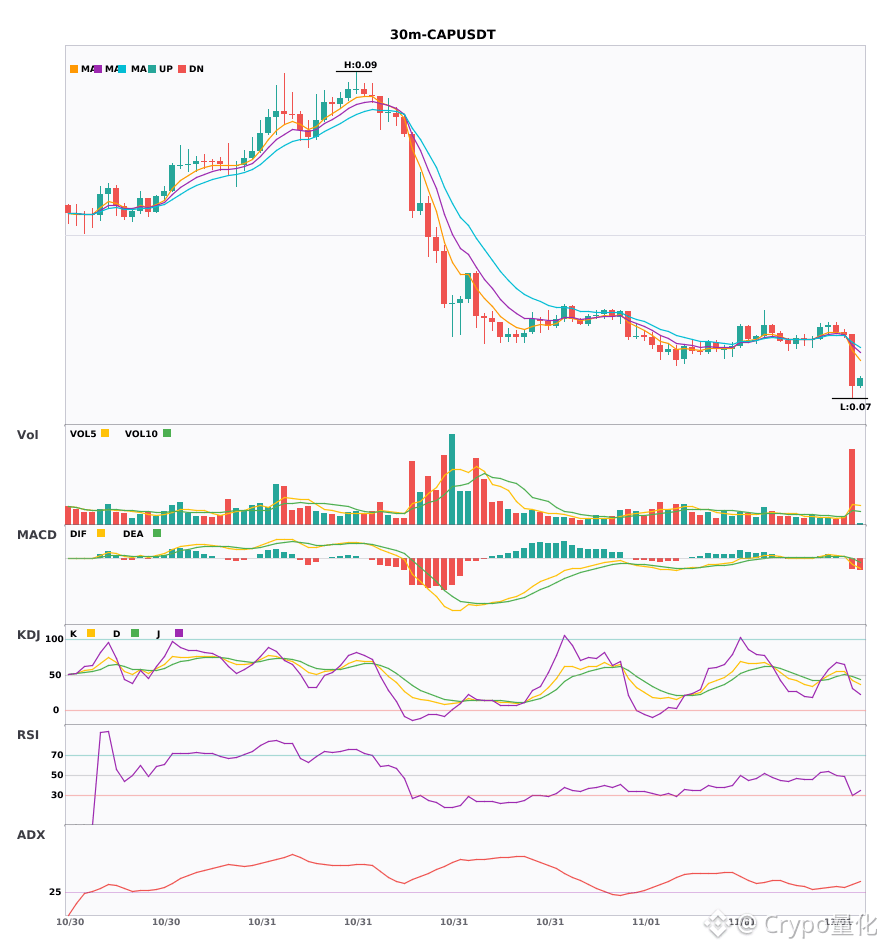
2个30分钟级别空头预警:$PROVE / $CAP
📉 $PROVE | 30分钟 空头信号
━━━━━━━━━━━━━━━━━━
技术分析:ADX(40) 明显的趋势行情 | MACD零下死叉,空头加速 | EMA5小于EMA8小于EMA13 空头排列 | KDJ死叉,短期看空 (K为35.3 D为39.9) | 成交量放大(1.9倍)
价格变动:-0.7300%
📉 $CAP | 30分钟 空头信号
━━━━━━━━━━━━━━━━━━
技术分析:ADX(37) 明显的趋势行情 | MACD零下死叉,空头加速 | EMA5下穿EMA8,短期转空 | KDJ死叉,短期看空 (K为42.0 D为47.4) | 成交量爆发(5.3倍)
价格变动:-4.4700%
━━━━━━━━━━━━━━━━━━
#技术分析 #PROVE #CAP
📌 以上内容仅供参考,不构成投资建议
2个30分钟级别空头预警:$PROVE / $CAP
📉 $PROVE | 30分钟 空头信号
━━━━━━━━━━━━━━━━━━
技术分析:ADX(40) 明显的趋势行情 | MACD零下死叉,空头加速 | EMA5小于EMA8小于EMA13 空头排列 | KDJ死叉,短期看空 (K为35.3 D为39.9) | 成交量放大(1.9倍)
价格变动:-0.7300%
📉 $CAP | 30分钟 空头信号
━━━━━━━━━━━━━━━━━━
技术分析:ADX(37) 明显的趋势行情 | MACD零下死叉,空头加速 | EMA5下穿EMA8,短期转空 | KDJ死叉,短期看空 (K为42.0 D为47.4) | 成交量爆发(5.3倍)
价格变动:-4.4700%
━━━━━━━━━━━━━━━━━━
#技术分析 #PROVE #CAP
📌 以上内容仅供参考,不构成投资建议
📉 $PROVE | 30分钟 空头信号
━━━━━━━━━━━━━━━━━━
技术分析:ADX(40) 明显的趋势行情 | MACD零下死叉,空头加速 | EMA5小于EMA8小于EMA13 空头排列 | KDJ死叉,短期看空 (K为35.3 D为39.9) | 成交量放大(1.9倍)
价格变动:-0.7300%
📉 $CAP | 30分钟 空头信号
━━━━━━━━━━━━━━━━━━
技术分析:ADX(37) 明显的趋势行情 | MACD零下死叉,空头加速 | EMA5下穿EMA8,短期转空 | KDJ死叉,短期看空 (K为42.0 D为47.4) | 成交量爆发(5.3倍)
价格变动:-4.4700%
━━━━━━━━━━━━━━━━━━
#技术分析 #PROVE #CAP
📌 以上内容仅供参考,不构成投资建议
16
·
--
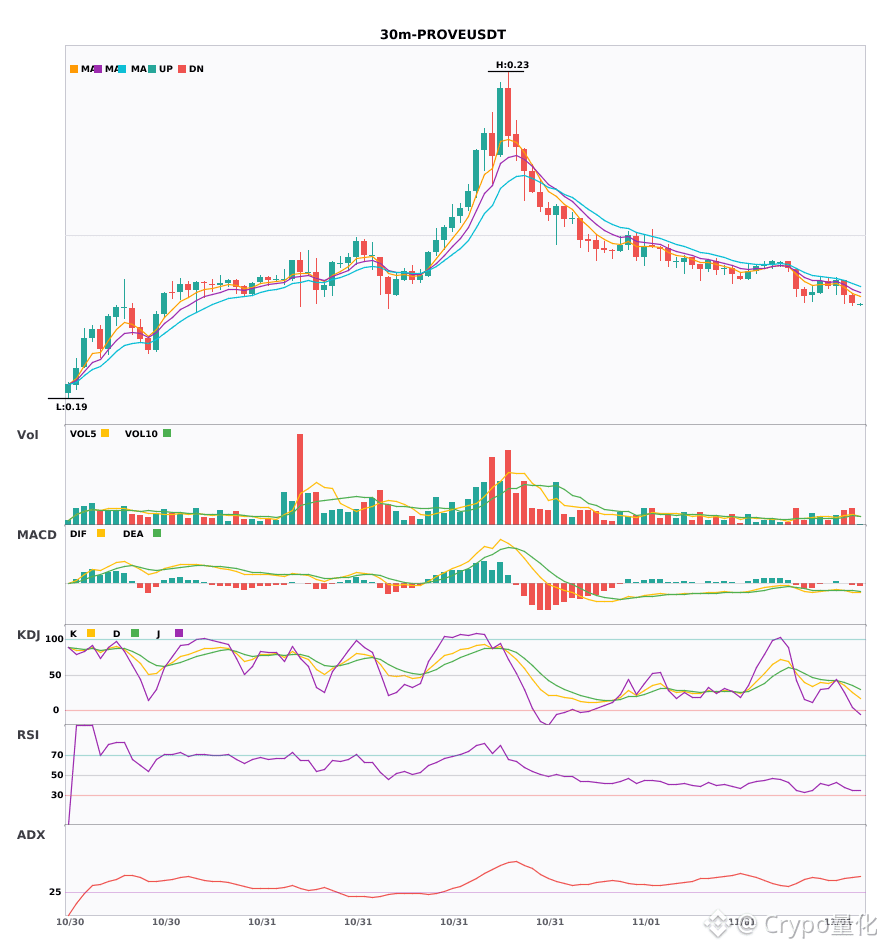
$PROVE / $CAP 30分钟级别偏空,短线承压🔥
════════════════════
🟢 $PROVE 30分钟 空头信号
⚠️技术面:ADX(40) 明显的趋势行情 | MACD零下死叉,空头加速 | EMA5小于EMA8小于EMA13 空头排列 | KDJ死叉,短期看空 (K为35.3 D为39.9) | 成交量放大(1.9倍)
════════════════════
🟢 $CAP 30分钟 空头信号
⚠️技术面:ADX(37) 明显的趋势行情 | MACD零下死叉,空头加速 | EMA5下穿EMA8,短期转空 | KDJ死叉,短期看空 (K为42.0 D为47.4) | 成交量爆发(5.3倍)
════════════════════
🔔 关注获取第一手行情异动 🔔
#技术分析 #PROVE #CAP
📌 交易时注意k线形态是否符合
$PROVE / $CAP 30分钟级别偏空,短线承压🔥
════════════════════
🟢 $PROVE 30分钟 空头信号
⚠️技术面:ADX(40) 明显的趋势行情 | MACD零下死叉,空头加速 | EMA5小于EMA8小于EMA13 空头排列 | KDJ死叉,短期看空 (K为35.3 D为39.9) | 成交量放大(1.9倍)
════════════════════
🟢 $CAP 30分钟 空头信号
⚠️技术面:ADX(37) 明显的趋势行情 | MACD零下死叉,空头加速 | EMA5下穿EMA8,短期转空 | KDJ死叉,短期看空 (K为42.0 D为47.4) | 成交量爆发(5.3倍)
════════════════════
🔔 关注获取第一手行情异动 🔔
#技术分析 #PROVE #CAP
📌 交易时注意k线形态是否符合
════════════════════
🟢 $PROVE 30分钟 空头信号
⚠️技术面:ADX(40) 明显的趋势行情 | MACD零下死叉,空头加速 | EMA5小于EMA8小于EMA13 空头排列 | KDJ死叉,短期看空 (K为35.3 D为39.9) | 成交量放大(1.9倍)
════════════════════
🟢 $CAP 30分钟 空头信号
⚠️技术面:ADX(37) 明显的趋势行情 | MACD零下死叉,空头加速 | EMA5下穿EMA8,短期转空 | KDJ死叉,短期看空 (K为42.0 D为47.4) | 成交量爆发(5.3倍)
════════════════════
🔔 关注获取第一手行情异动 🔔
#技术分析 #PROVE #CAP
📌 交易时注意k线形态是否符合
9

·
--
Падение
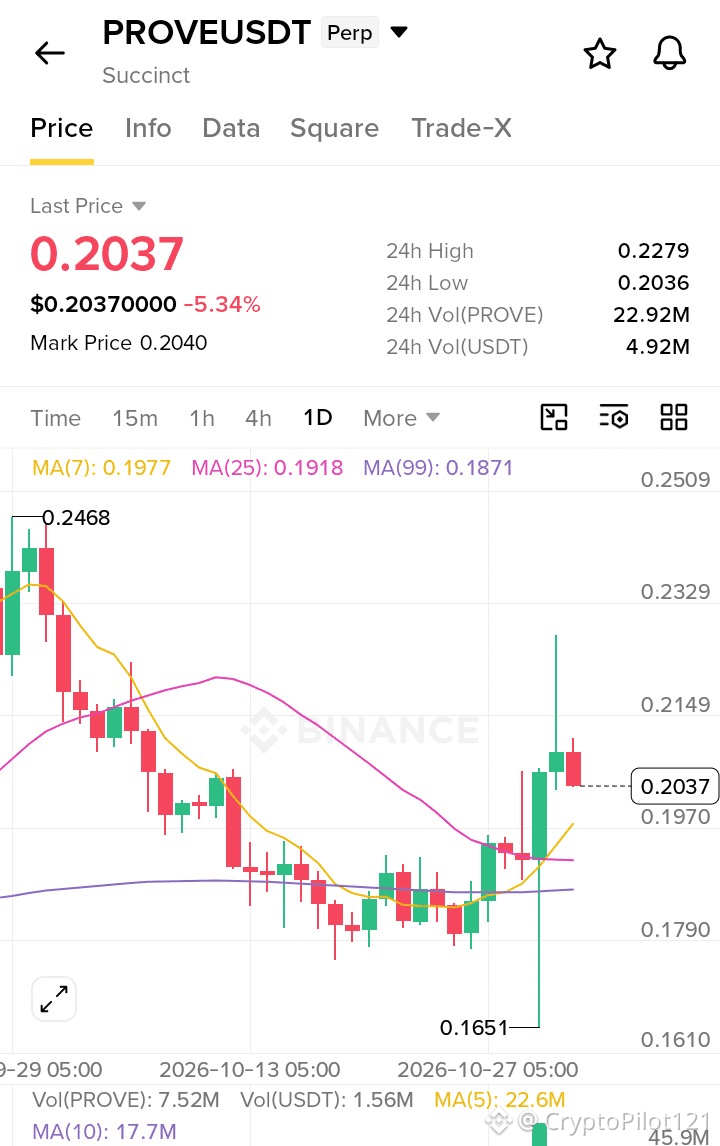
🔻 $PROVE USDT Perp – Short Setup
Entry Zone: 0.2037 – 0.2100
Target 1: 0.1918 (MA25 support)
Target 2: 0.1871 (MA99 support)
Stop Loss: 0.2200
Why Short?
· Rejection after a massive upside wick to 0.2279
· Downtrend at -5.34%
· Price failing to hold above the recent high, dropping back toward MA(7): 0.1977, with the large wick indicating strong selling pressure at higher levels
Key Levels:
🔴 Resistance: 0.2200
🟢 Support: 0.1918 → 0.1871
#PROVE #Trading #ShortSignal #Crypto #Binance
$PROVE
{future}(PROVEUSDT)
🔻 $PROVE USDT Perp – Short Setup
Entry Zone: 0.2037 – 0.2100
Target 1: 0.1918 (MA25 support)
Target 2: 0.1871 (MA99 support)
Stop Loss: 0.2200
Why Short?
· Rejection after a massive upside wick to 0.2279
· Downtrend at -5.34%
· Price failing to hold above the recent high, dropping back toward MA(7): 0.1977, with the large wick indicating strong selling pressure at higher levels
Key Levels:
🔴 Resistance: 0.2200
🟢 Support: 0.1918 → 0.1871
#PROVE #Trading #ShortSignal #Crypto #Binance
$PROVE
Entry Zone: 0.2037 – 0.2100
Target 1: 0.1918 (MA25 support)
Target 2: 0.1871 (MA99 support)
Stop Loss: 0.2200
Why Short?
· Rejection after a massive upside wick to 0.2279
· Downtrend at -5.34%
· Price failing to hold above the recent high, dropping back toward MA(7): 0.1977, with the large wick indicating strong selling pressure at higher levels
Key Levels:
🔴 Resistance: 0.2200
🟢 Support: 0.1918 → 0.1871
#PROVE #Trading #ShortSignal #Crypto #Binance
$PROVE
7

Войдите, чтобы посмотреть больше материала
Присоединяйтесь к пользователям криптовалют по всему миру на Binance Square
⚡️ Получайте новейшую и полезную информацию о криптоактивах.
💬 Нам доверяет крупнейшая в мире криптобиржа.
👍 Получите достоверные аналитические данные от верифицированных создателей контента.
Эл. почта/номер телефона
В тренде
1
#WhatWillDriveCryptoandStocks’NextRebound?
Просмотров: 50,006
710 обсуждают
2
#Anthropic’s6xIPODemandSignalsPotentialRecordRaise
Просмотров: 16,274
346 обсуждают
3
#USCryptoETFsLose$1.48BInFiveDays
Просмотров: 95
4 обсуждают
4
#KoreaDigitalAssetBasicActFinalDraftExpectedEarlyJanuary
Просмотров: 10
3 обсуждают
5
#JaneStreetNearlyOctuplesFidelityBitcoinETFHoldings
Просмотров: 2,997
76 обсуждают
6
#HuangExitNvidiaStrategyInFocus
Просмотров: 198,094
1,684 обсуждают
7
#AnthropicRejectsIPODelayValuationinQuestion
Просмотров: 822,295
5,844 обсуждают
8
#FlopLabsTestnetAndAirdropToLaunchNov24
Просмотров: 380
22 обсуждают
9
#HedgeFundsCMEBitcoinNetShortsFall89%
Просмотров: 20,253
276 обсуждают
10
#BitMineReports$6.3BNetLossForFiscal2026
Просмотров: 28,001
196 обсуждают