
#lmecopperstocksfall42dayslongestsince2014
lmecopperstocksfall42dayslongestsince2014
Просмотров: 159,110
1,607 обсуждают
Популярные
Новые

Have you noticed how everyone is treating falling LME copper stocks like a “metals story” when it may actually be a liquidity warning for crypto?
The pain is simple: traders keep buying every green candle in alts, then wonder why they get trapped when macro pressure returns. If copper inventories are tightening for 42 straight days, the smart move is not blind FOMO, it’s preparing for volatility before the market prices it in.
Here’s my hot take: copper is not just an industrial metal, it’s a real-time signal for global demand, supply stress, and inflation risk. If copper stays tight while risk assets are already nervous, crypto traders should stop assuming every dip in $POL or $MOVR is automatically a bargain.
Actionable approach: keep more dry powder in $USDT, wait for confirmation instead of chasing breakouts, and watch whether equities keep absorbing macro pressure. With Fear & Greed sitting in fear territory, the market is telling you patience has value.
The mainstream narrative says copper shortages are bullish for commodities only. I think they’re also a warning that risk markets may get more selective, and weak alt setups could be punished while stronger narratives survive.
Are you treating this copper move as noise, or as an early macro signal for crypto positioning? #LMECopperStocksFall42DaysLongestSince2014 #SP500TopsRecord7800 #CryptoStartupsRaise
The pain is simple: traders keep buying every green candle in alts, then wonder why they get trapped when macro pressure returns. If copper inventories are tightening for 42 straight days, the smart move is not blind FOMO, it’s preparing for volatility before the market prices it in.
Here’s my hot take: copper is not just an industrial metal, it’s a real-time signal for global demand, supply stress, and inflation risk. If copper stays tight while risk assets are already nervous, crypto traders should stop assuming every dip in $POL or $MOVR is automatically a bargain.
Actionable approach: keep more dry powder in $USDT, wait for confirmation instead of chasing breakouts, and watch whether equities keep absorbing macro pressure. With Fear & Greed sitting in fear territory, the market is telling you patience has value.
The mainstream narrative says copper shortages are bullish for commodities only. I think they’re also a warning that risk markets may get more selective, and weak alt setups could be punished while stronger narratives survive.
Are you treating this copper move as noise, or as an early macro signal for crypto positioning? #LMECopperStocksFall42DaysLongestSince2014 #SP500TopsRecord7800 #CryptoStartupsRaise
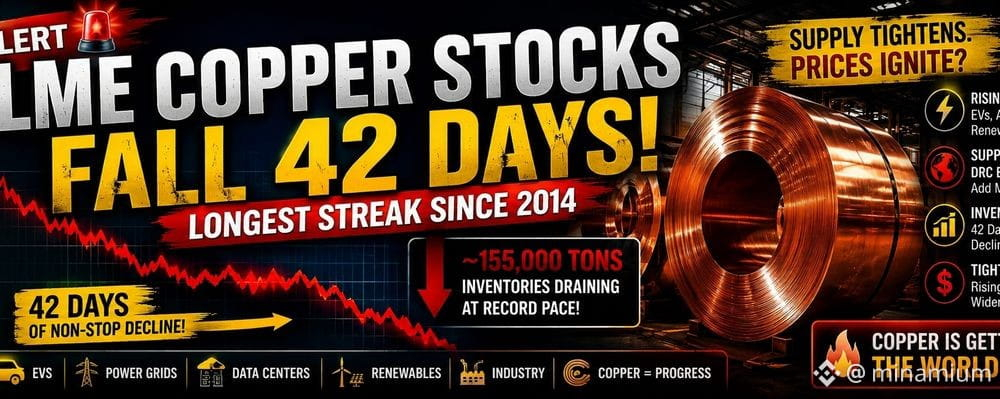

$#LMECopperStocksFall42DaysLongestSince2014 Yes — that headline looks accurate.
Recent reporting says LME copper inventories fell for 42 consecutive trading days, which is described as the longest uninterrupted decline since 2014. Reports published around August 14–17, 2026 also say this drawdown pushed exchange stocks down to roughly 205,000 tonnes, after being above 400,000 tonnes earlier in 2026. (mining.com.au)
Why it matters: falling LME stocks suggest tightening immediately available copper supply. That tightness showed up in the market structure too — spot copper traded at a sharp premium to later-dated contracts, a sign buyers were willing to pay more for prompt delivery. One report cited the August-over-September spread at about $370/tonne, while another noted the cash-to-three-month spread above $400/tonne, both consistent with a squeeze-like setup. (mining.com)
So the clean version is: LME copper stocks have been falling for 42 straight sessions, the longest streak since 2014, and the decline is feeding fears of a near-term physical supply squeeze. (mining.com.au)$ACE
$COPPER
$AEON
Recent reporting says LME copper inventories fell for 42 consecutive trading days, which is described as the longest uninterrupted decline since 2014. Reports published around August 14–17, 2026 also say this drawdown pushed exchange stocks down to roughly 205,000 tonnes, after being above 400,000 tonnes earlier in 2026. (mining.com.au)
Why it matters: falling LME stocks suggest tightening immediately available copper supply. That tightness showed up in the market structure too — spot copper traded at a sharp premium to later-dated contracts, a sign buyers were willing to pay more for prompt delivery. One report cited the August-over-September spread at about $370/tonne, while another noted the cash-to-three-month spread above $400/tonne, both consistent with a squeeze-like setup. (mining.com)
So the clean version is: LME copper stocks have been falling for 42 straight sessions, the longest streak since 2014, and the decline is feeding fears of a near-term physical supply squeeze. (mining.com.au)$ACE
$COPPER
$AEON
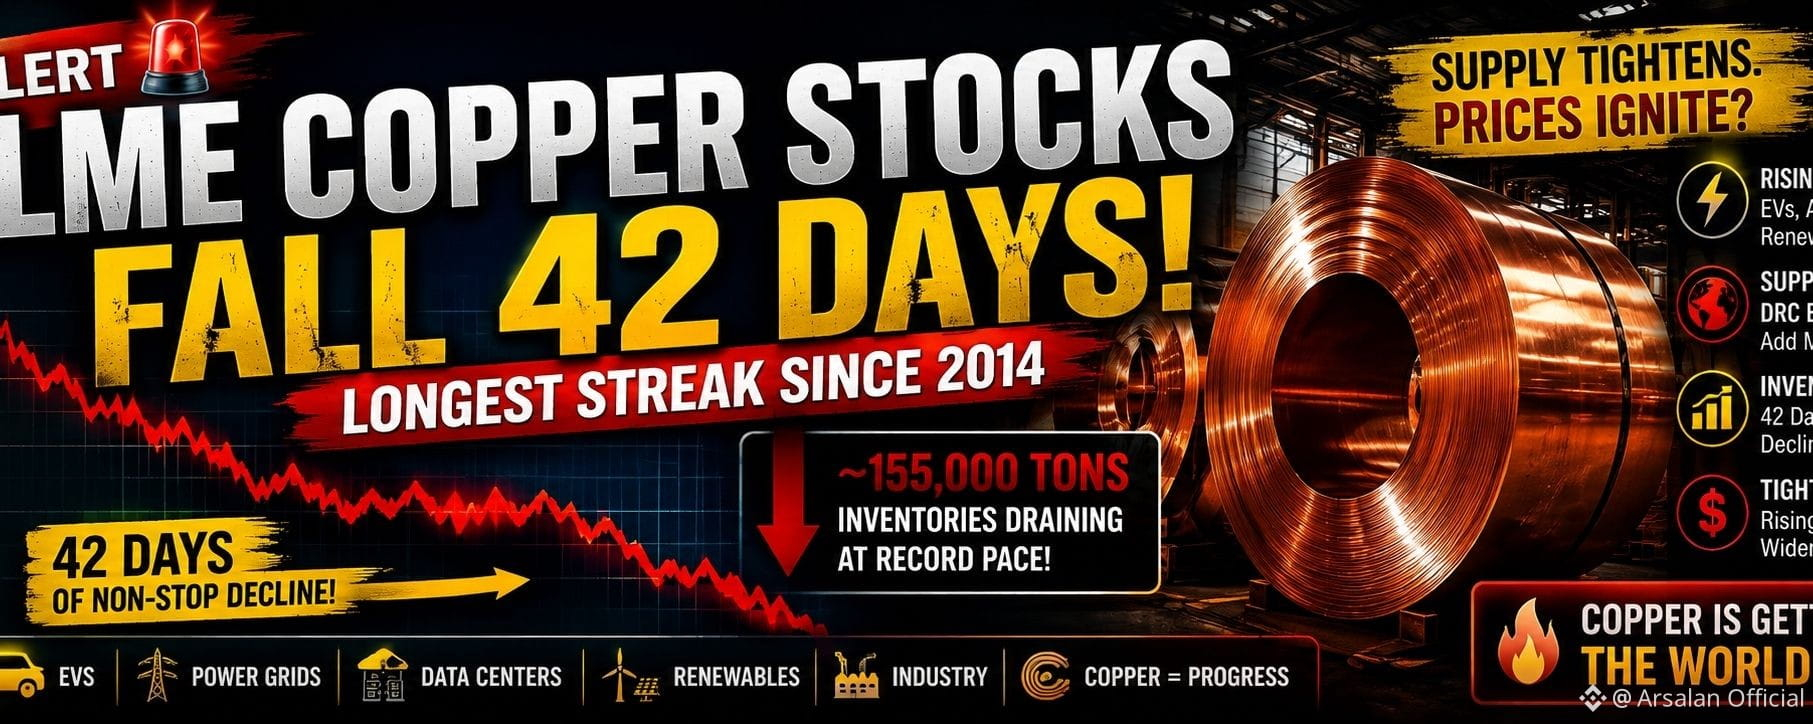

#LMECopperStocksFall42DaysLongestSince2014
LMECopperStocksFall42DaysLongestSince2014 highlights a historic 42 consecutive trading day decline in copper inventories, marking the longest uninterrupted drawdown streak since 2014. London Metal Exchange (LME) warehouse levels have depleted rapidly, with total stockpiles hovering around 205,000 tonnes—nearly half of which are already "cancelled" and slated for imminent removal. This severe drain signals critical tightness in physical supply amid a massive squeeze from both industrial consumption and geopolitical maneuvers.📊 Key Drivers Behind the 42-Day DrainGeopolitical Stockpiling: Metal is aggressively moving to the US to front-run potential tariff disruptions, while China continues absorbing available global physical supply.Next-Gen Industrial Demand: Rapid scaling of AI data centers, global electrification, electric vehicles (EVs), and green energy infrastructure are consuming physical copper at a historic pace.Supply Constraints: Structural mining and production shortfalls prevent global supply from matching industrial pull, exhausting exchange buffers.$GOOGL.US $BNB
LMECopperStocksFall42DaysLongestSince2014 highlights a historic 42 consecutive trading day decline in copper inventories, marking the longest uninterrupted drawdown streak since 2014. London Metal Exchange (LME) warehouse levels have depleted rapidly, with total stockpiles hovering around 205,000 tonnes—nearly half of which are already "cancelled" and slated for imminent removal. This severe drain signals critical tightness in physical supply amid a massive squeeze from both industrial consumption and geopolitical maneuvers.📊 Key Drivers Behind the 42-Day DrainGeopolitical Stockpiling: Metal is aggressively moving to the US to front-run potential tariff disruptions, while China continues absorbing available global physical supply.Next-Gen Industrial Demand: Rapid scaling of AI data centers, global electrification, electric vehicles (EVs), and green energy infrastructure are consuming physical copper at a historic pace.Supply Constraints: Structural mining and production shortfalls prevent global supply from matching industrial pull, exhausting exchange buffers.$GOOGL.US $BNB
GOOGLUS+0,29%
BNB+2,51%

#lmecopperstocksfall42dayslongestsince2014 42 Days. Nobody Watched the Warehouse Empty Until It Was Almost Gone.
Copper didn't crash into a shortage. It leaked into one.
Forty-two days. Not one dramatic headline — a slow, quiet withdrawal, a little every single day, so gradual that for weeks it looked like nothing was happening at all. Then someone finally added up all forty-two days at once, and the number that came out was frightening: 205,000 tonnes left, half of it already spoken for. A market that thought it had time suddenly realizing it didn't.
I know this pattern intimately. Not from a warehouse. From my own account.
Five years. Not one dramatic loss — a fee here, a liquidation there, a line item quietly marked "refund" that was actually a debit. Small enough, day by day, that I never once stopped to add it up. Then I finally did, all at once, the way the LME just did with copper: $4,425 gone to fees. More than the market itself ever took from me. I didn't lose it in a crash. I leaked it, one invisible day at a time, for five years, until someone — me — finally counted all the days together.
That's the real story hiding under every bullet point in this thread. It's never the sudden crash that gets you. It's the slow one, the one quiet enough that nobody thinks to check the total until the total is already frightening.
So here's my question, and it's not really about copper: what's draining in your life right now, one invisible day at a time, that you haven't added up yet?
A warehouse. An account. A trust. They all empty the same way — quietly, until someone finally looks at day 42 and asks where days 1 through 41 went.
Copper is shouting now. It was whispering the whole time. So was my account. So, probably, is something in yours.
Go check. Before day 42 becomes the day you finally notice.
#LMECopperStocksFall42DaysLongestSince2014 #Copper #TraderProtectionFund #RiskManagement
Copper didn't crash into a shortage. It leaked into one.
Forty-two days. Not one dramatic headline — a slow, quiet withdrawal, a little every single day, so gradual that for weeks it looked like nothing was happening at all. Then someone finally added up all forty-two days at once, and the number that came out was frightening: 205,000 tonnes left, half of it already spoken for. A market that thought it had time suddenly realizing it didn't.
I know this pattern intimately. Not from a warehouse. From my own account.
Five years. Not one dramatic loss — a fee here, a liquidation there, a line item quietly marked "refund" that was actually a debit. Small enough, day by day, that I never once stopped to add it up. Then I finally did, all at once, the way the LME just did with copper: $4,425 gone to fees. More than the market itself ever took from me. I didn't lose it in a crash. I leaked it, one invisible day at a time, for five years, until someone — me — finally counted all the days together.
That's the real story hiding under every bullet point in this thread. It's never the sudden crash that gets you. It's the slow one, the one quiet enough that nobody thinks to check the total until the total is already frightening.
So here's my question, and it's not really about copper: what's draining in your life right now, one invisible day at a time, that you haven't added up yet?
A warehouse. An account. A trust. They all empty the same way — quietly, until someone finally looks at day 42 and asks where days 1 through 41 went.
Copper is shouting now. It was whispering the whole time. So was my account. So, probably, is something in yours.
Go check. Before day 42 becomes the day you finally notice.
#LMECopperStocksFall42DaysLongestSince2014 #Copper #TraderProtectionFund #RiskManagement


📊 #lmecopperstocksfall42dayslongestsince2014 | 42 DIAS DE DRENO DO INVENTÁRIO DE COBRE 📉🔥
Os estoques de cobre da LME caíram por 42 dias consecutivos, marcando uma das quedas mais notáveis em mais de uma década. 👀
Isso é mais do que apenas uma manchete de commodities. A pressão persistente nos estoques pode se tornar um importante sinal para o cenário macro mais amplo.
🔍 POR QUE TRADERS DE CRIPTO DEVERIAM SE IMPORTAR:
1️⃣ A Demanda Está Aumentando: Data centers de IA, eletrificação, veículos elétricos (EVs) e infraestrutura de energia limpa estão impulsionando o aumento da demanda por cobre.
2️⃣ A Pressão Macroeconômica Importa: Com oferta física mais apertada, os preços das commodities podem subir, potencialmente influenciando expectativas de inflação, apostas em juros e liquidez.
3️⃣ A Cripto Pode Reagir: Quando as condições macro mudam, o capital pode girar entre commodities, ações e cripto conforme os investidores buscam a próxima oportunidade.
📌 A GRANDE PERGUNTA AGORA:
Esse aperto no cobre está preparando o terreno para um movimento mais amplo de "risco-on", ou é um alerta inicial de pressão do lado da oferta em mercados globais? 🤔
👇 O que você está acompanhando? Cobre, BTC ou ambos?
$BTC
$ETH
$COPPER
Os estoques de cobre da LME caíram por 42 dias consecutivos, marcando uma das quedas mais notáveis em mais de uma década. 👀
Isso é mais do que apenas uma manchete de commodities. A pressão persistente nos estoques pode se tornar um importante sinal para o cenário macro mais amplo.
🔍 POR QUE TRADERS DE CRIPTO DEVERIAM SE IMPORTAR:
1️⃣ A Demanda Está Aumentando: Data centers de IA, eletrificação, veículos elétricos (EVs) e infraestrutura de energia limpa estão impulsionando o aumento da demanda por cobre.
2️⃣ A Pressão Macroeconômica Importa: Com oferta física mais apertada, os preços das commodities podem subir, potencialmente influenciando expectativas de inflação, apostas em juros e liquidez.
3️⃣ A Cripto Pode Reagir: Quando as condições macro mudam, o capital pode girar entre commodities, ações e cripto conforme os investidores buscam a próxima oportunidade.
📌 A GRANDE PERGUNTA AGORA:
Esse aperto no cobre está preparando o terreno para um movimento mais amplo de "risco-on", ou é um alerta inicial de pressão do lado da oferta em mercados globais? 🤔
👇 O que você está acompanhando? Cobre, BTC ou ambos?
$BTC
$ETH
$COPPER
#LMECopperStocksFall42DaysLongestSince2014 This hashtag suggests: LME copper-related stocks/inventories have fallen for 42 straight days, the longest streak since 2014.
In plain English:
LME = London Metal Exchange
copper stocks usually means exchange-monitored warehouse inventories, not copper mining company shares
fall 42 days means available copper inventory kept declining day after day
longest since 2014 means this kind of persistent drawdown hasn’t been seen in about 12 years
Why people care:
falling inventories can signal tight physical supply
tight supply may support higher copper prices
copper is often viewed as a proxy for industrial demand and economic activity
But this should still be read carefully:
lower inventories do not always mean demand is booming; it can also reflect logistics, warehouse shifts, or regional supply issues
a headline like this says something about inventory trend, not by itself the full outlook for copper prices or miners
So the neutral takeaway is: exchange copper inventories appear to be tightening sharply, which may point to supply tightness and can be bullish for copper, but the broader interpretation depends on demand, mine supply, and macro conditions.$VIC
$HEMI
$COPPER
In plain English:
LME = London Metal Exchange
copper stocks usually means exchange-monitored warehouse inventories, not copper mining company shares
fall 42 days means available copper inventory kept declining day after day
longest since 2014 means this kind of persistent drawdown hasn’t been seen in about 12 years
Why people care:
falling inventories can signal tight physical supply
tight supply may support higher copper prices
copper is often viewed as a proxy for industrial demand and economic activity
But this should still be read carefully:
lower inventories do not always mean demand is booming; it can also reflect logistics, warehouse shifts, or regional supply issues
a headline like this says something about inventory trend, not by itself the full outlook for copper prices or miners
So the neutral takeaway is: exchange copper inventories appear to be tightening sharply, which may point to supply tightness and can be bullish for copper, but the broader interpretation depends on demand, mine supply, and macro conditions.$VIC
$HEMI
$COPPER
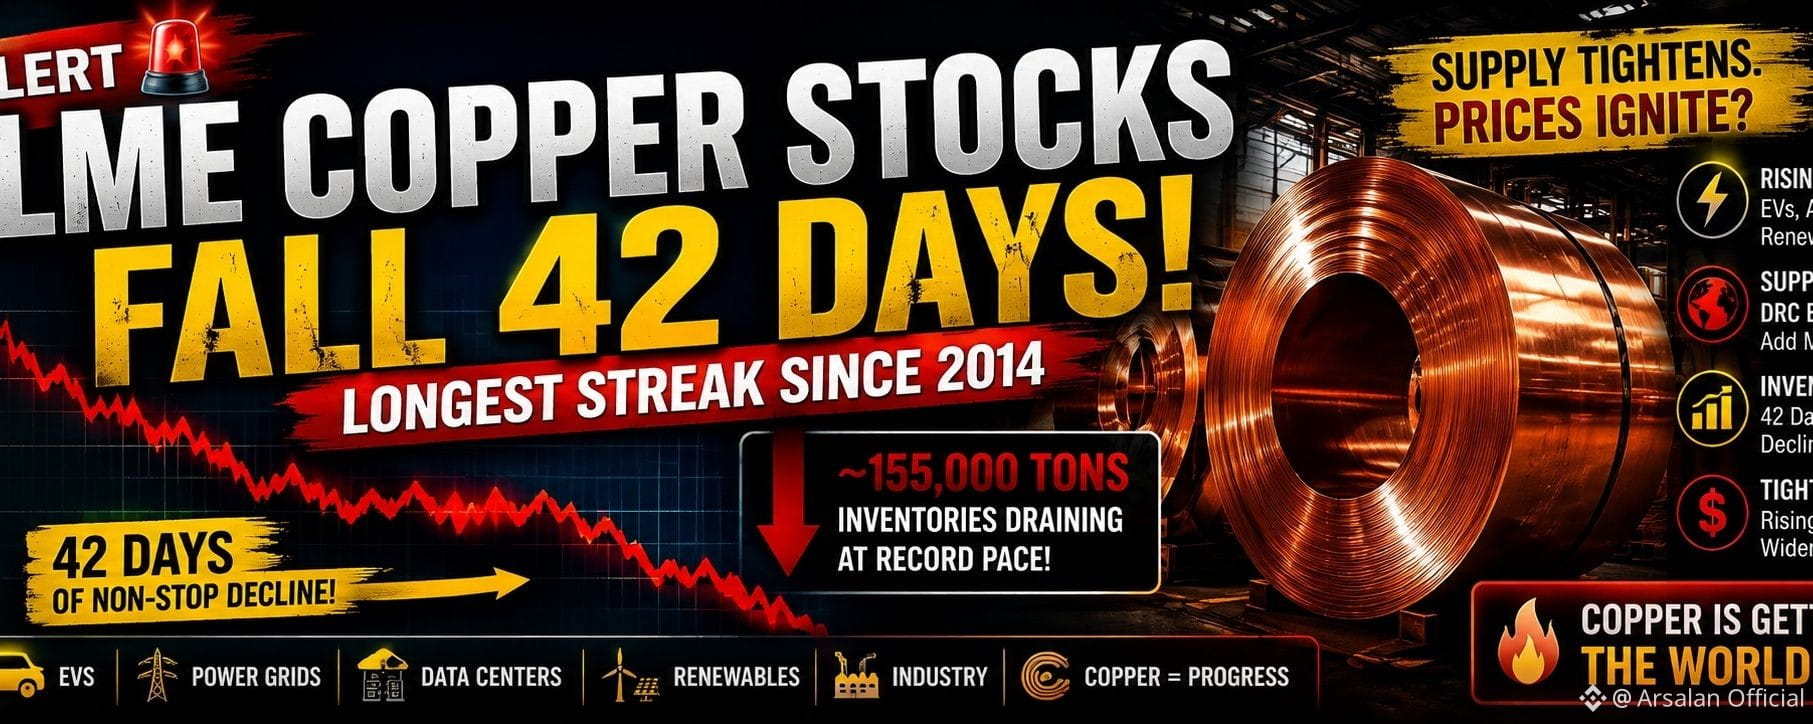

⚡🧲 Copper Supply Pressure Is Getting Harder to Ignore
The LME just recorded its 42nd straight day of declining copper stocks, the longest such streak since 2014. At the same time, the cash-to-three-month spread reached about $434 per tonne, its widest in five years.
That combination points to unusually tight near-term availability—but future prices will still depend on supply, demand and global growth.
A major commodity signal to keep on the radar while tracking spot $ETH and $BNB
#lmecopperstocksfall42dayslongestsince2014
The LME just recorded its 42nd straight day of declining copper stocks, the longest such streak since 2014. At the same time, the cash-to-three-month spread reached about $434 per tonne, its widest in five years.
That combination points to unusually tight near-term availability—but future prices will still depend on supply, demand and global growth.
A major commodity signal to keep on the radar while tracking spot $ETH and $BNB
#lmecopperstocksfall42dayslongestsince2014

#lmecopperstocksfall42dayslongestsince2014 🟠 #LMECOPPERSTOCKSFALL42DAYSLONGESTSINCE2014
LME copper inventories have fallen for 42 consecutive sessions, marking the longest uninterrupted decline since 2014. On August 14, stocks reached about 204,975 tonnes, with nearly half already earmarked for withdrawal.
Why it matters:
📉 Tight inventories: Available LME copper is shrinking rapidly.
🔥 Physical squeeze: Cash copper traded around $14,545/t, while the 3-month contract was about $14,134/t on August 14.
⚡ Large premium: The cash-to-3-month spread reached roughly $411/t, signaling strong demand for immediate metal.
🤖 AI & electrification: Data centers, power infrastructure, EVs and grid investment are adding to long-term copper demand.
🌍 Supply risk: Geopolitical and mining disruptions are making the market more sensitive to additional supply shocks. (
Market takeaway: 🟢 Falling inventories + strong spot premiums are bullish for copper prices in the near term, but they also increase the risk of a sharp correction if physical demand weakens or warehouse stocks begin rebuilding.
For crypto traders, copper is worth watching as a global growth/inflation indicator—but the current move appears to have a significant physical-supply/squeeze component, so it should not automatically be interpreted as a pure risk-on signal.
LME copper inventories have fallen for 42 consecutive sessions, marking the longest uninterrupted decline since 2014. On August 14, stocks reached about 204,975 tonnes, with nearly half already earmarked for withdrawal.
Why it matters:
📉 Tight inventories: Available LME copper is shrinking rapidly.
🔥 Physical squeeze: Cash copper traded around $14,545/t, while the 3-month contract was about $14,134/t on August 14.
⚡ Large premium: The cash-to-3-month spread reached roughly $411/t, signaling strong demand for immediate metal.
🤖 AI & electrification: Data centers, power infrastructure, EVs and grid investment are adding to long-term copper demand.
🌍 Supply risk: Geopolitical and mining disruptions are making the market more sensitive to additional supply shocks. (
Market takeaway: 🟢 Falling inventories + strong spot premiums are bullish for copper prices in the near term, but they also increase the risk of a sharp correction if physical demand weakens or warehouse stocks begin rebuilding.
For crypto traders, copper is worth watching as a global growth/inflation indicator—but the current move appears to have a significant physical-supply/squeeze component, so it should not automatically be interpreted as a pure risk-on signal.

#lmecopperstocksfall42dayslongestsince2014
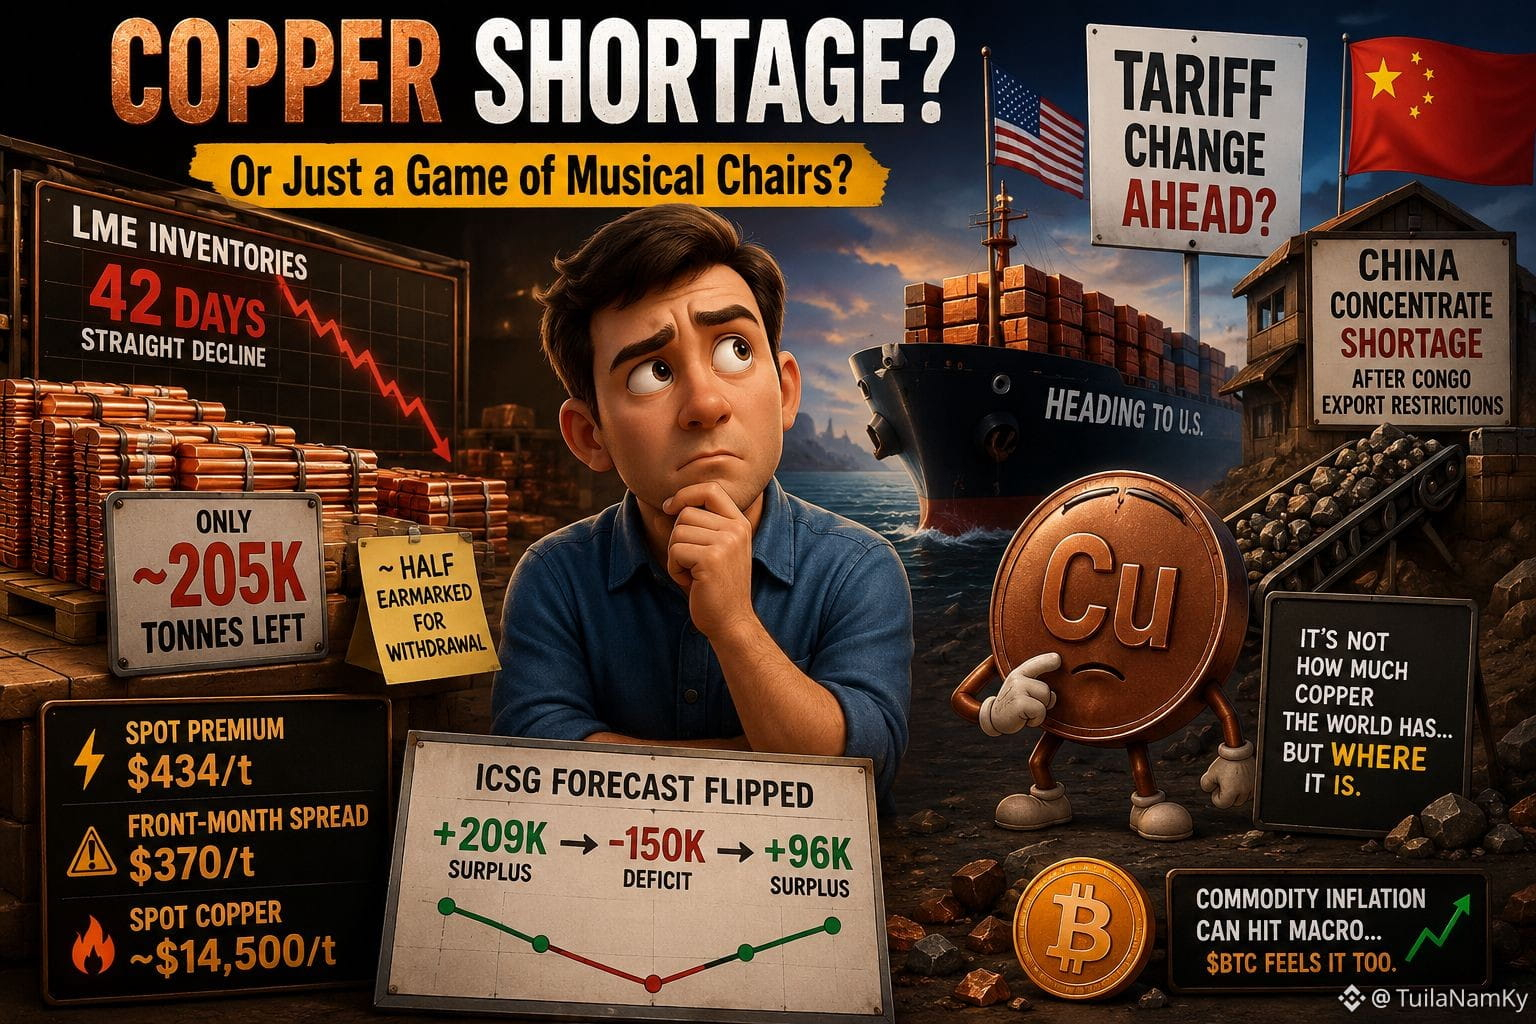
Everyone says “copper shortage.”
But is it? 👀
LME copper inventories have fallen for 42 straight sessions — the longest streak since 2014. Only ~205K tonnes remain, with nearly half earmarked for withdrawal.
The numbers are flashing red:
⚡ Spot premium: $434/t
⚠️ Front-month spread: $370/t
🔥 Spot copper: ~$14,500/t
But here’s the contradiction:
LME inventory shortage ≠ global structural shortage.
Part of the metal is being pulled toward the U.S. ahead of potential tariff changes, while China faces concentrate shortages after Congo’s export restrictions.
Then comes the bigger twist.
ICSG forecasts flipped from:
+209K tonnes surplus → -150K deficit → +96K surplus.
So yes, COPPER can remain bullish. But the reason may be very different from the “global copper is running out” narrative.
The real story may be where the copper is — not how much copper the world has.
And if commodity-driven inflation eventually changes rate expectations, BTC could feel the macro impact.
Is copper facing a genuine structural shortage — or is policy temporarily scrambling where the metal sits? 🤔
#Copper $BTC $COPPER
Everyone says “copper shortage.”
But is it? 👀
LME copper inventories have fallen for 42 straight sessions — the longest streak since 2014. Only ~205K tonnes remain, with nearly half earmarked for withdrawal.
The numbers are flashing red:
⚡ Spot premium: $434/t
⚠️ Front-month spread: $370/t
🔥 Spot copper: ~$14,500/t
But here’s the contradiction:
LME inventory shortage ≠ global structural shortage.
Part of the metal is being pulled toward the U.S. ahead of potential tariff changes, while China faces concentrate shortages after Congo’s export restrictions.
Then comes the bigger twist.
ICSG forecasts flipped from:
+209K tonnes surplus → -150K deficit → +96K surplus.
So yes, COPPER can remain bullish. But the reason may be very different from the “global copper is running out” narrative.
The real story may be where the copper is — not how much copper the world has.
And if commodity-driven inflation eventually changes rate expectations, BTC could feel the macro impact.
Is copper facing a genuine structural shortage — or is policy temporarily scrambling where the metal sits? 🤔
#Copper $BTC $COPPER
⚡🟠 Copper Supply Is Getting Tighter — Why It Matters
A 42-session slide in LME inventories is putting physical copper availability firmly in focus. At the same time, the LME cash-to-three-month premium reached around $434 per tonne, its widest in five years.
Copper is crucial for power grids, electrification and data-center infrastructure, so prolonged supply tightness could remain an important signal for global markets.
Watch next: inventory levels, physical premiums and whether demand can justify these elevated prices.
#lmecopperstocksfall42dayslongestsince2014
A 42-session slide in LME inventories is putting physical copper availability firmly in focus. At the same time, the LME cash-to-three-month premium reached around $434 per tonne, its widest in five years.
Copper is crucial for power grids, electrification and data-center infrastructure, so prolonged supply tightness could remain an important signal for global markets.
Watch next: inventory levels, physical premiums and whether demand can justify these elevated prices.
#lmecopperstocksfall42dayslongestsince2014

Проверено
#lmecopperstocksfall42dayslongestsince2014 Copper stocks in London Metal Exchange warehouses just fell for the 42nd straight day. This is the longest dropping streak since 2014. Total supplies are shrinking fast because industrial demand remains very high. Nearly half of the leftover metal is already booked to be taken out. Experts say this big drop could push copper prices even higher as global supplies get tighter.
CLICK BELOW TO TRADE : $BTC $SOL $EVAA
CLICK BELOW TO TRADE : $BTC $SOL $EVAA
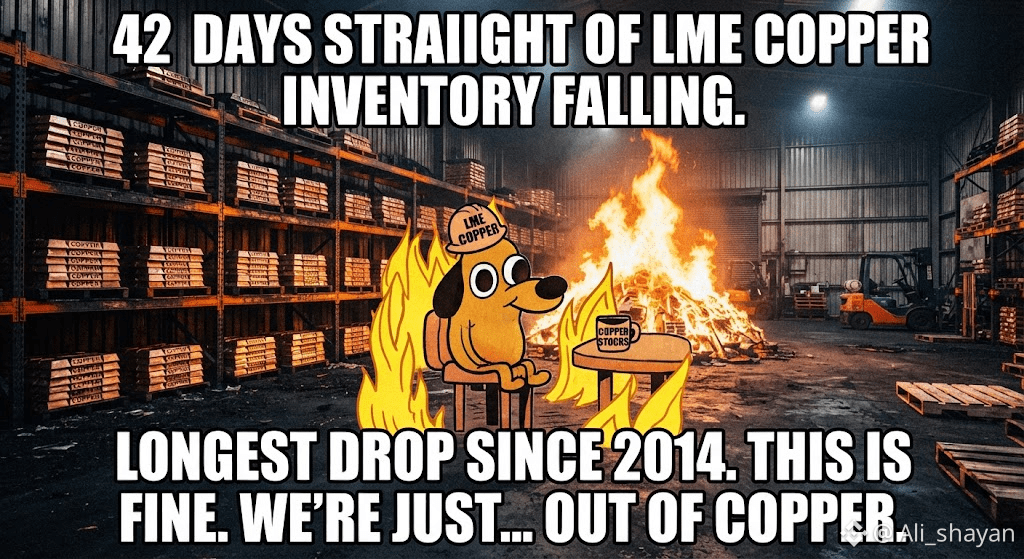
#lmecopperstocksfall42dayslongestsince2014 London Metal Exchange copper stocks just dropped for forty-two straight days. This is the longest continuous decline streak we have seen since 2014. Strong global industrial demand and heavy metal shipments to the US and China are draining warehouse supplies fast. With nearly half of the remaining copper already marked for withdrawal, physical supplies are getting very tight. This major supply squeeze is putting big pressure on the global market.
CLICK BELOW TO TRADE : $BTC $ETH $CL
CLICK BELOW TO TRADE : $BTC $ETH $CL
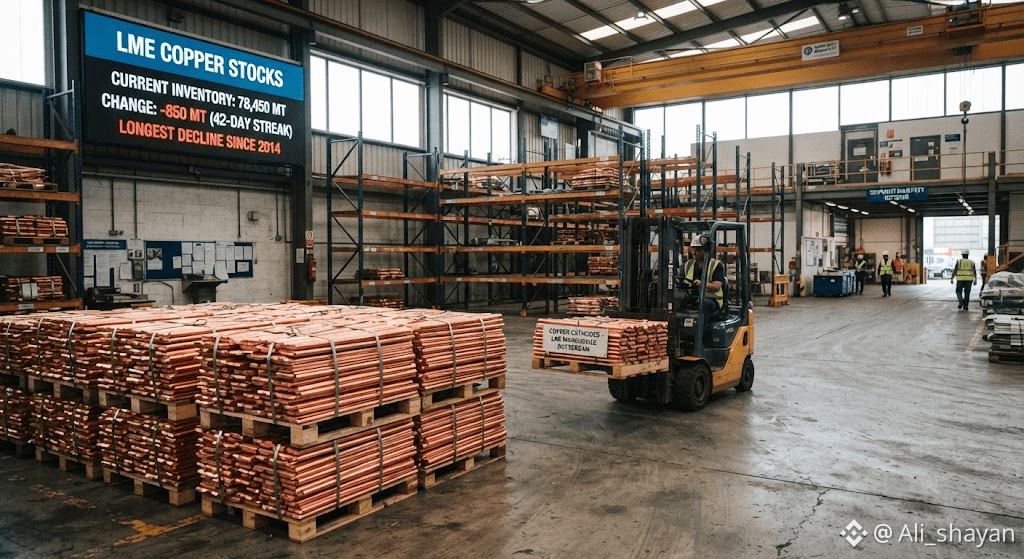
🚨🟠 42 Days of Falling Copper Stocks — What Happens Next?
LME inventories have now declined for 42 straight sessions, while copper prices remain close to record territory. The combination of shrinking warehouse stocks and elevated cash premiums suggests unusually tight near-term supply.
But falling inventories don't automatically guarantee another rally. If demand weakens or fresh supply reaches the market, copper could cool quickly.
The next major signal: whether LME stocks finally stabilize—or continue falling into a deeper supply squeeze.
#lmecopperstocksfall42dayslongestsince2014
LME inventories have now declined for 42 straight sessions, while copper prices remain close to record territory. The combination of shrinking warehouse stocks and elevated cash premiums suggests unusually tight near-term supply.
But falling inventories don't automatically guarantee another rally. If demand weakens or fresh supply reaches the market, copper could cool quickly.
The next major signal: whether LME stocks finally stabilize—or continue falling into a deeper supply squeeze.
#lmecopperstocksfall42dayslongestsince2014
🟠📉 LME Copper Stocks Just Hit a 42-Day Decline
LME copper inventories have fallen for 42 consecutive sessions, the longest uninterrupted decline since 2014. Stocks were reported at about 204,975 tonnes, with nearly half already earmarked for withdrawal.
The squeeze is becoming harder to ignore as immediate copper trades at a substantial premium to future deliveries. The key question now is whether tight inventories can keep pushing prices higher or trigger a sharp correction.
#lmecopperstocksfall42dayslongestsince2014
LME copper inventories have fallen for 42 consecutive sessions, the longest uninterrupted decline since 2014. Stocks were reported at about 204,975 tonnes, with nearly half already earmarked for withdrawal.
The squeeze is becoming harder to ignore as immediate copper trades at a substantial premium to future deliveries. The key question now is whether tight inventories can keep pushing prices higher or trigger a sharp correction.
#lmecopperstocksfall42dayslongestsince2014

#lmecopperstocksfall42dayslongestsince2014
🚨 COPPER’S RALLY ISN’T JUST ABOUT GROWTH! 🟠
Copper inventories have fallen for 42 straight trading days, with physical supply tightening and cash copper trading at a major premium to futures.
Supply disruptions, export restrictions, and metal flows toward the U.S. and China are driving the squeeze — making this rally more of a supply story than a pure global-growth signal.
🎯 TRADING VIEW: BUY 📈
Physical tightness and shrinking inventories support further upside, but traders should watch the upcoming U.S. tariff decision closely.
❓ Is copper heading for a bigger supply-driven squeeze? "CLICK ON THE BELOW YELLOW COIN TAG TO GO TO DESIRED TRADING PAGE TO GET BENEFIT TRADE"$VIC $HEMI $COPPER
#Copper #commodities
🚨 COPPER’S RALLY ISN’T JUST ABOUT GROWTH! 🟠
Copper inventories have fallen for 42 straight trading days, with physical supply tightening and cash copper trading at a major premium to futures.
Supply disruptions, export restrictions, and metal flows toward the U.S. and China are driving the squeeze — making this rally more of a supply story than a pure global-growth signal.
🎯 TRADING VIEW: BUY 📈
Physical tightness and shrinking inventories support further upside, but traders should watch the upcoming U.S. tariff decision closely.
❓ Is copper heading for a bigger supply-driven squeeze? "CLICK ON THE BELOW YELLOW COIN TAG TO GO TO DESIRED TRADING PAGE TO GET BENEFIT TRADE"$VIC $HEMI $COPPER
#Copper #commodities
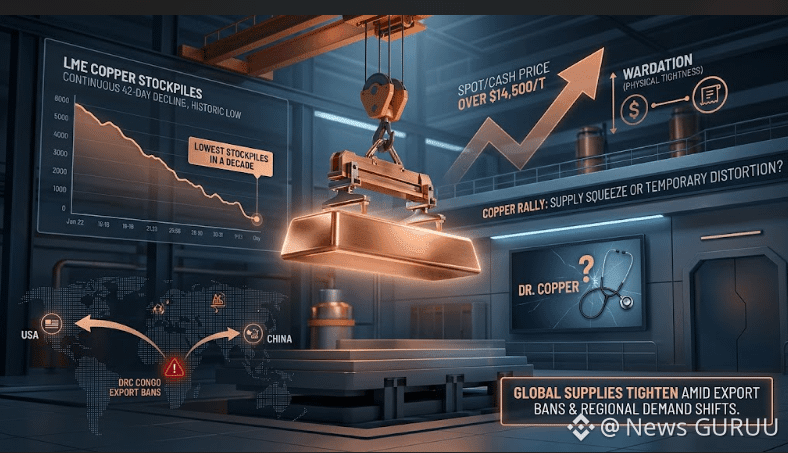

مخزونات النحاس في LME تسجل أطول سلسلة تراجع منذ 2014
$NVDAB $NVDA.US $GOOGL.US #SP500EarningsBeatExpectations #USToPressNationsToPickUSOrChinaAICoalition #SaudiPIFDiscloses154.1MSpaceXShares
#LMECopperStocksFall42DaysLongestSince2014
$NVDAB $NVDA.US $GOOGL.US #SP500EarningsBeatExpectations #USToPressNationsToPickUSOrChinaAICoalition #SaudiPIFDiscloses154.1MSpaceXShares
#LMECopperStocksFall42DaysLongestSince2014
🔮🟠 Copper Tightness Could Keep Pressure on Prices
Prediction: If LME copper inventories continue falling after the 42-day decline streak, near-term copper prices could face further upward pressure as immediately available supply becomes tighter. LME data shows stocks at 204,975 tonnes on August 14, while the cash price traded above the three-month contract—another sign of tight nearby supply.
If the squeeze persists, investors could increasingly watch copper as a signal for industrial demand and inflation expectations, while spot-focused crypto investors monitor $BTC, $ETH and $BNB alongside the broader macro picture. 📊
#lmecopperstocksfall42dayslongestsince2014
Prediction: If LME copper inventories continue falling after the 42-day decline streak, near-term copper prices could face further upward pressure as immediately available supply becomes tighter. LME data shows stocks at 204,975 tonnes on August 14, while the cash price traded above the three-month contract—another sign of tight nearby supply.
If the squeeze persists, investors could increasingly watch copper as a signal for industrial demand and inflation expectations, while spot-focused crypto investors monitor $BTC, $ETH and $BNB alongside the broader macro picture. 📊
#lmecopperstocksfall42dayslongestsince2014
🚨🟠 Copper Supply Pressure Is Building
LME copper inventories have now recorded their longest decline streak since 2014. At the same time, the premium for immediately available copper has widened significantly, highlighting how sensitive the market has become to physical supply.
The key question for investors is whether this tightness persists—or whether additional supply eventually eases the pressure. Meanwhile, spot markets for $BTC, $ETH and $BNB remain worth monitoring.
#lmecopperstocksfall42dayslongestsince2014
LME copper inventories have now recorded their longest decline streak since 2014. At the same time, the premium for immediately available copper has widened significantly, highlighting how sensitive the market has become to physical supply.
The key question for investors is whether this tightness persists—or whether additional supply eventually eases the pressure. Meanwhile, spot markets for $BTC, $ETH and $BNB remain worth monitoring.
#lmecopperstocksfall42dayslongestsince2014
🌍🟠 Copper Becomes a Macro Signal to Watch
Copper isn't just an industrial metal—it is closely watched for clues about manufacturing, infrastructure and global economic activity. The current 42-day LME inventory decline adds another layer to a market already dealing with supply disruptions and strong physical demand.
For investors taking a straightforward spot approach, developments in commodities can provide useful context when evaluating $BTC, $ETH and $SOL.
#lmecopperstocksfall42dayslongestsince2014
Copper isn't just an industrial metal—it is closely watched for clues about manufacturing, infrastructure and global economic activity. The current 42-day LME inventory decline adds another layer to a market already dealing with supply disruptions and strong physical demand.
For investors taking a straightforward spot approach, developments in commodities can provide useful context when evaluating $BTC, $ETH and $SOL.
#lmecopperstocksfall42dayslongestsince2014
🏭📊 Why Are Copper Inventories Shrinking?
A 42-day decline in LME copper stocks is putting the physical supply market under the spotlight. Earlier data also showed LME inventories falling sharply while Chinese copper imports reached a nine-month high, suggesting strong demand is contributing to tighter available supplies.
That makes copper an important macro indicator alongside major spot assets such as $BTC, $BNB and $ETH.
#lmecopperstocksfall42dayslongestsince2014
A 42-day decline in LME copper stocks is putting the physical supply market under the spotlight. Earlier data also showed LME inventories falling sharply while Chinese copper imports reached a nine-month high, suggesting strong demand is contributing to tighter available supplies.
That makes copper an important macro indicator alongside major spot assets such as $BTC, $BNB and $ETH.
#lmecopperstocksfall42dayslongestsince2014
Войдите, чтобы посмотреть больше материала