
#goldtechnicalanalysis
goldtechnicalanalysis
Просмотров: 762
7 обсуждают
Популярные
Новые


·
--

Статья
GOLD (XAU/USD) — New York Session Market Analysis, Key Levels & Trading Outlook🟡 GOLD (XAU/USD) — New York Session Day-Trading Plan
Gold closed the latest session around $4,290, down roughly 1.4%, with the stronger USD and 10-year Treasury yield above 5% keeping pressure on XAU/USD. The Fed decision tomorrow is also likely to increase volatility.
🕯️ Key NY Levels
📉 Short Setup
🔻 If NY price breaks $4,305 and a 5/15-minute candle closes below it, wait for a retest.
🎯 Targets: $4,280 → $4,250 → $4,235.
📈 Long Setup
🟢 If price breaks and holds above $4,360, wait for a bullish retest.
🎯 Targets: $4,395 → $4,420.
🟡 Range Setup
If gold remains between $4,305–$4,360, avoid chasing trades in the middle. Wait for a liquidity sweep and confirmation at either boundary.
🇺🇸 What to Watch in New York
💵 DXY: Continued strength favors sellers.
📈 10Y yield: Above 5% remains a major headwind for gold.
🛢️ Oil: Above $100 is increasing inflation/rate-hike concerns.
🏦 Fed: Markets are pricing about a 93% probability of a rate hike, making Wednesday's decision a major volatility catalyst.
🎯 Day-Trader Bias
🔴 Below $4,360 = bearish preference
🟢 Above $4,360 = bullish recovery potential
🔻 Below $4,305 = stronger short opportunity
⚠️ For the next NY session, prioritize break → retest → confirmation rather than entering immediately after a large candle. Fed-related volatility makes false breakouts particularly dangerous.
📢 This content is for informational and educational purposes only and does not constitute financial, investment, trading, or legal advice.
#GoldTrading #XAUUSD #GoldPriceAnalysis #GoldTechnicalAnalysis
$XAU
{future}(XAUUSDT)
GOLD (XAU/USD) — New York Session Market Analysis, Key Levels & Trading Outlook
🟡 GOLD (XAU/USD) — New York Session Day-Trading Plan
Gold closed the latest session around $4,290, down roughly 1.4%, with the stronger USD and 10-year Treasury yield above 5% keeping pressure on XAU/USD. The Fed decision tomorrow is also likely to increase volatility.
🕯️ Key NY Levels
📉 Short Setup
🔻 If NY price breaks $4,305 and a 5/15-minute candle closes below it, wait for a retest.
🎯 Targets: $4,280 → $4,250 → $4,235.
📈 Long Setup
🟢 If price breaks and holds above $4,360, wait for a bullish retest.
🎯 Targets: $4,395 → $4,420.
🟡 Range Setup
If gold remains between $4,305–$4,360, avoid chasing trades in the middle. Wait for a liquidity sweep and confirmation at either boundary.
🇺🇸 What to Watch in New York
💵 DXY: Continued strength favors sellers.
📈 10Y yield: Above 5% remains a major headwind for gold.
🛢️ Oil: Above $100 is increasing inflation/rate-hike concerns.
🏦 Fed: Markets are pricing about a 93% probability of a rate hike, making Wednesday's decision a major volatility catalyst.
🎯 Day-Trader Bias
🔴 Below $4,360 = bearish preference
🟢 Above $4,360 = bullish recovery potential
🔻 Below $4,305 = stronger short opportunity
⚠️ For the next NY session, prioritize break → retest → confirmation rather than entering immediately after a large candle. Fed-related volatility makes false breakouts particularly dangerous.
📢 This content is for informational and educational purposes only and does not constitute financial, investment, trading, or legal advice.
#GoldTrading #XAUUSD #GoldPriceAnalysis #GoldTechnicalAnalysis
$XAU
Gold closed the latest session around $4,290, down roughly 1.4%, with the stronger USD and 10-year Treasury yield above 5% keeping pressure on XAU/USD. The Fed decision tomorrow is also likely to increase volatility.
🕯️ Key NY Levels
📉 Short Setup
🔻 If NY price breaks $4,305 and a 5/15-minute candle closes below it, wait for a retest.
🎯 Targets: $4,280 → $4,250 → $4,235.
📈 Long Setup
🟢 If price breaks and holds above $4,360, wait for a bullish retest.
🎯 Targets: $4,395 → $4,420.
🟡 Range Setup
If gold remains between $4,305–$4,360, avoid chasing trades in the middle. Wait for a liquidity sweep and confirmation at either boundary.
🇺🇸 What to Watch in New York
💵 DXY: Continued strength favors sellers.
📈 10Y yield: Above 5% remains a major headwind for gold.
🛢️ Oil: Above $100 is increasing inflation/rate-hike concerns.
🏦 Fed: Markets are pricing about a 93% probability of a rate hike, making Wednesday's decision a major volatility catalyst.
🎯 Day-Trader Bias
🔴 Below $4,360 = bearish preference
🟢 Above $4,360 = bullish recovery potential
🔻 Below $4,305 = stronger short opportunity
⚠️ For the next NY session, prioritize break → retest → confirmation rather than entering immediately after a large candle. Fed-related volatility makes false breakouts particularly dangerous.
📢 This content is for informational and educational purposes only and does not constitute financial, investment, trading, or legal advice.
#GoldTrading #XAUUSD #GoldPriceAnalysis #GoldTechnicalAnalysis
$XAU
1
4
322

·
--
Падение
𝗫𝗔𝗨𝗨𝗦𝗗 (𝗚𝗼𝗹𝗱) — 𝗧𝗘𝗖𝗛𝗡𝗜𝗖𝗔𝗟 𝗦𝗛𝗢𝗥𝗧 𝗦𝗘𝗧𝗨𝗣🔥🚀 𝗚𝗢𝗟𝗗 𝗕𝗥𝗘𝗔𝗞𝗦 𝗧𝗛𝗘 𝗡𝗘𝗖𝗞𝗟𝗜𝗡𝗘: 𝗠𝗔𝗥𝗞𝗘𝗧 𝗠𝗔𝗞𝗘𝗥𝗦 𝗧𝗔𝗥𝗚𝗘𝗧 𝗧𝗛𝗘 𝗟𝗢𝗪𝗘𝗥 𝗟𝗜𝗤𝗨𝗜𝗗𝗜𝗧𝗬 𝗖𝗟𝗨𝗦𝗧𝗘𝗥𝗦
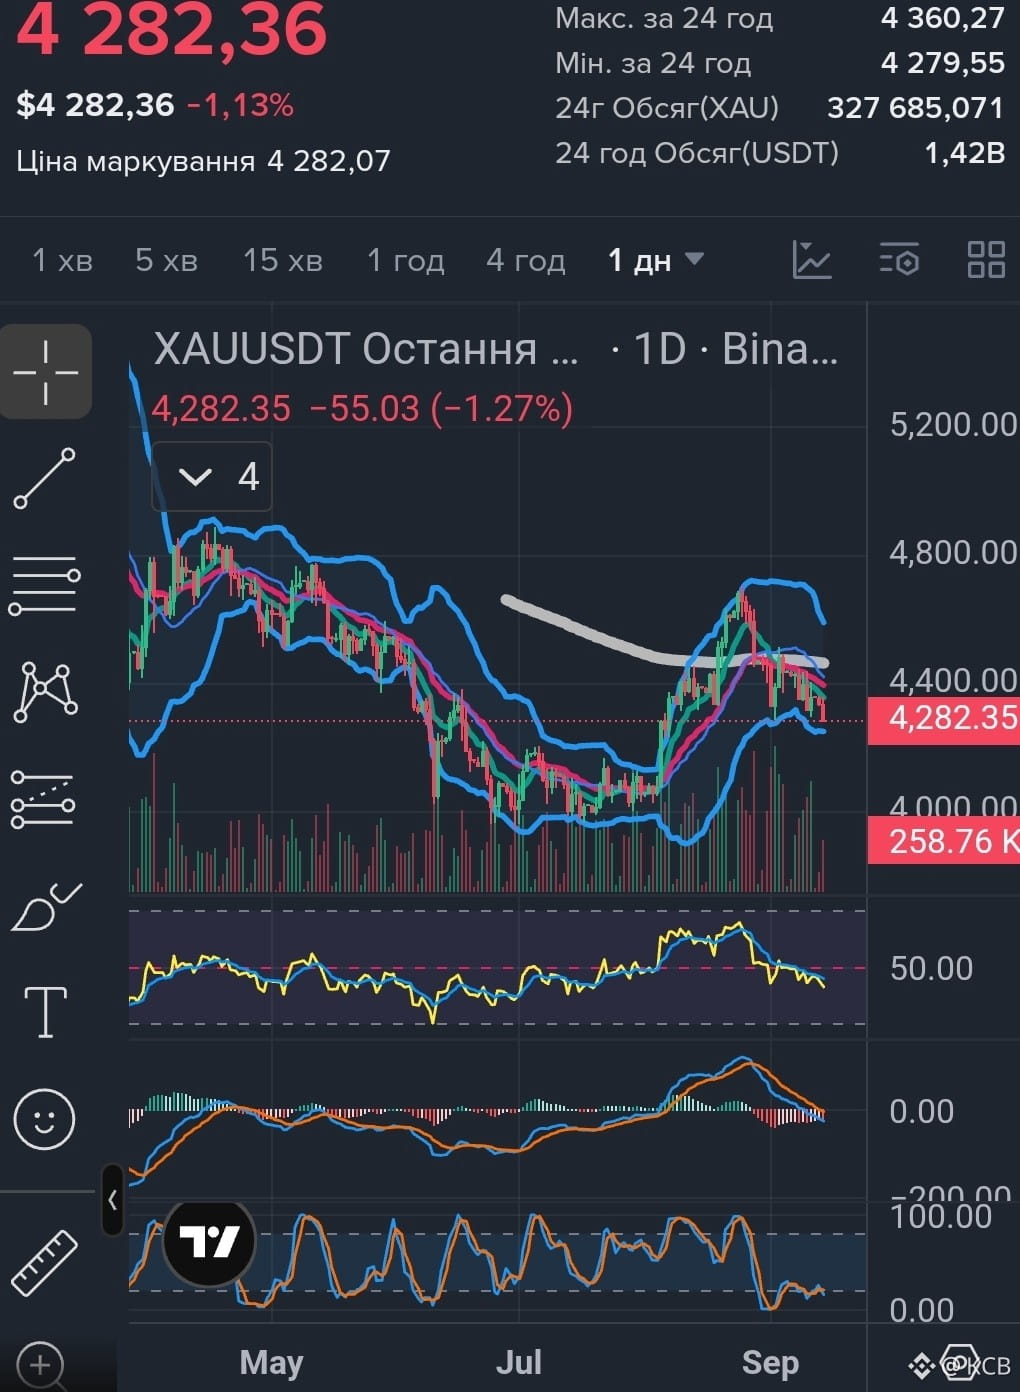
Gold $XAU spot price has initiated a clean structural breakdown on the four-hour chart. The price heavily lost the crucial forty-three hundred psychological level and officially triggered a bearish head-and-shoulders neckline pattern. This decisive candle close below the macro support cluster confirms that sellers have taken absolute technical control over the near-term trend.
From an order book perspective, the path of least resistance is now pointing aggressively downward. The liquidation heatmap indicates that the next major cluster of leveraged buyer stops is resting within the forty-two hundred seventy-six to forty-two hundred eighty-six Gold Zone. We strictly forbid buying this local dip. Instead, we wait for a dead-cat bounce to fill our limit sell orders at the broken structural retest block.
➡️ 𝗗𝗜𝗥𝗘𝗖𝗧𝗜𝗢𝗡: Short
➡️ 𝗠𝗔𝗥𝗚𝗜𝗡 𝗧𝗬𝗣𝗘: Isolated
➡️ 𝗟𝗘𝗩𝗘𝗥𝗔𝗚𝗘: 20x - 30x
➡️ 𝗘𝗡𝗧𝗥𝗬 𝗭𝗢𝗡𝗘 (𝗟𝗜𝗠𝗜𝗧𝗦): 4312 - 4328
🎯 𝗧𝗔𝗞𝗘 𝗣𝗥𝗢𝗙𝗜𝗧 𝟭: 4282 (Neckline Targets and Immediate Support)
🎯 𝗧𝗔𝗞𝗘 𝗣𝗥𝗢𝗙𝗜𝗧 𝟮: 4240 (Core Trend Support Level)
🎯 𝗧𝗔𝗞𝗘 𝗣𝗥𝗢𝗙𝗜𝗧 𝟯: 4155 (Macro Target Zone Liquidation Pool)
🛑 𝗦𝗧𝗢𝗣 𝗟𝗢𝗦𝗦: 4354
Disclaimer: Not financial advice. Do your own research (DYOR).
#XAUUSDTradingAnalysis #GoldTechnicalAnalysis #TradingSignals
𝗫𝗔𝗨𝗨𝗦𝗗 (𝗚𝗼𝗹𝗱) — 𝗧𝗘𝗖𝗛𝗡𝗜𝗖𝗔𝗟 𝗦𝗛𝗢𝗥𝗧 𝗦𝗘𝗧𝗨𝗣🔥🚀 𝗚𝗢𝗟𝗗 𝗕𝗥𝗘𝗔𝗞𝗦 𝗧𝗛𝗘 𝗡𝗘𝗖𝗞𝗟𝗜𝗡𝗘: 𝗠𝗔𝗥𝗞𝗘𝗧 𝗠𝗔𝗞𝗘𝗥𝗦 𝗧𝗔𝗥𝗚𝗘𝗧 𝗧𝗛𝗘 𝗟𝗢𝗪𝗘𝗥 𝗟𝗜𝗤𝗨𝗜𝗗𝗜𝗧𝗬 𝗖𝗟𝗨𝗦𝗧𝗘𝗥𝗦
Gold $XAU spot price has initiated a clean structural breakdown on the four-hour chart. The price heavily lost the crucial forty-three hundred psychological level and officially triggered a bearish head-and-shoulders neckline pattern. This decisive candle close below the macro support cluster confirms that sellers have taken absolute technical control over the near-term trend.
From an order book perspective, the path of least resistance is now pointing aggressively downward. The liquidation heatmap indicates that the next major cluster of leveraged buyer stops is resting within the forty-two hundred seventy-six to forty-two hundred eighty-six Gold Zone. We strictly forbid buying this local dip. Instead, we wait for a dead-cat bounce to fill our limit sell orders at the broken structural retest block.
➡️ 𝗗𝗜𝗥𝗘𝗖𝗧𝗜𝗢𝗡: Short
➡️ 𝗠𝗔𝗥𝗚𝗜𝗡 𝗧𝗬𝗣𝗘: Isolated
➡️ 𝗟𝗘𝗩𝗘𝗥𝗔𝗚𝗘: 20x - 30x
➡️ 𝗘𝗡𝗧𝗥𝗬 𝗭𝗢𝗡𝗘 (𝗟𝗜𝗠𝗜𝗧𝗦): 4312 - 4328
🎯 𝗧𝗔𝗞𝗘 𝗣𝗥𝗢𝗙𝗜𝗧 𝟭: 4282 (Neckline Targets and Immediate Support)
🎯 𝗧𝗔𝗞𝗘 𝗣𝗥𝗢𝗙𝗜𝗧 𝟮: 4240 (Core Trend Support Level)
🎯 𝗧𝗔𝗞𝗘 𝗣𝗥𝗢𝗙𝗜𝗧 𝟯: 4155 (Macro Target Zone Liquidation Pool)
🛑 𝗦𝗧𝗢𝗣 𝗟𝗢𝗦𝗦: 4354
Disclaimer: Not financial advice. Do your own research (DYOR).
#XAUUSDTradingAnalysis #GoldTechnicalAnalysis #TradingSignals
Gold $XAU spot price has initiated a clean structural breakdown on the four-hour chart. The price heavily lost the crucial forty-three hundred psychological level and officially triggered a bearish head-and-shoulders neckline pattern. This decisive candle close below the macro support cluster confirms that sellers have taken absolute technical control over the near-term trend.
From an order book perspective, the path of least resistance is now pointing aggressively downward. The liquidation heatmap indicates that the next major cluster of leveraged buyer stops is resting within the forty-two hundred seventy-six to forty-two hundred eighty-six Gold Zone. We strictly forbid buying this local dip. Instead, we wait for a dead-cat bounce to fill our limit sell orders at the broken structural retest block.
➡️ 𝗗𝗜𝗥𝗘𝗖𝗧𝗜𝗢𝗡: Short
➡️ 𝗠𝗔𝗥𝗚𝗜𝗡 𝗧𝗬𝗣𝗘: Isolated
➡️ 𝗟𝗘𝗩𝗘𝗥𝗔𝗚𝗘: 20x - 30x
➡️ 𝗘𝗡𝗧𝗥𝗬 𝗭𝗢𝗡𝗘 (𝗟𝗜𝗠𝗜𝗧𝗦): 4312 - 4328
🎯 𝗧𝗔𝗞𝗘 𝗣𝗥𝗢𝗙𝗜𝗧 𝟭: 4282 (Neckline Targets and Immediate Support)
🎯 𝗧𝗔𝗞𝗘 𝗣𝗥𝗢𝗙𝗜𝗧 𝟮: 4240 (Core Trend Support Level)
🎯 𝗧𝗔𝗞𝗘 𝗣𝗥𝗢𝗙𝗜𝗧 𝟯: 4155 (Macro Target Zone Liquidation Pool)
🛑 𝗦𝗧𝗢𝗣 𝗟𝗢𝗦𝗦: 4354
Disclaimer: Not financial advice. Do your own research (DYOR).
#XAUUSDTradingAnalysis #GoldTechnicalAnalysis #TradingSignals
1
151
·
--
Проверено

Статья
GOLD (XAU/USD) — NEW YORK SESSION DAY-TRADING ANALYSIS & GAME PLAN🥇 GOLD (XAU/USD) — NEW YORK SESSION DAY-TRADING PLAN
📅 September 10, 2026
📊 Market Overview
🟡 Gold is trading around $4,390–$4,400/oz after Wednesday’s strong rebound from approximately $4,342.
📈 Wednesday’s bullish candle pushed price toward $4,434, making this the key breakout level.
⚠️ Today’s U.S. PPI release at 8:30 AM ET could create significant volatility.
🕯️ Key Levels
🔴 Resistance: $4,418 → $4,434 → $4,450
🟡 Pivot: $4,400
🟢 Support: $4,380 → $4,360 → $4,340
🔵 Major downside: $4,310–$4,305
XAU/USD Key Trading Zones
Illustrative price levels for today's New York session based on the latest market structure.
Levels are scenario zones, not guaranteed targets.
📈 Bullish Setup
🟢 Above $4,400–$4,418, buyers remain favored.
🚀 A confirmed break above $4,434 could target $4,450–$4,475.
🕯️ Wait for a 5–15 minute candle confirmation/retest before entering.
📉 Bearish Setup
🔴 Rejection around $4,400–$4,418 could send gold toward $4,380 → $4,360.
💥 A decisive break below $4,340 could expose $4,310–$4,305.
🇺🇸 NY Session Game Plan
⏰ 8:30 AM ET: PPI/news volatility — avoid chasing the first spike.
🕯️ Let the initial move settle, then trade the confirmed breakout or reversal.
💵 Watch DXY and Treasury yields alongside gold.
⚠️ Keep leverage and position size controlled during the data release.
🎯 Overall Bias
🟢 Bullish above $4,418
🟡 Neutral between $4,380–$4,418
🔴 Bearish below $4,380
💥 Strong bearish confirmation below $4,340
🏷️ #XAUUSD #GoldDayTrading #NewYorkSessionTrading #GoldTechnicalAnalysis #GoldPriceAnalysis
$XAU
{future}(XAUUSDT)
GOLD (XAU/USD) — NEW YORK SESSION DAY-TRADING ANALYSIS & GAME PLAN
🥇 GOLD (XAU/USD) — NEW YORK SESSION DAY-TRADING PLAN
📅 September 10, 2026
📊 Market Overview
🟡 Gold is trading around $4,390–$4,400/oz after Wednesday’s strong rebound from approximately $4,342.
📈 Wednesday’s bullish candle pushed price toward $4,434, making this the key breakout level.
⚠️ Today’s U.S. PPI release at 8:30 AM ET could create significant volatility.
🕯️ Key Levels
🔴 Resistance: $4,418 → $4,434 → $4,450
🟡 Pivot: $4,400
🟢 Support: $4,380 → $4,360 → $4,340
🔵 Major downside: $4,310–$4,305
XAU/USD Key Trading Zones
Illustrative price levels for today's New York session based on the latest market structure.
Levels are scenario zones, not guaranteed targets.
📈 Bullish Setup
🟢 Above $4,400–$4,418, buyers remain favored.
🚀 A confirmed break above $4,434 could target $4,450–$4,475.
🕯️ Wait for a 5–15 minute candle confirmation/retest before entering.
📉 Bearish Setup
🔴 Rejection around $4,400–$4,418 could send gold toward $4,380 → $4,360.
💥 A decisive break below $4,340 could expose $4,310–$4,305.
🇺🇸 NY Session Game Plan
⏰ 8:30 AM ET: PPI/news volatility — avoid chasing the first spike.
🕯️ Let the initial move settle, then trade the confirmed breakout or reversal.
💵 Watch DXY and Treasury yields alongside gold.
⚠️ Keep leverage and position size controlled during the data release.
🎯 Overall Bias
🟢 Bullish above $4,418
🟡 Neutral between $4,380–$4,418
🔴 Bearish below $4,380
💥 Strong bearish confirmation below $4,340
🏷️ #XAUUSD #GoldDayTrading #NewYorkSessionTrading #GoldTechnicalAnalysis #GoldPriceAnalysis
$XAU
📅 September 10, 2026
📊 Market Overview
🟡 Gold is trading around $4,390–$4,400/oz after Wednesday’s strong rebound from approximately $4,342.
📈 Wednesday’s bullish candle pushed price toward $4,434, making this the key breakout level.
⚠️ Today’s U.S. PPI release at 8:30 AM ET could create significant volatility.
🕯️ Key Levels
🔴 Resistance: $4,418 → $4,434 → $4,450
🟡 Pivot: $4,400
🟢 Support: $4,380 → $4,360 → $4,340
🔵 Major downside: $4,310–$4,305
XAU/USD Key Trading Zones
Illustrative price levels for today's New York session based on the latest market structure.
Levels are scenario zones, not guaranteed targets.
📈 Bullish Setup
🟢 Above $4,400–$4,418, buyers remain favored.
🚀 A confirmed break above $4,434 could target $4,450–$4,475.
🕯️ Wait for a 5–15 minute candle confirmation/retest before entering.
📉 Bearish Setup
🔴 Rejection around $4,400–$4,418 could send gold toward $4,380 → $4,360.
💥 A decisive break below $4,340 could expose $4,310–$4,305.
🇺🇸 NY Session Game Plan
⏰ 8:30 AM ET: PPI/news volatility — avoid chasing the first spike.
🕯️ Let the initial move settle, then trade the confirmed breakout or reversal.
💵 Watch DXY and Treasury yields alongside gold.
⚠️ Keep leverage and position size controlled during the data release.
🎯 Overall Bias
🟢 Bullish above $4,418
🟡 Neutral between $4,380–$4,418
🔴 Bearish below $4,380
💥 Strong bearish confirmation below $4,340
🏷️ #XAUUSD #GoldDayTrading #NewYorkSessionTrading #GoldTechnicalAnalysis #GoldPriceAnalysis
$XAU
1
6
893
·
--

Статья
GOLD (XAU/USD) — NEW YORK SESSION DAY-TRADING ANALYSIS & MONDAY GAME PLAN🥇📅 Sunday, August 30, 2026 | Preparing for Monday, August 31, 2026
🕯️ 📌 IMPORTANT: THERE IS NO REGULAR NEW YORK GOLD SESSION TODAY
🔔 Today is Sunday, August 30, so the regular U.S. New York gold session is closed.
📌 The latest completed New York session was Friday, August 28, and Friday's price action is the key reference for Monday's trading plan.
⚠️ Gold experienced a very large bearish move on Friday, making Monday's reaction particularly important for day traders.
🥇🔥 1. FRIDAY'S GOLD MARKET — THE BIG PICTURE
🔴 Gold experienced a major bearish reversal on Friday, with XAU/USD falling from approximately $4,630 toward $4,445 and closing around $4,455.
📉 The approximately $185 intraday range demonstrates exceptionally high volatility and indicates aggressive selling pressure.
🔴 Friday's close near the lower end of the daily range suggests that sellers maintained control into the New York close.
⚠️ This was not simply a normal pullback — it was a strong bearish displacement that broke short-term market structure.
💡 For Monday, traders should therefore avoid assuming that every dip is automatically a buying opportunity.
🕯️📉 2. FRIDAY'S NEW YORK CANDLE STRUCTURE
🔴 Approximate Friday high: $4,630
🔴 Approximate Friday low: $4,445
🔴 Approximate Friday close: $4,455
⚡ Approximate daily range: $185
📌 The most important observation is that sellers pushed price aggressively lower and prevented a meaningful recovery before the close.
🏦⚠️ 3. WHY DID GOLD SELL OFF SO AGGRESSIVELY?
🏦 The Federal Reserve's increasingly hawkish interest-rate outlook was the major fundamental catalyst behind Friday's sell-off.
📈 Higher expected U.S. interest rates generally increase Treasury yields and strengthen the dollar, both of which can pressure gold.
💵 A stronger U.S. dollar also creates additional downside pressure for XAU/USD because gold is priced in dollars.
📉 The combination of stronger rate expectations, higher yields, and dollar strength created an unfavorable environment for gold buyers.
⚡ Once technical support levels began breaking, stop-loss orders and long liquidation likely amplified the decline.
🔴📊 4. THE MOST IMPORTANT MONDAY PRICE LEVELS
🔴🔥 5. $4,445 — THE MOST IMPORTANT BEARISH LEVEL
🚨 $4,445 is Friday's low and should be one of the first levels marked on your Monday chart.
📉 A decisive New York-session break below $4,445 could indicate that Friday's bearish momentum is continuing.
🔄 However, traders should avoid selling the first candle that breaks $4,445.
🎯 The higher-quality setup would be a break below $4,445 followed by a bounce back toward $4,445–$4,455 and then a bearish rejection.
📌 That creates the classic: BREAK → RETEST → REJECTION setup.
🟡🔥 6. $4,500 — THE PSYCHOLOGICAL BATTLEFIELD
💰 $4,500 is extremely important because it is a major round-number psychological level.
🔴 If gold remains below $4,500, the short-term bearish bias remains stronger.
🟢 If gold reclaims $4,500 and begins holding above it, sellers should become more cautious.
⚠️ A temporary move above $4,500 does not automatically mean a bullish reversal.
📌 You want to see price acceptance above the level, preferably through multiple 5M/15M candles and a successful retest.
🔴🧱 7. $4,570–$4,600 — MAJOR SELLER ZONE
🚨 This is arguably the most important resistance region for Monday.
📈 If gold rallies from the lows into $4,570–$4,600, watch carefully for seller reaction.
🔻 A bearish engulfing candle, long upper wick, lower high, or 5M/15M structure break could provide a short confirmation.
🎯 A rejection from this region could target $4,530 → $4,500 → $4,455 → $4,445.
🚀 Conversely, a strong New York breakout and sustained acceptance above $4,600 would weaken the immediate bearish thesis.
🔴📉 8. MONDAY BEARISH SCENARIO — PREFERRED SETUP
🔴 My initial short-term bias is bearish while gold remains below approximately $4,500–$4,600.
📈 The preferred setup is NOT to chase gold lower after a large bearish candle.
🎯 Instead, wait for a retracement toward resistance.
🔻 Potential Short Setup
📍 Entry zone to monitor: $4,500–$4,570
👀 Wait for: liquidity sweep + rejection + lower high + bearish market-structure break.
🎯 Potential targets:
🔻 TP1: $4,455
🔻 TP2: $4,445
🔻 TP3: $4,392
🔻 TP4: $4,328
⚠️ The exact entry should come from price confirmation rather than simply because price reaches one of these numbers.
🔥📉 9. BREAKDOWN SCENARIO BELOW $4,445
🚨 If New York sellers push XAU/USD below $4,445 with strong momentum, the bearish continuation scenario becomes significantly stronger.
📉 The ideal setup would be a 15-minute candle closing below $4,445 followed by a failed retest.
🎯 Potential downside zones then become approximately $4,420, $4,392, $4,360 and $4,328.
⚠️ Do NOT chase an extended bearish candle because gold can quickly retrace $10–$30 after a liquidity-driven move.
🧠 Patience after the breakdown is more important than catching the first few dollars of the move.
🟢🚀 10. MONDAY BULLISH REVERSAL SCENARIO
🟢 Friday's sell-off does not guarantee that Monday will continue lower.
🔄 A large bearish candle can sometimes produce a powerful short squeeze or relief rally.
📈 The bullish scenario becomes increasingly interesting if $4,445 holds and buyers reclaim $4,500.
🚀 A sequence of $4,500 → $4,530 → $4,570 → $4,600 would show progressively stronger recovery.
💪 A 15M/30M close above $4,600 followed by a successful retest would provide substantially stronger evidence of bullish reversal.
🎯 Upside levels to monitor would then be $4,630 → $4,650 → $4,690–$4,700.
🚨🧠 11. DO NOT CONFUSE A BOUNCE WITH A REVERSAL
⚠️ This is one of the most important points for Monday.
📈 Gold can rally $30–$60 and still remain inside a larger bearish structure.
🔴 A bounce into $4,570–$4,600 does not automatically mean "BUY."
🧠 The question is whether buyers can actually establish acceptance above resistance.
📌 Always distinguish between a temporary retracement and a genuine market-structure reversal.
💵📊 12. WATCH DXY ALONGSIDE GOLD
💵 Keep the U.S. Dollar Index (DXY) on a second chart while trading XAU/USD.
🔴 If DXY rises while gold falls, the bearish gold setup receives additional fundamental confirmation.
🟢 If DXY falls while gold rises, gold's recovery has stronger confirmation.
⚠️ DXY should be used as confirmation rather than as a standalone entry signal.
🏦📈 13. WATCH U.S. TREASURY YIELDS
🏦 U.S. Treasury yields are particularly important after Friday's rate-driven sell-off.
📈 Rising yields can create additional pressure on non-yielding gold.
📉 Falling yields can provide gold with breathing room and support a recovery.
🔎 For Monday, compare XAU/USD with DXY and Treasury yields before taking aggressive positions.
🕐🇺🇸 14. NEW YORK SESSION TRADING PLAN
🕣 08:30–09:00 ET — OPENING VOLATILITY
⚡ Expect fast moves and potential liquidity grabs around the New York open.
📌 Mark the Asian high and low, London high and low, Friday high, Friday low, and Monday's opening range.
🚫 Avoid entering simply because the first candle is large.
🕘 09:00–10:30 ET — PRIMARY EXECUTION WINDOW
🎯 This is where I would look for the cleanest directional setup.
🔎 Look for: LIQUIDITY SWEEP → DISPLACEMENT → RETEST → ENTRY.
🔴 If price sweeps a high and aggressively reverses, look for a short structure.
🟢 If price sweeps a low and aggressively recovers, look for a bullish structure.
🕥 10:30–12:00 ET — TREND CONFIRMATION
📊 If the trend remains strong, continuation setups can develop.
⚠️ If price begins consolidating around $4,500–$4,530, avoid excessive entries and unnecessary scalping.
🧠 A trader's job is not to trade every candle — it is to trade the highest-quality setups.
🧠🔥 15. MONDAY'S THREE MARKET CONDITIONS
🔴 BELOW $4,500 — BEARISH
📉 Favor selling rallies rather than buying dips.
🔻 Look for lower highs, failed resistance, bearish engulfing candles, and structure breaks.
🟡 $4,500–$4,600 — NEUTRAL / CHOPPY
⚠️ This region could produce two-way volatility and false breakouts.
🚫 Avoid forcing trades in the middle of the range.
🎯 Wait for price to reach the edges and show confirmation.
🟢 ABOVE $4,600 — BULLISH RECOVERY
📈 A sustained move above $4,600 would weaken the immediate bearish structure.
🚀 A successful retest could open the way toward $4,630 and $4,650.
⚠️📅 16. MONDAY IS ALSO A POSITIONING DAY
🗓️ The week ahead contains important U.S. economic information, meaning Monday could partly become a positioning session ahead of larger catalysts later in the week.
📊 That can produce unusual price behavior: strong moves followed by rapid reversals as traders adjust positions.
⚠️ Do not assume Monday's first directional move will necessarily become the week's trend.
🛡️💰 17. RISK MANAGEMENT — EXTREMELY IMPORTANT
🛡️ Keep individual trade risk small, particularly after Friday's exceptionally large volatility.
📌 A risk range of approximately 0.5%–1% of account equity per trade is a commonly used conservative framework, but your own risk tolerance and account rules should determine the actual amount.
🎯 Look for setups offering at least approximately 1:2 risk/reward rather than entering trades with tiny potential upside.
🚫 Never increase your position simply because the previous trade lost.
🚫 Never move your stop farther away simply because price is approaching it.
🚫 Never revenge trade after a stopped-out position.
🧠 Your first objective Monday should be capital preservation; the second is finding a high-quality setup.
🔥🎯 18. MY MONDAY XAU/USD ROADMAP
🔴 BELOW $4,445: bearish continuation becomes stronger.
🔻 $4,445 → $4,392: first major downside pathway.
🔻 Below $4,392: watch approximately $4,360 → $4,328.
🟡 $4,445–$4,500: potential accumulation/recovery battle zone.
🟡 $4,500–$4,570: major decision area.
🔴 $4,570–$4,600: preferred zone to watch for bearish rejection.
🟢 Above $4,600: bearish thesis weakens.
🚀 Above $4,630–$4,650: short squeeze/reversal risk increases significantly.
🎯 Above $4,650: watch approximately $4,690–$4,700.
🏁🥇 19. FINAL MONDAY NEW YORK SESSION BIAS
🔴 INITIAL BIAS: BEARISH
📉 Friday's massive bearish displacement, support breakdown, stronger rate expectations, dollar strength, and higher yields all favor caution toward aggressive long positions.
🎯 The setup I would prioritize is a confirmed rejection from approximately $4,500–$4,570 rather than chasing a breakdown.
🚨 A confirmed break and retest below $4,445 would strengthen the bearish continuation setup.
🟢 However, a sustained reclaim of $4,600 would force a reassessment of the bearish thesis.
🧠 The most important Monday rule: TRADE THE REACTION, NOT THE PREDICTION.
🔥 Let the New York market show you whether $4,445 becomes support, $4,500 becomes a pivot, or $4,600 becomes a breakout level.
📋🔥 20. MONDAY PRE-NEW-YORK CHECKLIST
☑️ Mark $4,445 Friday low.
☑️ Mark $4,455 Friday close.
☑️ Mark $4,500 psychological level.
☑️ Mark $4,530 pivot.
☑️ Mark $4,570 resistance.
☑️ Mark $4,600 major pivot.
☑️ Mark $4,630 Friday high.
☑️ Mark $4,650 major resistance.
☑️ Mark $4,392 downside target.
☑️ Mark $4,328 major support.
☑️ Check DXY before entering.
☑️ Check U.S. Treasury yields.
☑️ Mark Asian high/low.
☑️ Mark London high/low.
☑️ Wait for New York liquidity sweep.
☑️ Wait for market-structure confirmation.
☑️ Use controlled position sizing.
☑️ Do not chase large candles.
☑️ Do not revenge trade.
☑️ Protect capital first.
🏷️#GoldDayTrading #GoldMarketAnalysis #GoldTechnicalAnalysis #GoldScalpingStrategy #GoldForexTrading
$XAU
{future}(XAUUSDT)
GOLD (XAU/USD) — NEW YORK SESSION DAY-TRADING ANALYSIS & MONDAY GAME PLAN
🥇📅 Sunday, August 30, 2026 | Preparing for Monday, August 31, 2026
🕯️ 📌 IMPORTANT: THERE IS NO REGULAR NEW YORK GOLD SESSION TODAY
🔔 Today is Sunday, August 30, so the regular U.S. New York gold session is closed.
📌 The latest completed New York session was Friday, August 28, and Friday's price action is the key reference for Monday's trading plan.
⚠️ Gold experienced a very large bearish move on Friday, making Monday's reaction particularly important for day traders.
🥇🔥 1. FRIDAY'S GOLD MARKET — THE BIG PICTURE
🔴 Gold experienced a major bearish reversal on Friday, with XAU/USD falling from approximately $4,630 toward $4,445 and closing around $4,455.
📉 The approximately $185 intraday range demonstrates exceptionally high volatility and indicates aggressive selling pressure.
🔴 Friday's close near the lower end of the daily range suggests that sellers maintained control into the New York close.
⚠️ This was not simply a normal pullback — it was a strong bearish displacement that broke short-term market structure.
💡 For Monday, traders should therefore avoid assuming that every dip is automatically a buying opportunity.
🕯️📉 2. FRIDAY'S NEW YORK CANDLE STRUCTURE
🔴 Approximate Friday high: $4,630
🔴 Approximate Friday low: $4,445
🔴 Approximate Friday close: $4,455
⚡ Approximate daily range: $185
📌 The most important observation is that sellers pushed price aggressively lower and prevented a meaningful recovery before the close.
🏦⚠️ 3. WHY DID GOLD SELL OFF SO AGGRESSIVELY?
🏦 The Federal Reserve's increasingly hawkish interest-rate outlook was the major fundamental catalyst behind Friday's sell-off.
📈 Higher expected U.S. interest rates generally increase Treasury yields and strengthen the dollar, both of which can pressure gold.
💵 A stronger U.S. dollar also creates additional downside pressure for XAU/USD because gold is priced in dollars.
📉 The combination of stronger rate expectations, higher yields, and dollar strength created an unfavorable environment for gold buyers.
⚡ Once technical support levels began breaking, stop-loss orders and long liquidation likely amplified the decline.
🔴📊 4. THE MOST IMPORTANT MONDAY PRICE LEVELS
🔴🔥 5. $4,445 — THE MOST IMPORTANT BEARISH LEVEL
🚨 $4,445 is Friday's low and should be one of the first levels marked on your Monday chart.
📉 A decisive New York-session break below $4,445 could indicate that Friday's bearish momentum is continuing.
🔄 However, traders should avoid selling the first candle that breaks $4,445.
🎯 The higher-quality setup would be a break below $4,445 followed by a bounce back toward $4,445–$4,455 and then a bearish rejection.
📌 That creates the classic: BREAK → RETEST → REJECTION setup.
🟡🔥 6. $4,500 — THE PSYCHOLOGICAL BATTLEFIELD
💰 $4,500 is extremely important because it is a major round-number psychological level.
🔴 If gold remains below $4,500, the short-term bearish bias remains stronger.
🟢 If gold reclaims $4,500 and begins holding above it, sellers should become more cautious.
⚠️ A temporary move above $4,500 does not automatically mean a bullish reversal.
📌 You want to see price acceptance above the level, preferably through multiple 5M/15M candles and a successful retest.
🔴🧱 7. $4,570–$4,600 — MAJOR SELLER ZONE
🚨 This is arguably the most important resistance region for Monday.
📈 If gold rallies from the lows into $4,570–$4,600, watch carefully for seller reaction.
🔻 A bearish engulfing candle, long upper wick, lower high, or 5M/15M structure break could provide a short confirmation.
🎯 A rejection from this region could target $4,530 → $4,500 → $4,455 → $4,445.
🚀 Conversely, a strong New York breakout and sustained acceptance above $4,600 would weaken the immediate bearish thesis.
🔴📉 8. MONDAY BEARISH SCENARIO — PREFERRED SETUP
🔴 My initial short-term bias is bearish while gold remains below approximately $4,500–$4,600.
📈 The preferred setup is NOT to chase gold lower after a large bearish candle.
🎯 Instead, wait for a retracement toward resistance.
🔻 Potential Short Setup
📍 Entry zone to monitor: $4,500–$4,570
👀 Wait for: liquidity sweep + rejection + lower high + bearish market-structure break.
🎯 Potential targets:
🔻 TP1: $4,455
🔻 TP2: $4,445
🔻 TP3: $4,392
🔻 TP4: $4,328
⚠️ The exact entry should come from price confirmation rather than simply because price reaches one of these numbers.
🔥📉 9. BREAKDOWN SCENARIO BELOW $4,445
🚨 If New York sellers push XAU/USD below $4,445 with strong momentum, the bearish continuation scenario becomes significantly stronger.
📉 The ideal setup would be a 15-minute candle closing below $4,445 followed by a failed retest.
🎯 Potential downside zones then become approximately $4,420, $4,392, $4,360 and $4,328.
⚠️ Do NOT chase an extended bearish candle because gold can quickly retrace $10–$30 after a liquidity-driven move.
🧠 Patience after the breakdown is more important than catching the first few dollars of the move.
🟢🚀 10. MONDAY BULLISH REVERSAL SCENARIO
🟢 Friday's sell-off does not guarantee that Monday will continue lower.
🔄 A large bearish candle can sometimes produce a powerful short squeeze or relief rally.
📈 The bullish scenario becomes increasingly interesting if $4,445 holds and buyers reclaim $4,500.
🚀 A sequence of $4,500 → $4,530 → $4,570 → $4,600 would show progressively stronger recovery.
💪 A 15M/30M close above $4,600 followed by a successful retest would provide substantially stronger evidence of bullish reversal.
🎯 Upside levels to monitor would then be $4,630 → $4,650 → $4,690–$4,700.
🚨🧠 11. DO NOT CONFUSE A BOUNCE WITH A REVERSAL
⚠️ This is one of the most important points for Monday.
📈 Gold can rally $30–$60 and still remain inside a larger bearish structure.
🔴 A bounce into $4,570–$4,600 does not automatically mean "BUY."
🧠 The question is whether buyers can actually establish acceptance above resistance.
📌 Always distinguish between a temporary retracement and a genuine market-structure reversal.
💵📊 12. WATCH DXY ALONGSIDE GOLD
💵 Keep the U.S. Dollar Index (DXY) on a second chart while trading XAU/USD.
🔴 If DXY rises while gold falls, the bearish gold setup receives additional fundamental confirmation.
🟢 If DXY falls while gold rises, gold's recovery has stronger confirmation.
⚠️ DXY should be used as confirmation rather than as a standalone entry signal.
🏦📈 13. WATCH U.S. TREASURY YIELDS
🏦 U.S. Treasury yields are particularly important after Friday's rate-driven sell-off.
📈 Rising yields can create additional pressure on non-yielding gold.
📉 Falling yields can provide gold with breathing room and support a recovery.
🔎 For Monday, compare XAU/USD with DXY and Treasury yields before taking aggressive positions.
🕐🇺🇸 14. NEW YORK SESSION TRADING PLAN
🕣 08:30–09:00 ET — OPENING VOLATILITY
⚡ Expect fast moves and potential liquidity grabs around the New York open.
📌 Mark the Asian high and low, London high and low, Friday high, Friday low, and Monday's opening range.
🚫 Avoid entering simply because the first candle is large.
🕘 09:00–10:30 ET — PRIMARY EXECUTION WINDOW
🎯 This is where I would look for the cleanest directional setup.
🔎 Look for: LIQUIDITY SWEEP → DISPLACEMENT → RETEST → ENTRY.
🔴 If price sweeps a high and aggressively reverses, look for a short structure.
🟢 If price sweeps a low and aggressively recovers, look for a bullish structure.
🕥 10:30–12:00 ET — TREND CONFIRMATION
📊 If the trend remains strong, continuation setups can develop.
⚠️ If price begins consolidating around $4,500–$4,530, avoid excessive entries and unnecessary scalping.
🧠 A trader's job is not to trade every candle — it is to trade the highest-quality setups.
🧠🔥 15. MONDAY'S THREE MARKET CONDITIONS
🔴 BELOW $4,500 — BEARISH
📉 Favor selling rallies rather than buying dips.
🔻 Look for lower highs, failed resistance, bearish engulfing candles, and structure breaks.
🟡 $4,500–$4,600 — NEUTRAL / CHOPPY
⚠️ This region could produce two-way volatility and false breakouts.
🚫 Avoid forcing trades in the middle of the range.
🎯 Wait for price to reach the edges and show confirmation.
🟢 ABOVE $4,600 — BULLISH RECOVERY
📈 A sustained move above $4,600 would weaken the immediate bearish structure.
🚀 A successful retest could open the way toward $4,630 and $4,650.
⚠️📅 16. MONDAY IS ALSO A POSITIONING DAY
🗓️ The week ahead contains important U.S. economic information, meaning Monday could partly become a positioning session ahead of larger catalysts later in the week.
📊 That can produce unusual price behavior: strong moves followed by rapid reversals as traders adjust positions.
⚠️ Do not assume Monday's first directional move will necessarily become the week's trend.
🛡️💰 17. RISK MANAGEMENT — EXTREMELY IMPORTANT
🛡️ Keep individual trade risk small, particularly after Friday's exceptionally large volatility.
📌 A risk range of approximately 0.5%–1% of account equity per trade is a commonly used conservative framework, but your own risk tolerance and account rules should determine the actual amount.
🎯 Look for setups offering at least approximately 1:2 risk/reward rather than entering trades with tiny potential upside.
🚫 Never increase your position simply because the previous trade lost.
🚫 Never move your stop farther away simply because price is approaching it.
🚫 Never revenge trade after a stopped-out position.
🧠 Your first objective Monday should be capital preservation; the second is finding a high-quality setup.
🔥🎯 18. MY MONDAY XAU/USD ROADMAP
🔴 BELOW $4,445: bearish continuation becomes stronger.
🔻 $4,445 → $4,392: first major downside pathway.
🔻 Below $4,392: watch approximately $4,360 → $4,328.
🟡 $4,445–$4,500: potential accumulation/recovery battle zone.
🟡 $4,500–$4,570: major decision area.
🔴 $4,570–$4,600: preferred zone to watch for bearish rejection.
🟢 Above $4,600: bearish thesis weakens.
🚀 Above $4,630–$4,650: short squeeze/reversal risk increases significantly.
🎯 Above $4,650: watch approximately $4,690–$4,700.
🏁🥇 19. FINAL MONDAY NEW YORK SESSION BIAS
🔴 INITIAL BIAS: BEARISH
📉 Friday's massive bearish displacement, support breakdown, stronger rate expectations, dollar strength, and higher yields all favor caution toward aggressive long positions.
🎯 The setup I would prioritize is a confirmed rejection from approximately $4,500–$4,570 rather than chasing a breakdown.
🚨 A confirmed break and retest below $4,445 would strengthen the bearish continuation setup.
🟢 However, a sustained reclaim of $4,600 would force a reassessment of the bearish thesis.
🧠 The most important Monday rule: TRADE THE REACTION, NOT THE PREDICTION.
🔥 Let the New York market show you whether $4,445 becomes support, $4,500 becomes a pivot, or $4,600 becomes a breakout level.
📋🔥 20. MONDAY PRE-NEW-YORK CHECKLIST
☑️ Mark $4,445 Friday low.
☑️ Mark $4,455 Friday close.
☑️ Mark $4,500 psychological level.
☑️ Mark $4,530 pivot.
☑️ Mark $4,570 resistance.
☑️ Mark $4,600 major pivot.
☑️ Mark $4,630 Friday high.
☑️ Mark $4,650 major resistance.
☑️ Mark $4,392 downside target.
☑️ Mark $4,328 major support.
☑️ Check DXY before entering.
☑️ Check U.S. Treasury yields.
☑️ Mark Asian high/low.
☑️ Mark London high/low.
☑️ Wait for New York liquidity sweep.
☑️ Wait for market-structure confirmation.
☑️ Use controlled position sizing.
☑️ Do not chase large candles.
☑️ Do not revenge trade.
☑️ Protect capital first.
🏷️#GoldDayTrading #GoldMarketAnalysis #GoldTechnicalAnalysis #GoldScalpingStrategy #GoldForexTrading
$XAU
🕯️ 📌 IMPORTANT: THERE IS NO REGULAR NEW YORK GOLD SESSION TODAY
🔔 Today is Sunday, August 30, so the regular U.S. New York gold session is closed.
📌 The latest completed New York session was Friday, August 28, and Friday's price action is the key reference for Monday's trading plan.
⚠️ Gold experienced a very large bearish move on Friday, making Monday's reaction particularly important for day traders.
🥇🔥 1. FRIDAY'S GOLD MARKET — THE BIG PICTURE
🔴 Gold experienced a major bearish reversal on Friday, with XAU/USD falling from approximately $4,630 toward $4,445 and closing around $4,455.
📉 The approximately $185 intraday range demonstrates exceptionally high volatility and indicates aggressive selling pressure.
🔴 Friday's close near the lower end of the daily range suggests that sellers maintained control into the New York close.
⚠️ This was not simply a normal pullback — it was a strong bearish displacement that broke short-term market structure.
💡 For Monday, traders should therefore avoid assuming that every dip is automatically a buying opportunity.
🕯️📉 2. FRIDAY'S NEW YORK CANDLE STRUCTURE
🔴 Approximate Friday high: $4,630
🔴 Approximate Friday low: $4,445
🔴 Approximate Friday close: $4,455
⚡ Approximate daily range: $185
📌 The most important observation is that sellers pushed price aggressively lower and prevented a meaningful recovery before the close.
🏦⚠️ 3. WHY DID GOLD SELL OFF SO AGGRESSIVELY?
🏦 The Federal Reserve's increasingly hawkish interest-rate outlook was the major fundamental catalyst behind Friday's sell-off.
📈 Higher expected U.S. interest rates generally increase Treasury yields and strengthen the dollar, both of which can pressure gold.
💵 A stronger U.S. dollar also creates additional downside pressure for XAU/USD because gold is priced in dollars.
📉 The combination of stronger rate expectations, higher yields, and dollar strength created an unfavorable environment for gold buyers.
⚡ Once technical support levels began breaking, stop-loss orders and long liquidation likely amplified the decline.
🔴📊 4. THE MOST IMPORTANT MONDAY PRICE LEVELS
🔴🔥 5. $4,445 — THE MOST IMPORTANT BEARISH LEVEL
🚨 $4,445 is Friday's low and should be one of the first levels marked on your Monday chart.
📉 A decisive New York-session break below $4,445 could indicate that Friday's bearish momentum is continuing.
🔄 However, traders should avoid selling the first candle that breaks $4,445.
🎯 The higher-quality setup would be a break below $4,445 followed by a bounce back toward $4,445–$4,455 and then a bearish rejection.
📌 That creates the classic: BREAK → RETEST → REJECTION setup.
🟡🔥 6. $4,500 — THE PSYCHOLOGICAL BATTLEFIELD
💰 $4,500 is extremely important because it is a major round-number psychological level.
🔴 If gold remains below $4,500, the short-term bearish bias remains stronger.
🟢 If gold reclaims $4,500 and begins holding above it, sellers should become more cautious.
⚠️ A temporary move above $4,500 does not automatically mean a bullish reversal.
📌 You want to see price acceptance above the level, preferably through multiple 5M/15M candles and a successful retest.
🔴🧱 7. $4,570–$4,600 — MAJOR SELLER ZONE
🚨 This is arguably the most important resistance region for Monday.
📈 If gold rallies from the lows into $4,570–$4,600, watch carefully for seller reaction.
🔻 A bearish engulfing candle, long upper wick, lower high, or 5M/15M structure break could provide a short confirmation.
🎯 A rejection from this region could target $4,530 → $4,500 → $4,455 → $4,445.
🚀 Conversely, a strong New York breakout and sustained acceptance above $4,600 would weaken the immediate bearish thesis.
🔴📉 8. MONDAY BEARISH SCENARIO — PREFERRED SETUP
🔴 My initial short-term bias is bearish while gold remains below approximately $4,500–$4,600.
📈 The preferred setup is NOT to chase gold lower after a large bearish candle.
🎯 Instead, wait for a retracement toward resistance.
🔻 Potential Short Setup
📍 Entry zone to monitor: $4,500–$4,570
👀 Wait for: liquidity sweep + rejection + lower high + bearish market-structure break.
🎯 Potential targets:
🔻 TP1: $4,455
🔻 TP2: $4,445
🔻 TP3: $4,392
🔻 TP4: $4,328
⚠️ The exact entry should come from price confirmation rather than simply because price reaches one of these numbers.
🔥📉 9. BREAKDOWN SCENARIO BELOW $4,445
🚨 If New York sellers push XAU/USD below $4,445 with strong momentum, the bearish continuation scenario becomes significantly stronger.
📉 The ideal setup would be a 15-minute candle closing below $4,445 followed by a failed retest.
🎯 Potential downside zones then become approximately $4,420, $4,392, $4,360 and $4,328.
⚠️ Do NOT chase an extended bearish candle because gold can quickly retrace $10–$30 after a liquidity-driven move.
🧠 Patience after the breakdown is more important than catching the first few dollars of the move.
🟢🚀 10. MONDAY BULLISH REVERSAL SCENARIO
🟢 Friday's sell-off does not guarantee that Monday will continue lower.
🔄 A large bearish candle can sometimes produce a powerful short squeeze or relief rally.
📈 The bullish scenario becomes increasingly interesting if $4,445 holds and buyers reclaim $4,500.
🚀 A sequence of $4,500 → $4,530 → $4,570 → $4,600 would show progressively stronger recovery.
💪 A 15M/30M close above $4,600 followed by a successful retest would provide substantially stronger evidence of bullish reversal.
🎯 Upside levels to monitor would then be $4,630 → $4,650 → $4,690–$4,700.
🚨🧠 11. DO NOT CONFUSE A BOUNCE WITH A REVERSAL
⚠️ This is one of the most important points for Monday.
📈 Gold can rally $30–$60 and still remain inside a larger bearish structure.
🔴 A bounce into $4,570–$4,600 does not automatically mean "BUY."
🧠 The question is whether buyers can actually establish acceptance above resistance.
📌 Always distinguish between a temporary retracement and a genuine market-structure reversal.
💵📊 12. WATCH DXY ALONGSIDE GOLD
💵 Keep the U.S. Dollar Index (DXY) on a second chart while trading XAU/USD.
🔴 If DXY rises while gold falls, the bearish gold setup receives additional fundamental confirmation.
🟢 If DXY falls while gold rises, gold's recovery has stronger confirmation.
⚠️ DXY should be used as confirmation rather than as a standalone entry signal.
🏦📈 13. WATCH U.S. TREASURY YIELDS
🏦 U.S. Treasury yields are particularly important after Friday's rate-driven sell-off.
📈 Rising yields can create additional pressure on non-yielding gold.
📉 Falling yields can provide gold with breathing room and support a recovery.
🔎 For Monday, compare XAU/USD with DXY and Treasury yields before taking aggressive positions.
🕐🇺🇸 14. NEW YORK SESSION TRADING PLAN
🕣 08:30–09:00 ET — OPENING VOLATILITY
⚡ Expect fast moves and potential liquidity grabs around the New York open.
📌 Mark the Asian high and low, London high and low, Friday high, Friday low, and Monday's opening range.
🚫 Avoid entering simply because the first candle is large.
🕘 09:00–10:30 ET — PRIMARY EXECUTION WINDOW
🎯 This is where I would look for the cleanest directional setup.
🔎 Look for: LIQUIDITY SWEEP → DISPLACEMENT → RETEST → ENTRY.
🔴 If price sweeps a high and aggressively reverses, look for a short structure.
🟢 If price sweeps a low and aggressively recovers, look for a bullish structure.
🕥 10:30–12:00 ET — TREND CONFIRMATION
📊 If the trend remains strong, continuation setups can develop.
⚠️ If price begins consolidating around $4,500–$4,530, avoid excessive entries and unnecessary scalping.
🧠 A trader's job is not to trade every candle — it is to trade the highest-quality setups.
🧠🔥 15. MONDAY'S THREE MARKET CONDITIONS
🔴 BELOW $4,500 — BEARISH
📉 Favor selling rallies rather than buying dips.
🔻 Look for lower highs, failed resistance, bearish engulfing candles, and structure breaks.
🟡 $4,500–$4,600 — NEUTRAL / CHOPPY
⚠️ This region could produce two-way volatility and false breakouts.
🚫 Avoid forcing trades in the middle of the range.
🎯 Wait for price to reach the edges and show confirmation.
🟢 ABOVE $4,600 — BULLISH RECOVERY
📈 A sustained move above $4,600 would weaken the immediate bearish structure.
🚀 A successful retest could open the way toward $4,630 and $4,650.
⚠️📅 16. MONDAY IS ALSO A POSITIONING DAY
🗓️ The week ahead contains important U.S. economic information, meaning Monday could partly become a positioning session ahead of larger catalysts later in the week.
📊 That can produce unusual price behavior: strong moves followed by rapid reversals as traders adjust positions.
⚠️ Do not assume Monday's first directional move will necessarily become the week's trend.
🛡️💰 17. RISK MANAGEMENT — EXTREMELY IMPORTANT
🛡️ Keep individual trade risk small, particularly after Friday's exceptionally large volatility.
📌 A risk range of approximately 0.5%–1% of account equity per trade is a commonly used conservative framework, but your own risk tolerance and account rules should determine the actual amount.
🎯 Look for setups offering at least approximately 1:2 risk/reward rather than entering trades with tiny potential upside.
🚫 Never increase your position simply because the previous trade lost.
🚫 Never move your stop farther away simply because price is approaching it.
🚫 Never revenge trade after a stopped-out position.
🧠 Your first objective Monday should be capital preservation; the second is finding a high-quality setup.
🔥🎯 18. MY MONDAY XAU/USD ROADMAP
🔴 BELOW $4,445: bearish continuation becomes stronger.
🔻 $4,445 → $4,392: first major downside pathway.
🔻 Below $4,392: watch approximately $4,360 → $4,328.
🟡 $4,445–$4,500: potential accumulation/recovery battle zone.
🟡 $4,500–$4,570: major decision area.
🔴 $4,570–$4,600: preferred zone to watch for bearish rejection.
🟢 Above $4,600: bearish thesis weakens.
🚀 Above $4,630–$4,650: short squeeze/reversal risk increases significantly.
🎯 Above $4,650: watch approximately $4,690–$4,700.
🏁🥇 19. FINAL MONDAY NEW YORK SESSION BIAS
🔴 INITIAL BIAS: BEARISH
📉 Friday's massive bearish displacement, support breakdown, stronger rate expectations, dollar strength, and higher yields all favor caution toward aggressive long positions.
🎯 The setup I would prioritize is a confirmed rejection from approximately $4,500–$4,570 rather than chasing a breakdown.
🚨 A confirmed break and retest below $4,445 would strengthen the bearish continuation setup.
🟢 However, a sustained reclaim of $4,600 would force a reassessment of the bearish thesis.
🧠 The most important Monday rule: TRADE THE REACTION, NOT THE PREDICTION.
🔥 Let the New York market show you whether $4,445 becomes support, $4,500 becomes a pivot, or $4,600 becomes a breakout level.
📋🔥 20. MONDAY PRE-NEW-YORK CHECKLIST
☑️ Mark $4,445 Friday low.
☑️ Mark $4,455 Friday close.
☑️ Mark $4,500 psychological level.
☑️ Mark $4,530 pivot.
☑️ Mark $4,570 resistance.
☑️ Mark $4,600 major pivot.
☑️ Mark $4,630 Friday high.
☑️ Mark $4,650 major resistance.
☑️ Mark $4,392 downside target.
☑️ Mark $4,328 major support.
☑️ Check DXY before entering.
☑️ Check U.S. Treasury yields.
☑️ Mark Asian high/low.
☑️ Mark London high/low.
☑️ Wait for New York liquidity sweep.
☑️ Wait for market-structure confirmation.
☑️ Use controlled position sizing.
☑️ Do not chase large candles.
☑️ Do not revenge trade.
☑️ Protect capital first.
🏷️#GoldDayTrading #GoldMarketAnalysis #GoldTechnicalAnalysis #GoldScalpingStrategy #GoldForexTrading
$XAU
1
4
213
Войдите, чтобы посмотреть больше материала
Присоединяйтесь к пользователям криптовалют по всему миру на Binance Square
⚡️ Получайте новейшую и полезную информацию о криптоактивах.
💬 Нам доверяет крупнейшая в мире криптобиржа.
👍 Получите достоверные аналитические данные от верифицированных создателей контента.
Эл. почта/номер телефона
В тренде
1
#FedRateWatch
Просмотров: 178,673
1,175 обсуждают
2
#BitcoinSlidesTo$76000
Просмотров: 103
30 обсуждают
3
#BitcoinReboundsTo$79K
Просмотров: 44,079
335 обсуждают
4
#StrategyMarketCapPassesFord
Просмотров: 1,569
157 обсуждают
5
#ClarityActOddsHalveOnPolymarket
Просмотров: 1,346
105 обсуждают
6
#US30YTreasuryYieldTops5.40%
Просмотров: 3,772
120 обсуждают
7
#BessentEndorsesFinalClarityActDraft
Просмотров: 18,004
412 обсуждают
8
#ZamaOpens16ConfidentialMorphoVaults
Просмотров: 7,461
205 обсуждают
9
#USDCOnChainVolumeTops$100Trillion
Просмотров: 1,165
31 обсуждают
10
#BitcoinSpotETFsNetInflow$160M
Просмотров: 2,057
84 обсуждают