
#drawdown
drawdown
Просмотров: 14,736
49 обсуждают
Популярные
Новые

📊 Ek chart: drawdown recovery ladder.
🧮 10% loss → +11% | 25% → +33% | 50% → +100% | 70% → +233%
📉 Ye asymmetry trading ka sab se underrated number hai: bara loss capital ke saath edge ka math bhi kharab karta hai — wapis aane ke liye chhote wins ka lamba silsila chahiye, luck nahi.
Haqeeqi example: BTC ~73,770 (pichla hafta) → ~63.2K ab, -14% — wapis ke liye ~+17% chahiye.
⚠️ Isliye risk pehle, profit baad mein.
$BTC #Drawdown #RiskManagement #CryptoTrading #TradingPsychology
📊 Ek chart: drawdown recovery ladder.
🧮 10% loss → +11% | 25% → +33% | 50% → +100% | 70% → +233%
📉 Ye asymmetry trading ka sab se underrated number hai: bara loss capital ke saath edge ka math bhi kharab karta hai — wapis aane ke liye chhote wins ka lamba silsila chahiye, luck nahi.
Haqeeqi example: BTC ~73,770 (pichla hafta) → ~63.2K ab, -14% — wapis ke liye ~+17% chahiye.
⚠️ Isliye risk pehle, profit baad mein.
$BTC #Drawdown #RiskManagement #CryptoTrading #TradingPsychology
🧮 10% loss → +11% | 25% → +33% | 50% → +100% | 70% → +233%
📉 Ye asymmetry trading ka sab se underrated number hai: bara loss capital ke saath edge ka math bhi kharab karta hai — wapis aane ke liye chhote wins ka lamba silsila chahiye, luck nahi.
Haqeeqi example: BTC ~73,770 (pichla hafta) → ~63.2K ab, -14% — wapis ke liye ~+17% chahiye.
⚠️ Isliye risk pehle, profit baad mein.
$BTC #Drawdown #RiskManagement #CryptoTrading #TradingPsychology
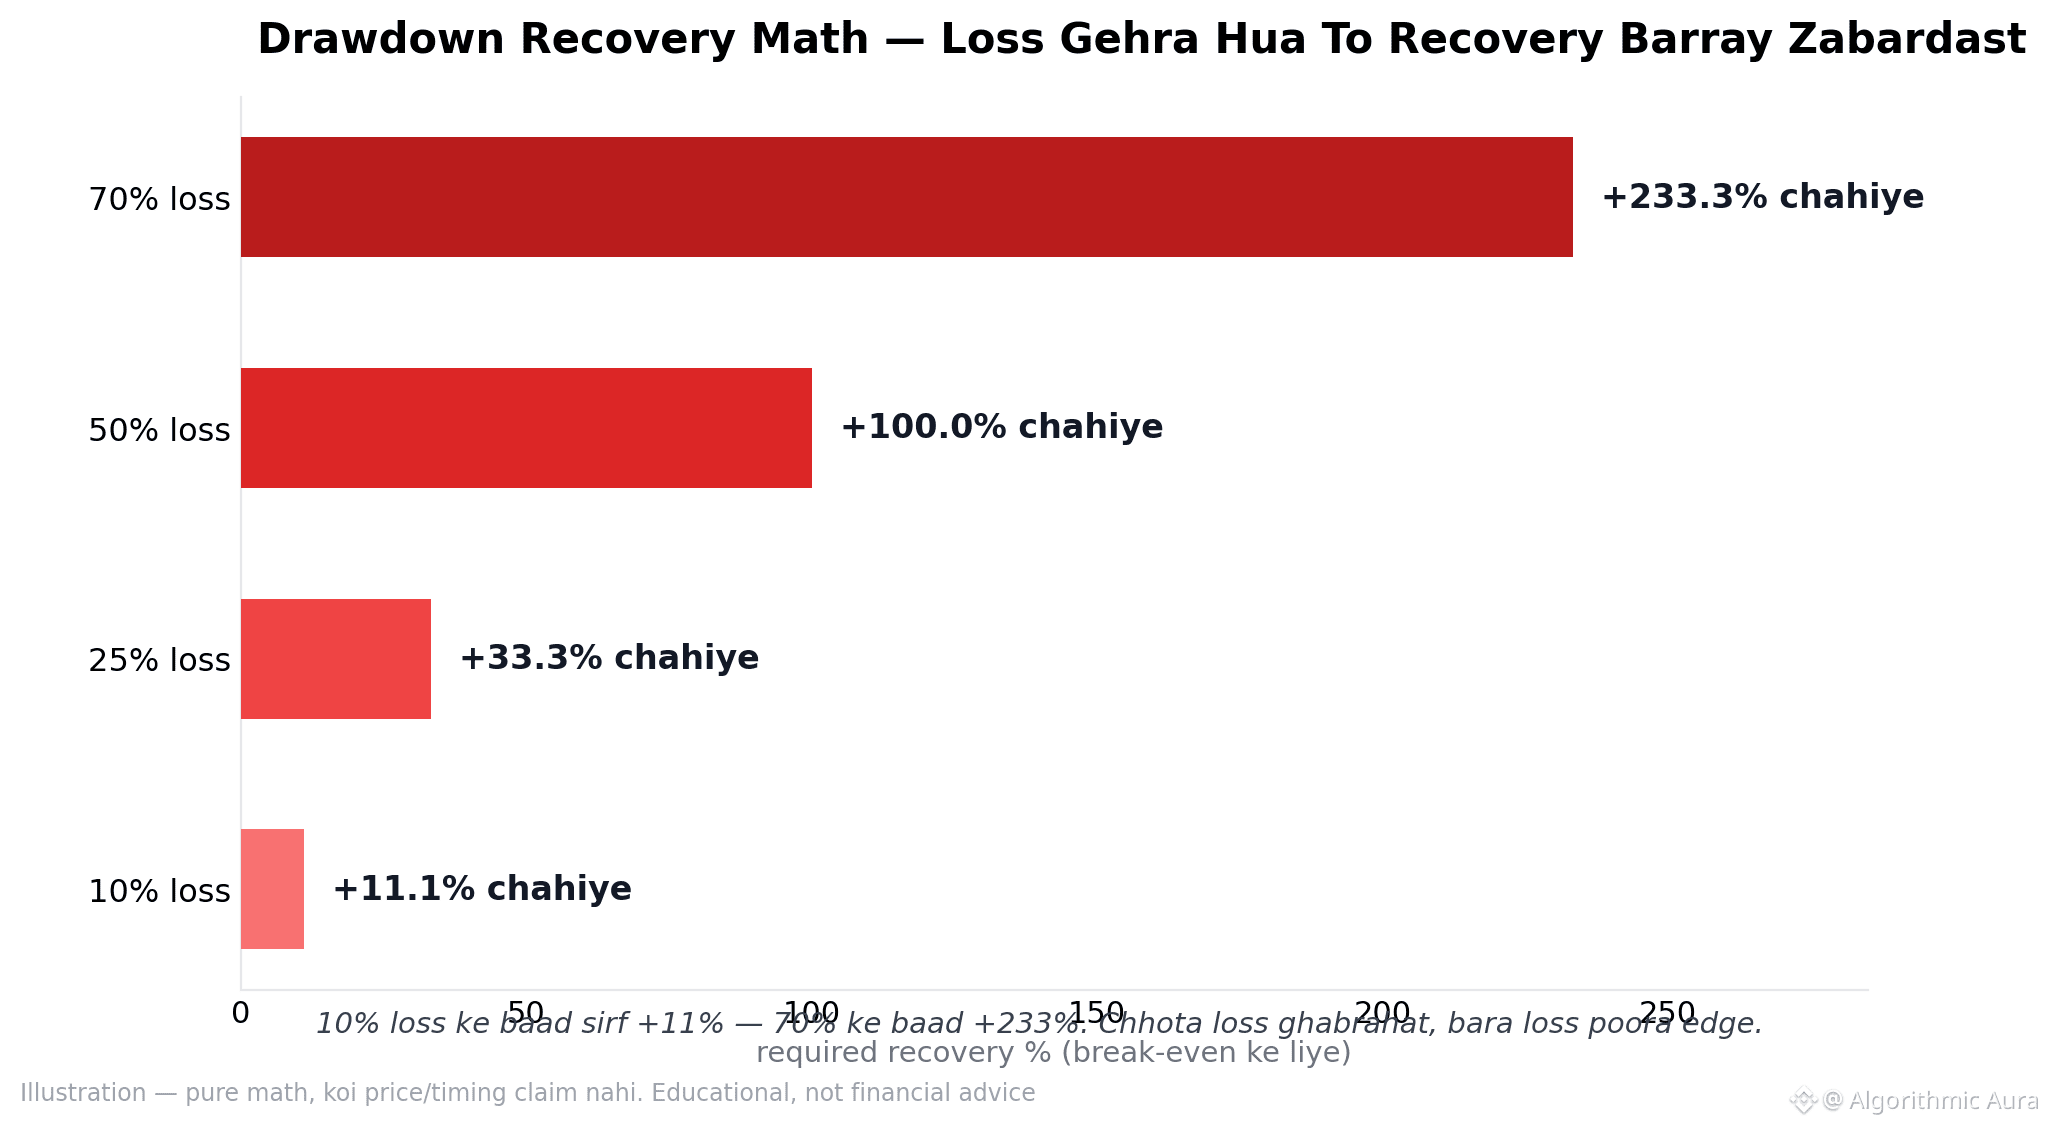
📉 Drawdown ka cruel math — recovery hamesha loss se zyada lagti hai.
Ye ratio linear nahi, accelerator hai:
🧮 10% loss → +11%
🧮 25% loss → +33%
🧮 50% loss → +100%
🧮 70% loss → +233%
Matlab: 50% hone par break-even ke liye DOUBLE gain chahiye — aur market mein double gains regular nahi aate.
🧠 Ye math discipline ki asli wajah hai: chhota loss recoverable, bara loss poora edge kha jata hai.
Isliye risk pehle fix hota hai — recovery plan baad mein.
Math hai, mood nahi.
$BTC #Drawdown #RiskManagement #CryptoTrading #TradingPsychology
📉 Drawdown ka cruel math — recovery hamesha loss se zyada lagti hai.
Ye ratio linear nahi, accelerator hai:
🧮 10% loss → +11%
🧮 25% loss → +33%
🧮 50% loss → +100%
🧮 70% loss → +233%
Matlab: 50% hone par break-even ke liye DOUBLE gain chahiye — aur market mein double gains regular nahi aate.
🧠 Ye math discipline ki asli wajah hai: chhota loss recoverable, bara loss poora edge kha jata hai.
Isliye risk pehle fix hota hai — recovery plan baad mein.
Math hai, mood nahi.
$BTC #Drawdown #RiskManagement #CryptoTrading #TradingPsychology
Ye ratio linear nahi, accelerator hai:
🧮 10% loss → +11%
🧮 25% loss → +33%
🧮 50% loss → +100%
🧮 70% loss → +233%
Matlab: 50% hone par break-even ke liye DOUBLE gain chahiye — aur market mein double gains regular nahi aate.
🧠 Ye math discipline ki asli wajah hai: chhota loss recoverable, bara loss poora edge kha jata hai.
Isliye risk pehle fix hota hai — recovery plan baad mein.
Math hai, mood nahi.
$BTC #Drawdown #RiskManagement #CryptoTrading #TradingPsychology

Từ ATH tháng 2/2025 đến ATL tháng 7/2026, hành trình giá của $SHELL cho thấy mức biến động rất lớn. Việc giá hiện tại thấp hơn ATH hơn 97% không đồng nghĩa token chắc chắn sẽ quay lại đỉnh cũ. Khi đánh giá một tài sản sau drawdown sâu, cần xem xét thêm nguồn cung, thanh khoản và mức độ sử dụng sản phẩm.
#SHELL #Drawdown #Tokenomics
Từ ATH tháng 2/2025 đến ATL tháng 7/2026, hành trình giá của $SHELL cho thấy mức biến động rất lớn. Việc giá hiện tại thấp hơn ATH hơn 97% không đồng nghĩa token chắc chắn sẽ quay lại đỉnh cũ. Khi đánh giá một tài sản sau drawdown sâu, cần xem xét thêm nguồn cung, thanh khoản và mức độ sử dụng sản phẩm.
#SHELL #Drawdown #Tokenomics
#SHELL #Drawdown #Tokenomics
26
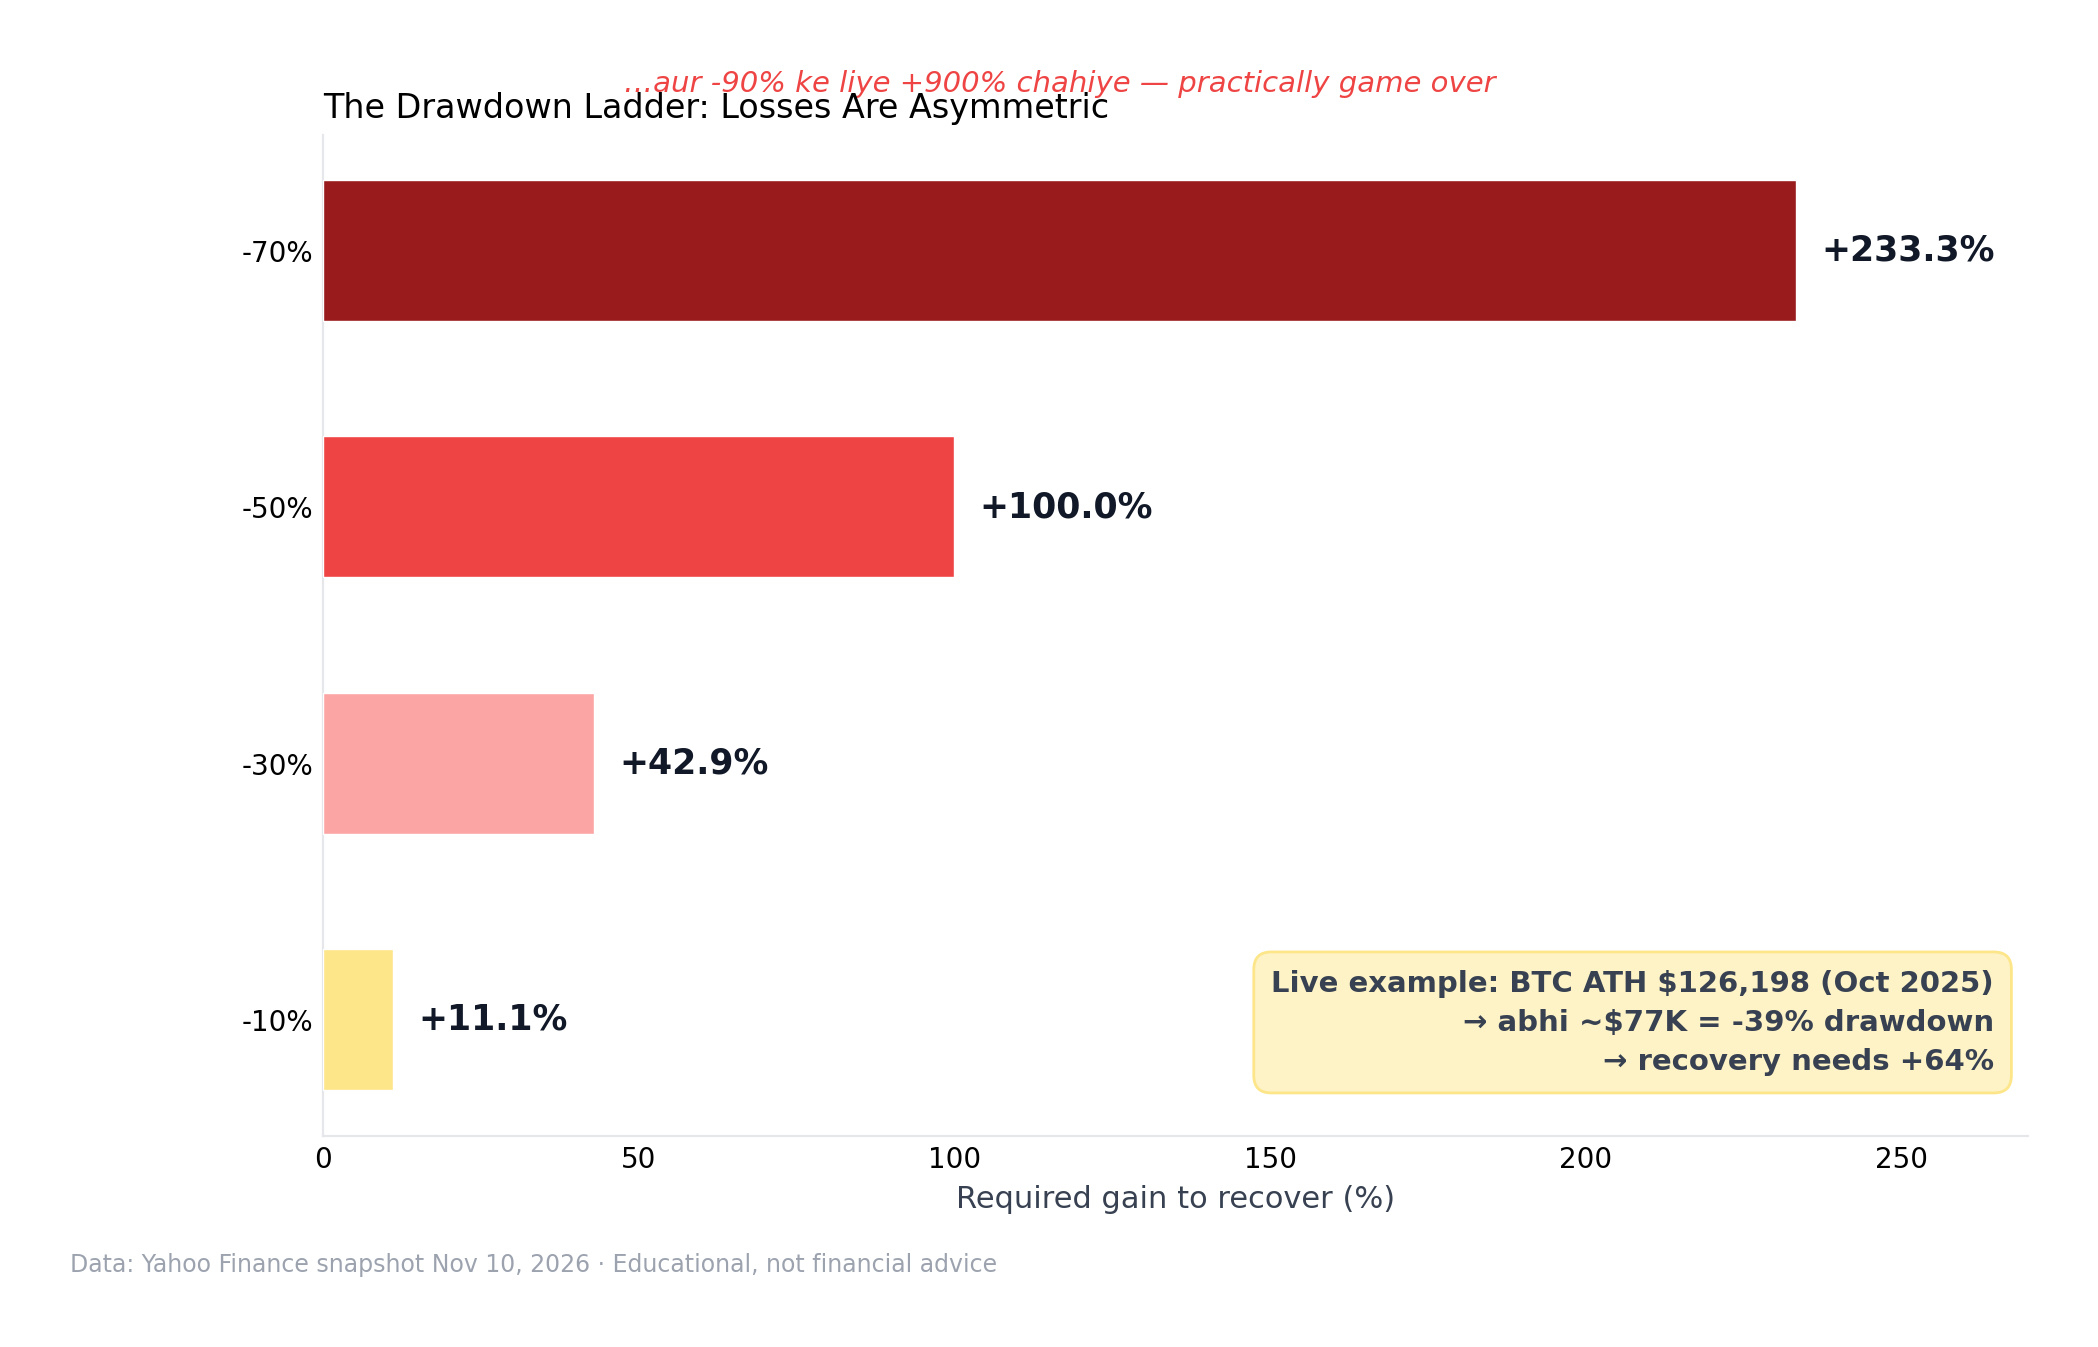
📉 Drawdown ka asymmetric math — utna hi loss utna "easy" wapas nahi aata.
Chart mein:
1️⃣ -10% → recovery ke liye +11.1%
2️⃣ -30% → +42.9%
3️⃣ -50% → +100%
4️⃣ -70% → +233.3%
5️⃣ -90% → +900% (practically game over)
Live example: BTC ka ATH $126,198 (Oct 2025) — aaj ~$77K par ye -39% drawdown hai, recovery ke liye +64% ka move chahiye (Yahoo data).
Isi liye professionals drawdown ko avoid karna sikhaate hain, recover karna nahi. Capital preservation pehle aata hai — kyunki math asymmetric hai. 🧮
$BTC
#Drawdown #RiskManagement #CryptoEducation
📉 Drawdown ka asymmetric math — utna hi loss utna "easy" wapas nahi aata.
Chart mein:
1️⃣ -10% → recovery ke liye +11.1%
2️⃣ -30% → +42.9%
3️⃣ -50% → +100%
4️⃣ -70% → +233.3%
5️⃣ -90% → +900% (practically game over)
Live example: BTC ka ATH $126,198 (Oct 2025) — aaj ~$77K par ye -39% drawdown hai, recovery ke liye +64% ka move chahiye (Yahoo data).
Isi liye professionals drawdown ko avoid karna sikhaate hain, recover karna nahi. Capital preservation pehle aata hai — kyunki math asymmetric hai. 🧮
$BTC
#Drawdown #RiskManagement #CryptoEducation
Chart mein:
1️⃣ -10% → recovery ke liye +11.1%
2️⃣ -30% → +42.9%
3️⃣ -50% → +100%
4️⃣ -70% → +233.3%
5️⃣ -90% → +900% (practically game over)
Live example: BTC ka ATH $126,198 (Oct 2025) — aaj ~$77K par ye -39% drawdown hai, recovery ke liye +64% ka move chahiye (Yahoo data).
Isi liye professionals drawdown ko avoid karna sikhaate hain, recover karna nahi. Capital preservation pehle aata hai — kyunki math asymmetric hai. 🧮
$BTC
#Drawdown #RiskManagement #CryptoEducation

·
--
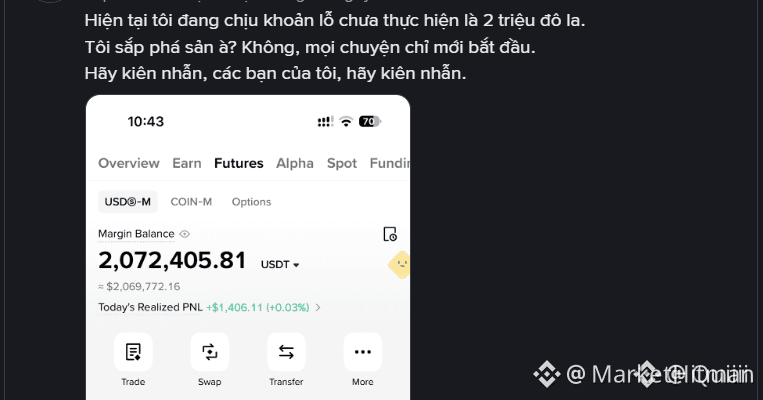
🚨 $BTC $2M DRAWDOWN DILEMMA – PLAY OR PAUSE? 💥
📊 A $2M hole on a $4M account screams “capital stress” – the market’s been draining liquidity faster than a whale’s sweep. 🦈 Smart money is likely re‑positioning, and the order flow shows sellers grabbing the dip aggressively. ⚡ If you stay in, you need a clear catalyst: a breakout volume surge or a decisive support hold that flips the pressure back to buyers. 💡 Otherwise, protecting the remaining $2M could mean tightening stops or stepping back until the next liquidity vacuum refills.
💬 What’s your risk‑adjusted play: double‑down on the rebound or lock in the remaining capital? 👇
⚠️ Not financial advice. Always manage your risk. 🛡️
🏷️ #BTC #RiskManagement #Drawdown #Crypto
🔥 💎
🚨 $BTC $2M DRAWDOWN DILEMMA – PLAY OR PAUSE? 💥
📊 A $2M hole on a $4M account screams “capital stress” – the market’s been draining liquidity faster than a whale’s sweep. 🦈 Smart money is likely re‑positioning, and the order flow shows sellers grabbing the dip aggressively. ⚡ If you stay in, you need a clear catalyst: a breakout volume surge or a decisive support hold that flips the pressure back to buyers. 💡 Otherwise, protecting the remaining $2M could mean tightening stops or stepping back until the next liquidity vacuum refills.
💬 What’s your risk‑adjusted play: double‑down on the rebound or lock in the remaining capital? 👇
⚠️ Not financial advice. Always manage your risk. 🛡️
🏷️ #BTC #RiskManagement #Drawdown #Crypto
🔥 💎
📊 A $2M hole on a $4M account screams “capital stress” – the market’s been draining liquidity faster than a whale’s sweep. 🦈 Smart money is likely re‑positioning, and the order flow shows sellers grabbing the dip aggressively. ⚡ If you stay in, you need a clear catalyst: a breakout volume surge or a decisive support hold that flips the pressure back to buyers. 💡 Otherwise, protecting the remaining $2M could mean tightening stops or stepping back until the next liquidity vacuum refills.
💬 What’s your risk‑adjusted play: double‑down on the rebound or lock in the remaining capital? 👇
⚠️ Not financial advice. Always manage your risk. 🛡️
🏷️ #BTC #RiskManagement #Drawdown #Crypto
🔥 💎
8
$SHELL | What an All-Time-High Drawdown Can—and Cannot—Tell Us
The research report placed the historical all-time high near $0.68–$0.73 in February 2025, while recent price snapshots were around 0.022. It also cited a possible all-time low near 0.0175 in July 2026. These historical levels should be checked against the same data provider before being used for precise comparisons, because exchanges and aggregators can report different extremes.
Even using the approximate figures, the distance from the previous high is substantial. A token trading around 0.022 is roughly 97% below a peak near 0.70.
A drawdown of this size provides important historical context. It shows how much market value has been lost relative to the previous peak, and it reminds investors that early rallies do not guarantee long-term price stability.
But there is a common analytical mistake: assuming that an asset must return to its all-time high simply because it once traded there. A previous peak is not a valuation floor or a guaranteed future target. Market conditions, liquidity, token supply, demand and project execution may all change over time.
The same caution applies in the opposite direction. A large drawdown does not prove that further declines are impossible, nor does it prove that recovery is impossible.
Historical highs and lows are reference points. They become more useful when combined with current market structure, supply data and evidence of sustained demand.
#PriceHistory #Drawdown #CryptoCycles Tokenomics MarketContext
$SHELL | What an All-Time-High Drawdown Can—and Cannot—Tell Us
The research report placed the historical all-time high near $0.68–$0.73 in February 2025, while recent price snapshots were around 0.022. It also cited a possible all-time low near 0.0175 in July 2026. These historical levels should be checked against the same data provider before being used for precise comparisons, because exchanges and aggregators can report different extremes.
Even using the approximate figures, the distance from the previous high is substantial. A token trading around 0.022 is roughly 97% below a peak near 0.70.
A drawdown of this size provides important historical context. It shows how much market value has been lost relative to the previous peak, and it reminds investors that early rallies do not guarantee long-term price stability.
But there is a common analytical mistake: assuming that an asset must return to its all-time high simply because it once traded there. A previous peak is not a valuation floor or a guaranteed future target. Market conditions, liquidity, token supply, demand and project execution may all change over time.
The same caution applies in the opposite direction. A large drawdown does not prove that further declines are impossible, nor does it prove that recovery is impossible.
Historical highs and lows are reference points. They become more useful when combined with current market structure, supply data and evidence of sustained demand.
#PriceHistory #Drawdown #CryptoCycles Tokenomics MarketContext
The research report placed the historical all-time high near $0.68–$0.73 in February 2025, while recent price snapshots were around 0.022. It also cited a possible all-time low near 0.0175 in July 2026. These historical levels should be checked against the same data provider before being used for precise comparisons, because exchanges and aggregators can report different extremes.
Even using the approximate figures, the distance from the previous high is substantial. A token trading around 0.022 is roughly 97% below a peak near 0.70.
A drawdown of this size provides important historical context. It shows how much market value has been lost relative to the previous peak, and it reminds investors that early rallies do not guarantee long-term price stability.
But there is a common analytical mistake: assuming that an asset must return to its all-time high simply because it once traded there. A previous peak is not a valuation floor or a guaranteed future target. Market conditions, liquidity, token supply, demand and project execution may all change over time.
The same caution applies in the opposite direction. A large drawdown does not prove that further declines are impossible, nor does it prove that recovery is impossible.
Historical highs and lows are reference points. They become more useful when combined with current market structure, supply data and evidence of sustained demand.
#PriceHistory #Drawdown #CryptoCycles Tokenomics MarketContext

30

·
--
Падение
Проверено
🚨🐳 BTC PODRÍA CAER HASTA 49K... PERO HAY ALGO QUE MUCHOS NO ESTÁN VIENDO 👀🔥
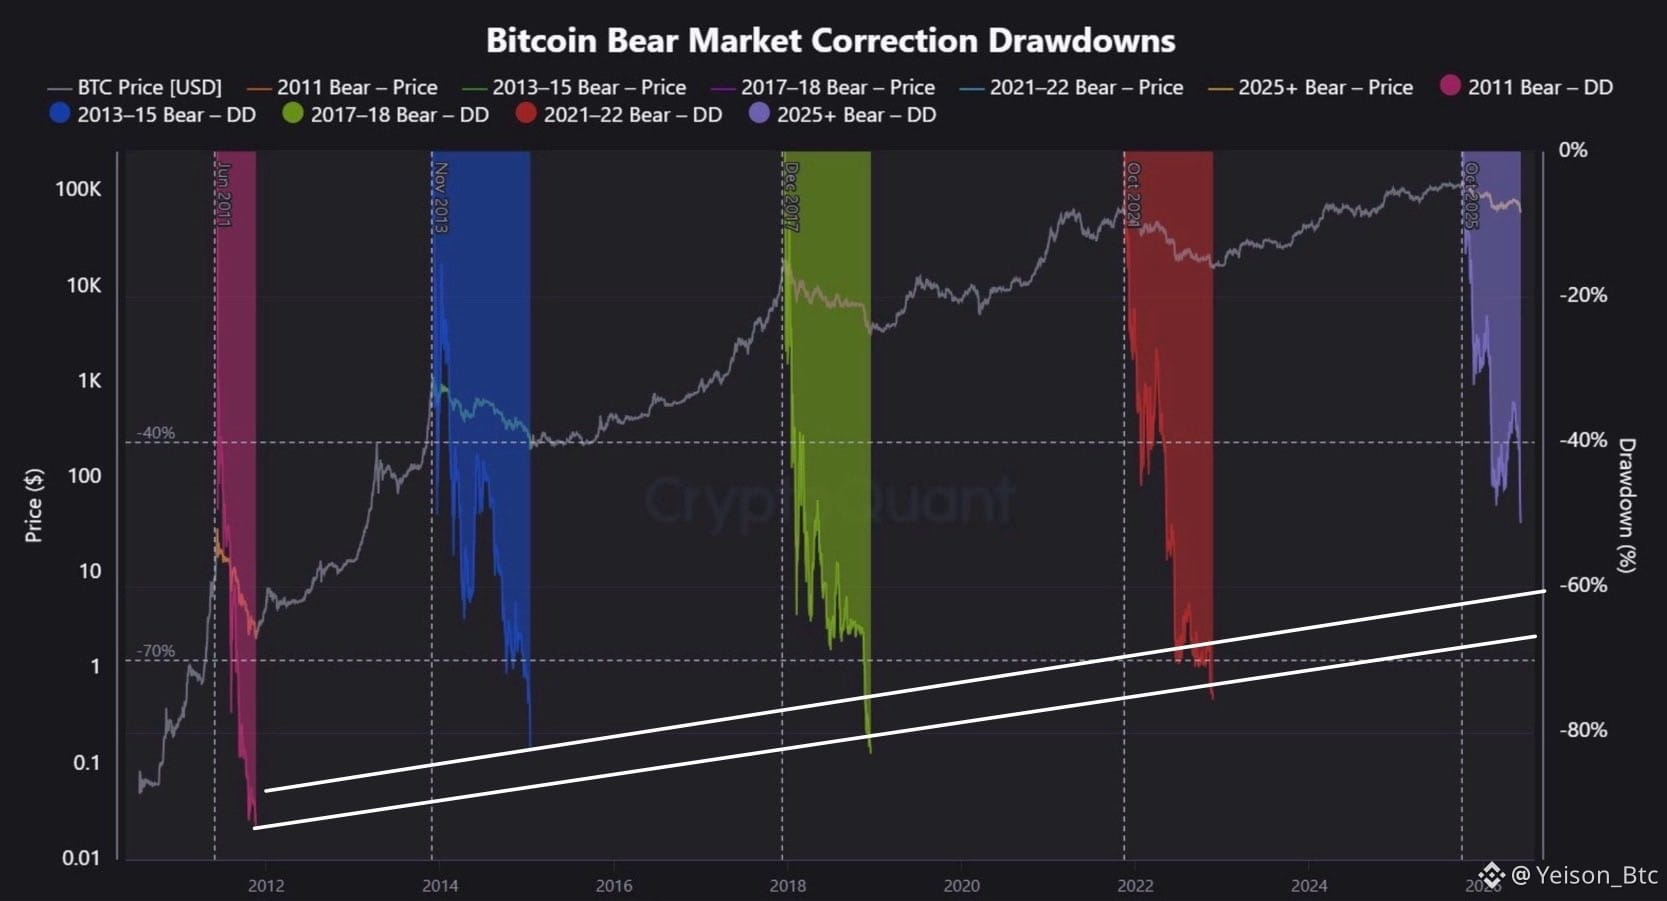
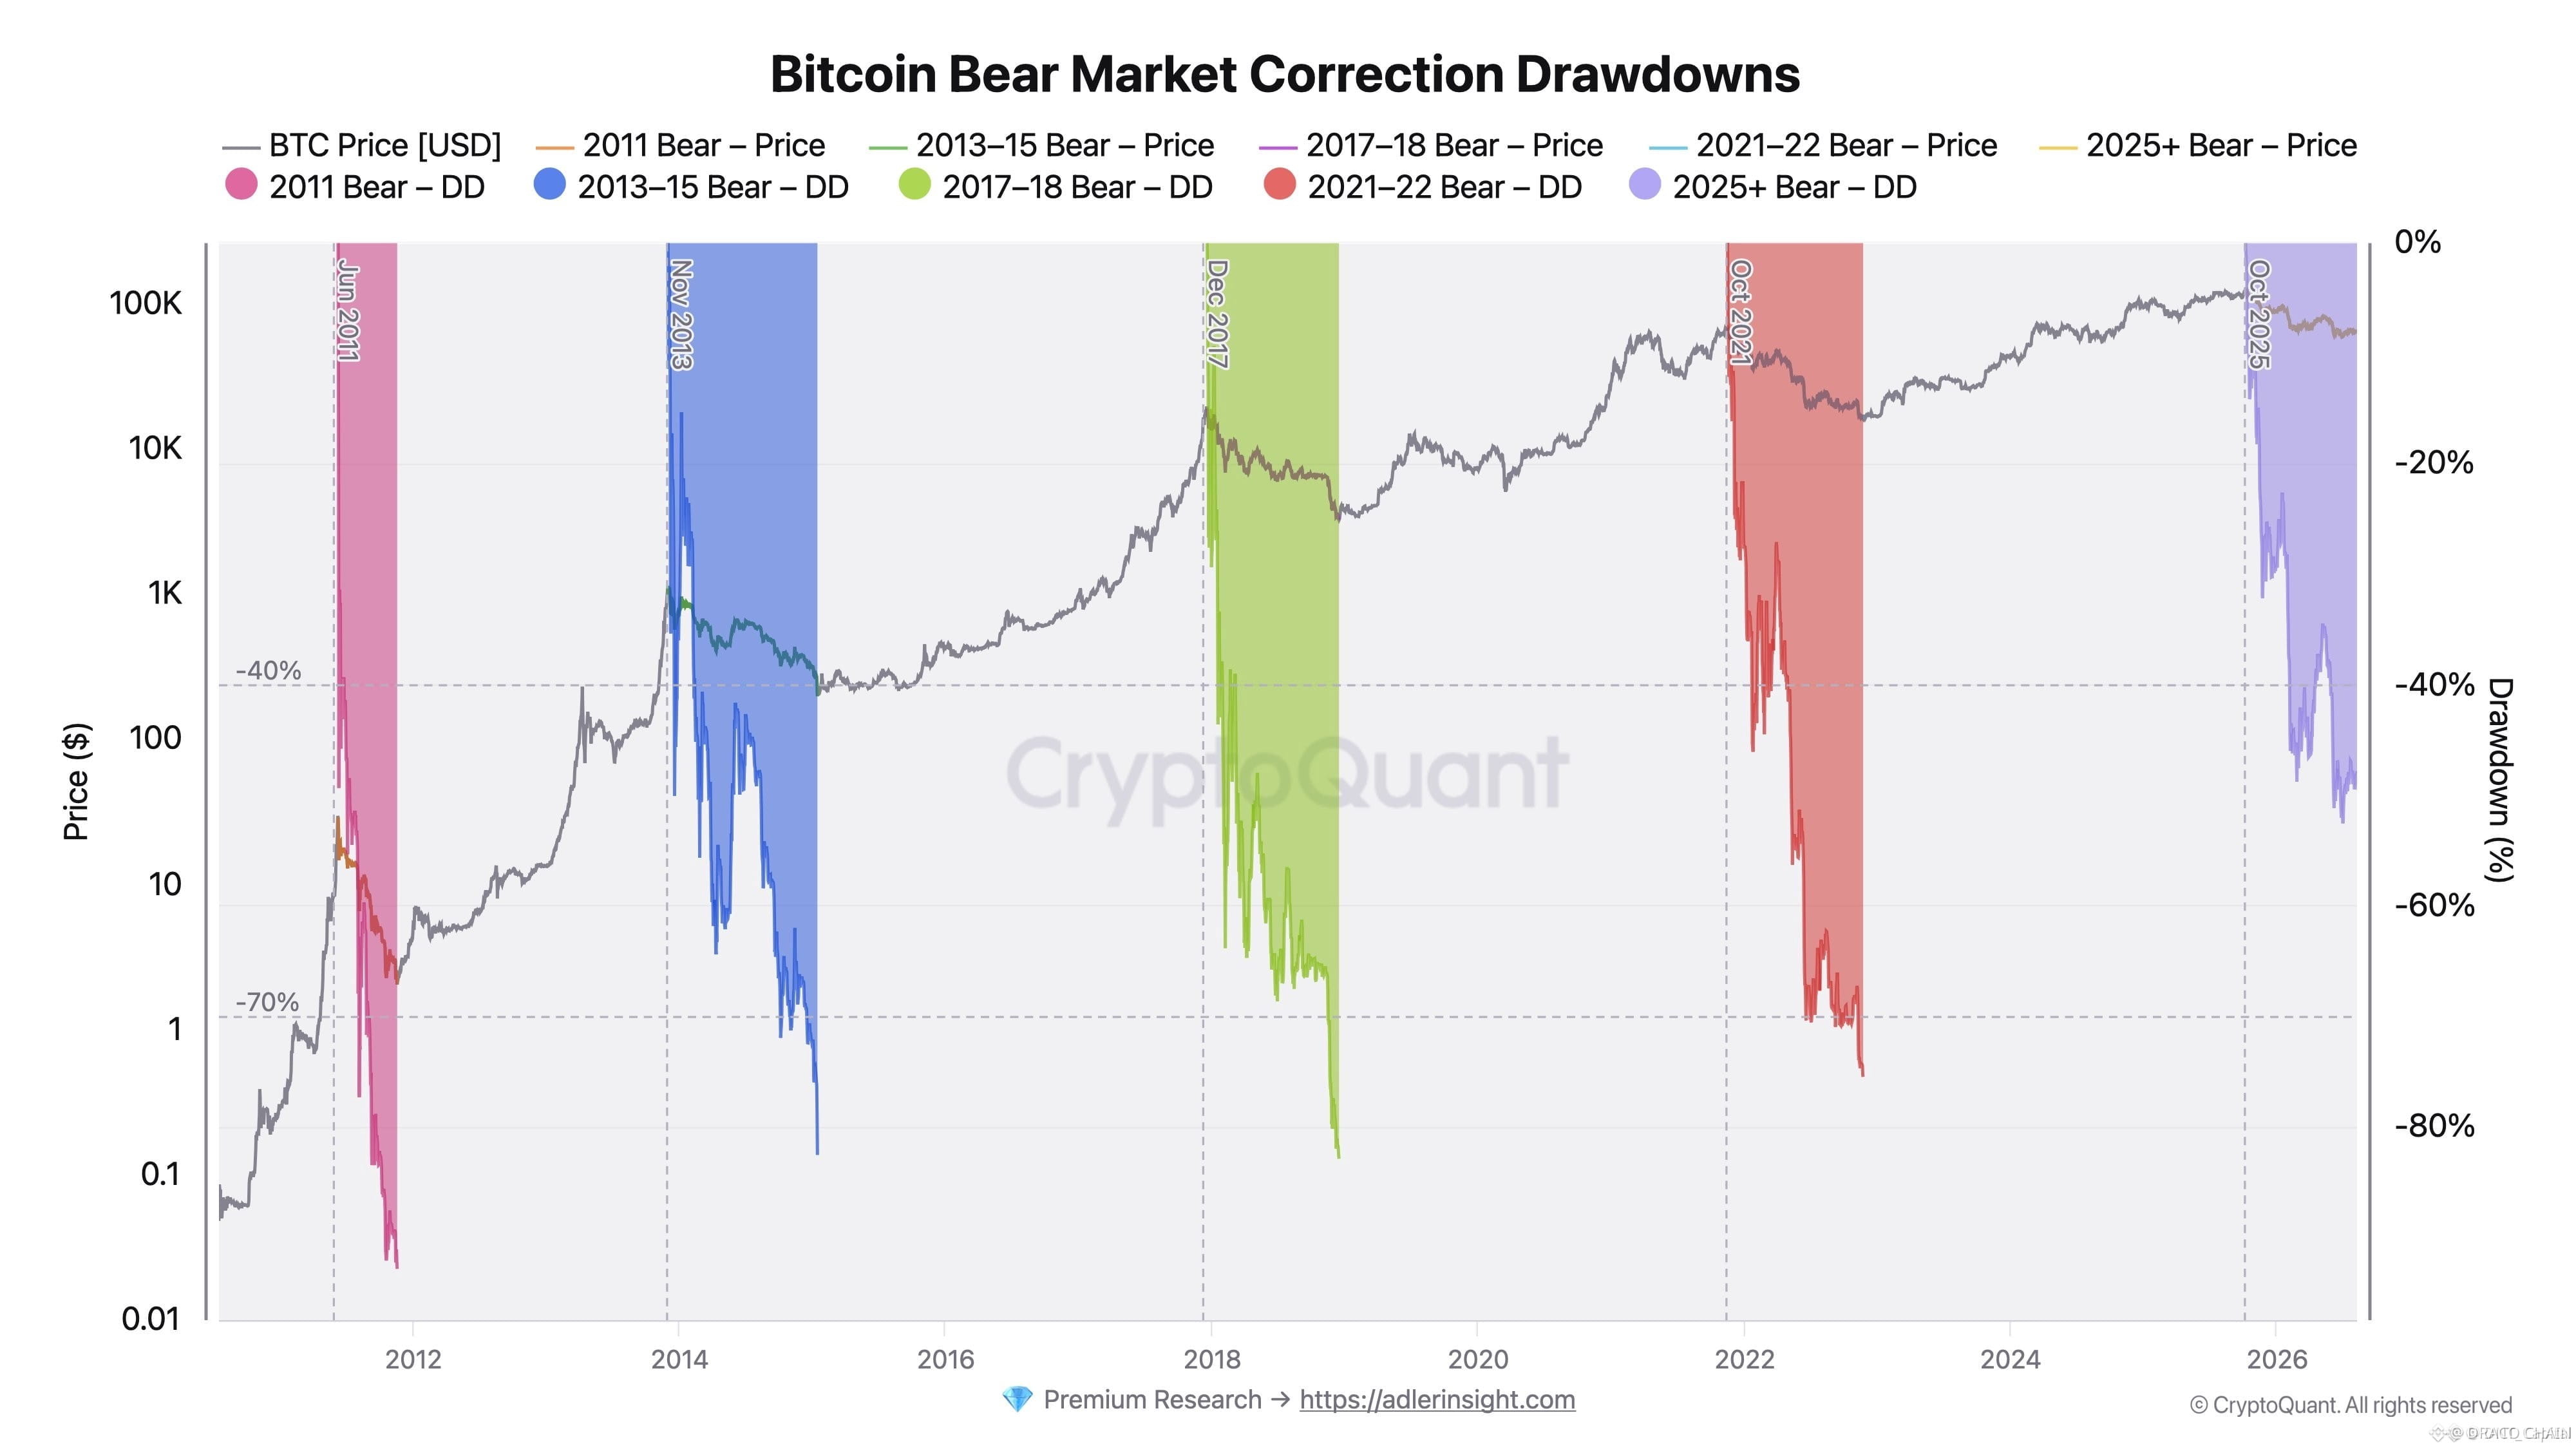
Nojoda parce, cada vez aparecen más análisis apuntando a una posible caída hacia la zona de 40k-49k basándose en los drawdowns históricos de #bitcoin 📉 sígueme para no perderte nada de lo que está por venir
Si observamos los ciclos anteriores, las correcciones han sido cada vez menos agresivas:
📉 2011 → ~93%
📉 2015 → ~85%
📉 2018 → ~84%
📉 2022 → ~77%
Siguiendo esa tendencia, un #drawdown entre 60% y 67% podría llevar a #BTC hacia la zona de 40k-49k 🔥
Personalmente, si ese escenario llegara a darse, veo mucho más probable una visita cerca de 49k que una caída hasta 40k.
Ahora bien, también hay que tener en cuenta algo que antes no existía:
✅ #ETFs comprando $BTC
✅ Empresas acumulando BTC
✅ Menos oferta después del halving
✅ Adopción institucional creciendo
Mientras tanto, BTC sigue mostrando una volatilidad berraca 😅
Hace apenas unas horas subió hasta 64.100 📈
Y después metió una sacudida rápida hasta 62.900 📉
Eso demuestra que las ballenas siguen haciendo de las suyas y que el mercado todavía está lejos de estar tranquilo 🐳🔥
Por ahora la pelea sigue estando entre la zona de 59k-66k, mientras el mercado decide cuál será el próximo movimiento grande.
👀 ¿Tú qué opinas parce, veremos primero los 66k o crees que todavía falta una última sacudida hacia los 50k antes de arrancar la próxima subida? 🚀🐳💰📈
{spot}(BTCUSDT)
🚨🐳 BTC PODRÍA CAER HASTA 49K... PERO HAY ALGO QUE MUCHOS NO ESTÁN VIENDO 👀🔥
Nojoda parce, cada vez aparecen más análisis apuntando a una posible caída hacia la zona de 40k-49k basándose en los drawdowns históricos de #bitcoin 📉 sígueme para no perderte nada de lo que está por venir
Si observamos los ciclos anteriores, las correcciones han sido cada vez menos agresivas:
📉 2011 → ~93%
📉 2015 → ~85%
📉 2018 → ~84%
📉 2022 → ~77%
Siguiendo esa tendencia, un #drawdown entre 60% y 67% podría llevar a #BTC hacia la zona de 40k-49k 🔥
Personalmente, si ese escenario llegara a darse, veo mucho más probable una visita cerca de 49k que una caída hasta 40k.
Ahora bien, también hay que tener en cuenta algo que antes no existía:
✅ #ETFs comprando $BTC
✅ Empresas acumulando BTC
✅ Menos oferta después del halving
✅ Adopción institucional creciendo
Mientras tanto, BTC sigue mostrando una volatilidad berraca 😅
Hace apenas unas horas subió hasta 64.100 📈
Y después metió una sacudida rápida hasta 62.900 📉
Eso demuestra que las ballenas siguen haciendo de las suyas y que el mercado todavía está lejos de estar tranquilo 🐳🔥
Por ahora la pelea sigue estando entre la zona de 59k-66k, mientras el mercado decide cuál será el próximo movimiento grande.
👀 ¿Tú qué opinas parce, veremos primero los 66k o crees que todavía falta una última sacudida hacia los 50k antes de arrancar la próxima subida? 🚀🐳💰📈
Nojoda parce, cada vez aparecen más análisis apuntando a una posible caída hacia la zona de 40k-49k basándose en los drawdowns históricos de #bitcoin 📉 sígueme para no perderte nada de lo que está por venir
Si observamos los ciclos anteriores, las correcciones han sido cada vez menos agresivas:
📉 2011 → ~93%
📉 2015 → ~85%
📉 2018 → ~84%
📉 2022 → ~77%
Siguiendo esa tendencia, un #drawdown entre 60% y 67% podría llevar a #BTC hacia la zona de 40k-49k 🔥
Personalmente, si ese escenario llegara a darse, veo mucho más probable una visita cerca de 49k que una caída hasta 40k.
Ahora bien, también hay que tener en cuenta algo que antes no existía:
✅ #ETFs comprando $BTC
✅ Empresas acumulando BTC
✅ Menos oferta después del halving
✅ Adopción institucional creciendo
Mientras tanto, BTC sigue mostrando una volatilidad berraca 😅
Hace apenas unas horas subió hasta 64.100 📈
Y después metió una sacudida rápida hasta 62.900 📉
Eso demuestra que las ballenas siguen haciendo de las suyas y que el mercado todavía está lejos de estar tranquilo 🐳🔥
Por ahora la pelea sigue estando entre la zona de 59k-66k, mientras el mercado decide cuál será el próximo movimiento grande.
👀 ¿Tú qué opinas parce, veremos primero los 66k o crees que todavía falta una última sacudida hacia los 50k antes de arrancar la próxima subida? 🚀🐳💰📈
9
10
14k

#Drawdown #RiskManagement
USD 100 falls to USD 80: a 20% loss.
A 20% gain on USD 80 adds USD 16, leaving USD 96. Recovering the USD 20 requires 25% of the smaller balance. Arithmetic is not a reason to increase risk.
A hypothetical balance falls from USD 100 to USD 80. Does a 20% gain take it back to USD 100?
Answer: No. Twenty percent of USD 80 is USD 16, leaving USD 96. Getting back to USD 100 requires USD 20, or 25% of USD 80.
This ignores deposits, withdrawals and costs. It describes a changing denominator, not a return forecast.
#Drawdown #RiskManagement
USD 100 falls to USD 80: a 20% loss.
A 20% gain on USD 80 adds USD 16, leaving USD 96. Recovering the USD 20 requires 25% of the smaller balance. Arithmetic is not a reason to increase risk.
A hypothetical balance falls from USD 100 to USD 80. Does a 20% gain take it back to USD 100?
Answer: No. Twenty percent of USD 80 is USD 16, leaving USD 96. Getting back to USD 100 requires USD 20, or 25% of USD 80.
This ignores deposits, withdrawals and costs. It describes a changing denominator, not a return forecast.
USD 100 falls to USD 80: a 20% loss.
A 20% gain on USD 80 adds USD 16, leaving USD 96. Recovering the USD 20 requires 25% of the smaller balance. Arithmetic is not a reason to increase risk.
A hypothetical balance falls from USD 100 to USD 80. Does a 20% gain take it back to USD 100?
Answer: No. Twenty percent of USD 80 is USD 16, leaving USD 96. Getting back to USD 100 requires USD 20, or 25% of USD 80.
This ignores deposits, withdrawals and costs. It describes a changing denominator, not a return forecast.
82

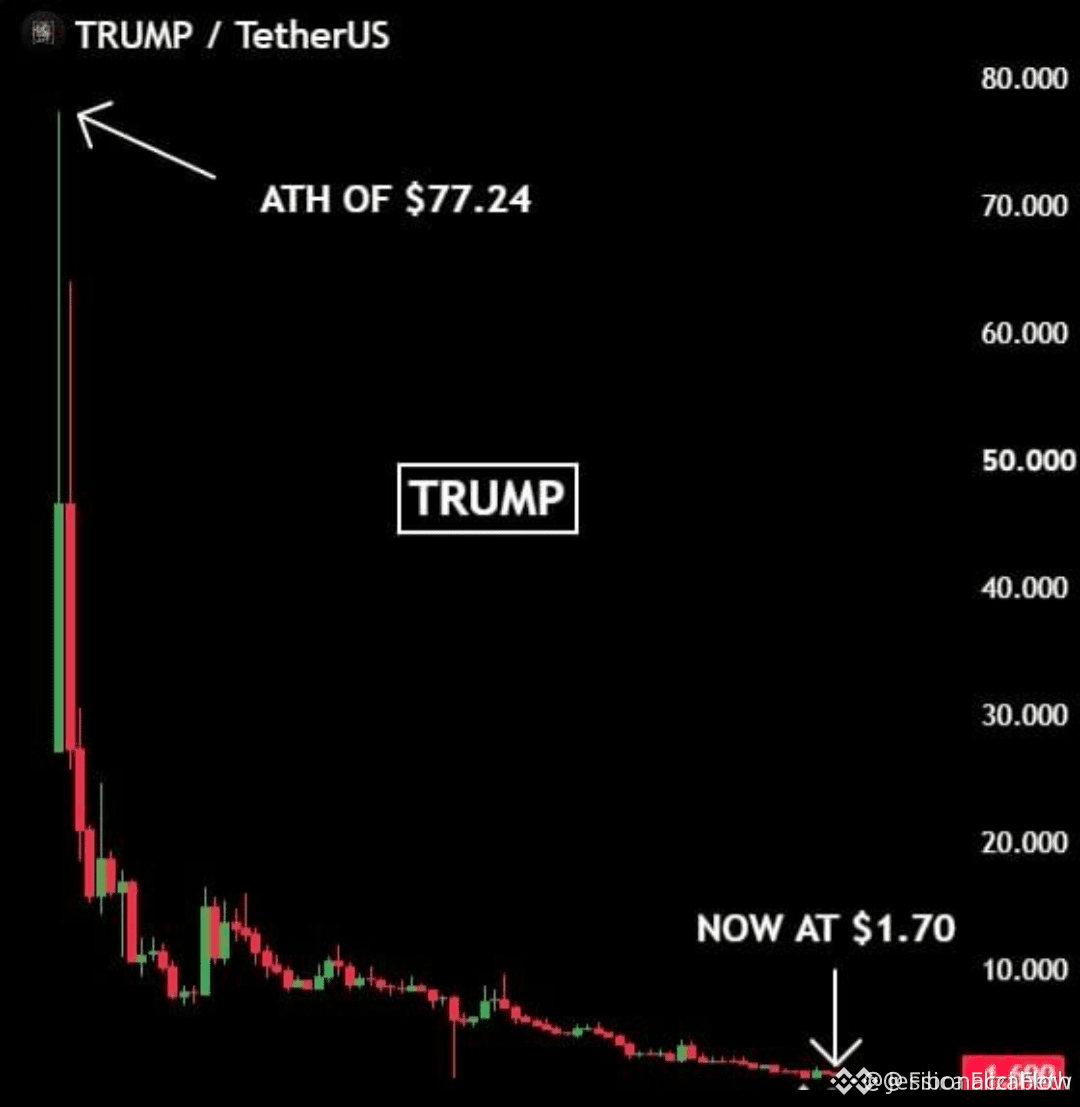
$TRUMP PLUMMETED 97.8% — INVESTORS LOST 98% OF THEIR MONEY 💀
That’s brutal. A $10,000 position at the January peak is now just $220. This kind of drawdown usually flushes out everyone except the most stubborn holders. The token has essentially collapsed under its own hype with no real volume or catalyst to stop the bleed.
The real question is whether this is a bottom or just another level of pain before it goes to zero. Are you still holding or did you cut long ago?
Not financial advice. Always manage your risk.
#TRUMP #CryptoCrash #MemeCoin #Drawdown
⚡
$TRUMP PLUMMETED 97.8% — INVESTORS LOST 98% OF THEIR MONEY 💀
That’s brutal. A $10,000 position at the January peak is now just $220. This kind of drawdown usually flushes out everyone except the most stubborn holders. The token has essentially collapsed under its own hype with no real volume or catalyst to stop the bleed.
The real question is whether this is a bottom or just another level of pain before it goes to zero. Are you still holding or did you cut long ago?
Not financial advice. Always manage your risk.
#TRUMP #CryptoCrash #MemeCoin #Drawdown
⚡
That’s brutal. A $10,000 position at the January peak is now just $220. This kind of drawdown usually flushes out everyone except the most stubborn holders. The token has essentially collapsed under its own hype with no real volume or catalyst to stop the bleed.
The real question is whether this is a bottom or just another level of pain before it goes to zero. Are you still holding or did you cut long ago?
Not financial advice. Always manage your risk.
#TRUMP #CryptoCrash #MemeCoin #Drawdown
⚡
1
3
2.3k

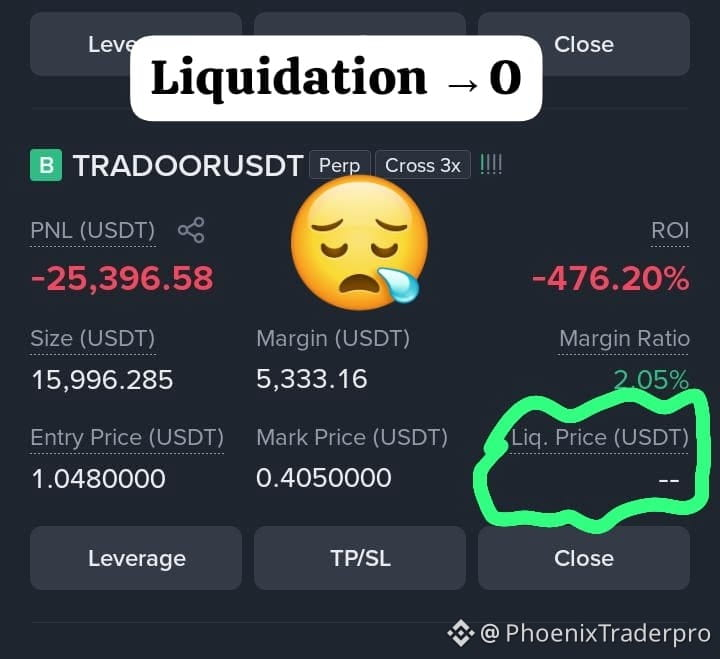
$TRADOOR SURVIVED LIQUIDATION BY A HAIR 😰
Liquidation value hit zero – literally a single tick away from getting wiped. I’m still holding, but the account is sitting at a $25,396 unrealized drawdown. That’s a deep hole, but the fact that the level held tells me something bigger is brewing.
This kind of close call often shakes out weak hands before a real move. Volume has been dropping on the recovery, which could mean accumulation. Are you still in this trade or did you close at the flush?
Not financial advice. Always manage your risk.
#TRADOOR #CryptoSurvival #Drawdown #Hold
🔥
$TRADOOR SURVIVED LIQUIDATION BY A HAIR 😰
Liquidation value hit zero – literally a single tick away from getting wiped. I’m still holding, but the account is sitting at a $25,396 unrealized drawdown. That’s a deep hole, but the fact that the level held tells me something bigger is brewing.
This kind of close call often shakes out weak hands before a real move. Volume has been dropping on the recovery, which could mean accumulation. Are you still in this trade or did you close at the flush?
Not financial advice. Always manage your risk.
#TRADOOR #CryptoSurvival #Drawdown #Hold
🔥
Liquidation value hit zero – literally a single tick away from getting wiped. I’m still holding, but the account is sitting at a $25,396 unrealized drawdown. That’s a deep hole, but the fact that the level held tells me something bigger is brewing.
This kind of close call often shakes out weak hands before a real move. Volume has been dropping on the recovery, which could mean accumulation. Are you still in this trade or did you close at the flush?
Not financial advice. Always manage your risk.
#TRADOOR #CryptoSurvival #Drawdown #Hold
🔥
402

🚨 $BONK SURVIVES $9M DRAWDOWN, SETTING SIGHT ON $50M CLIMB! 💥
📊 Bonk Guy’s portfolio slid from a $28.5M peak to $19M in under a week, a stark liquidity sweep that most traders shy away from highlighting. 🦈 The smart‑money narrative here is resilience: each drawdown carves out deeper order‑blocks, positioning the next upside move on a tighter supply‑demand imbalance. 💡 Institutional liquidity is now primed at the $19M floor, ready to be captured when buying pressure re‑asserts dominance.
📌 The key takeaway isn’t the loss magnitude, but the capacity to endure volatility and re‑enter with confidence as the market rebalances. 🤔 How do you brace your capital for inevitable drawdowns while staying ready for the next upside surge? 👇
⚠️ Not financial advice. Always manage your risk. 🛡️
🏷️ #BONK #Drawdown #PortfolioManagement #Crypto
🦈 🔥
🚨 $BONK SURVIVES $9M DRAWDOWN, SETTING SIGHT ON $50M CLIMB! 💥
📊 Bonk Guy’s portfolio slid from a $28.5M peak to $19M in under a week, a stark liquidity sweep that most traders shy away from highlighting. 🦈 The smart‑money narrative here is resilience: each drawdown carves out deeper order‑blocks, positioning the next upside move on a tighter supply‑demand imbalance. 💡 Institutional liquidity is now primed at the $19M floor, ready to be captured when buying pressure re‑asserts dominance.
📌 The key takeaway isn’t the loss magnitude, but the capacity to endure volatility and re‑enter with confidence as the market rebalances. 🤔 How do you brace your capital for inevitable drawdowns while staying ready for the next upside surge? 👇
⚠️ Not financial advice. Always manage your risk. 🛡️
🏷️ #BONK #Drawdown #PortfolioManagement #Crypto
🦈 🔥
📊 Bonk Guy’s portfolio slid from a $28.5M peak to $19M in under a week, a stark liquidity sweep that most traders shy away from highlighting. 🦈 The smart‑money narrative here is resilience: each drawdown carves out deeper order‑blocks, positioning the next upside move on a tighter supply‑demand imbalance. 💡 Institutional liquidity is now primed at the $19M floor, ready to be captured when buying pressure re‑asserts dominance.
📌 The key takeaway isn’t the loss magnitude, but the capacity to endure volatility and re‑enter with confidence as the market rebalances. 🤔 How do you brace your capital for inevitable drawdowns while staying ready for the next upside surge? 👇
⚠️ Not financial advice. Always manage your risk. 🛡️
🏷️ #BONK #Drawdown #PortfolioManagement #Crypto
🦈 🔥
148
#Drawdown #RiskManagement
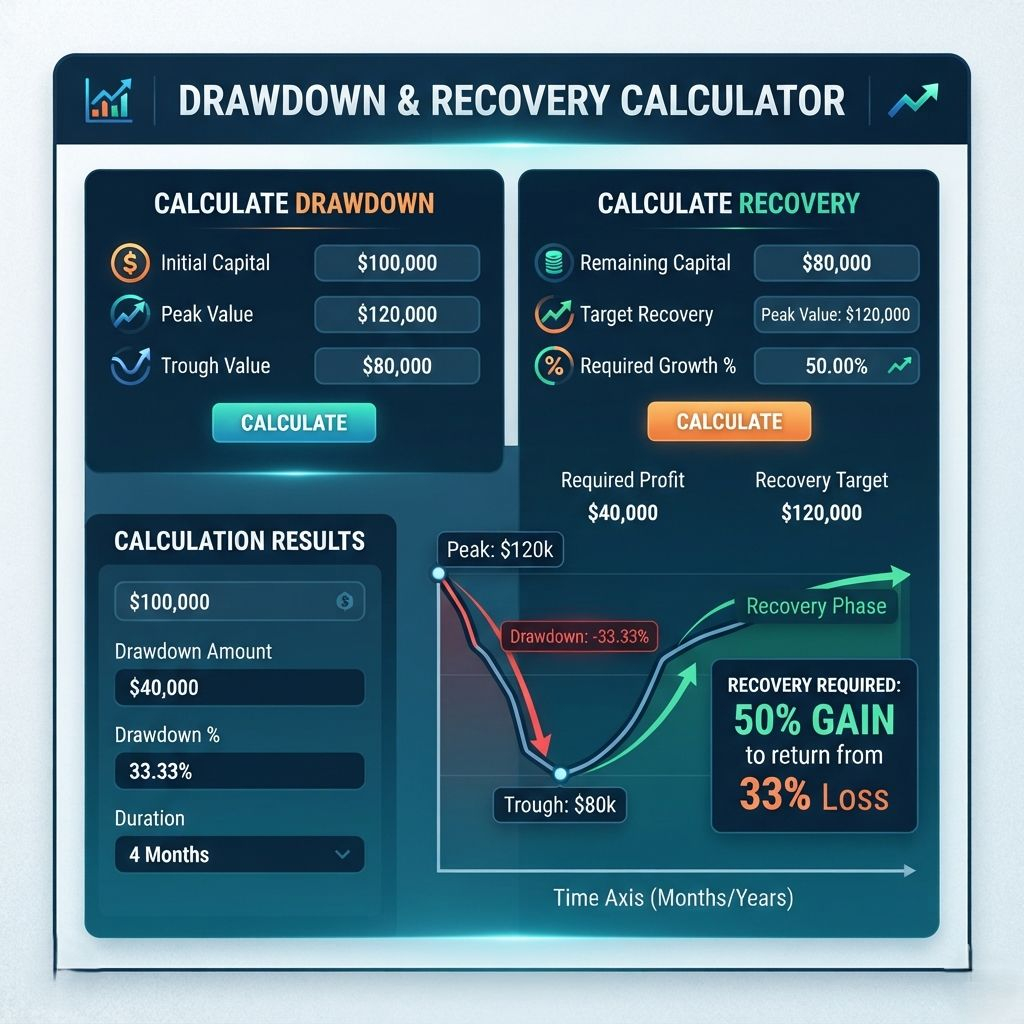
Drawdown: Losing 20% and gaining 20% do not cancel each other out.
The second percentage starts from a smaller balance.
Hypothetical:
Starting balance: USD 100
After a USD 20 loss: USD 80
A 20% gain on USD 80: USD 16
Ending balance: USD 96
To return from USD 80 to USD 100, the required USD 20 gain is 25% of USD 80.
That is arithmetic, not a recovery target or a reason to take more risk.
This ignores deposits, withdrawals and costs.
It describes a changing denominator, not a return forecast.
#Drawdown #RiskManagement
Drawdown: Losing 20% and gaining 20% do not cancel each other out.
The second percentage starts from a smaller balance.
Hypothetical:
Starting balance: USD 100
After a USD 20 loss: USD 80
A 20% gain on USD 80: USD 16
Ending balance: USD 96
To return from USD 80 to USD 100, the required USD 20 gain is 25% of USD 80.
That is arithmetic, not a recovery target or a reason to take more risk.
This ignores deposits, withdrawals and costs.
It describes a changing denominator, not a return forecast.
Drawdown: Losing 20% and gaining 20% do not cancel each other out.
The second percentage starts from a smaller balance.
Hypothetical:
Starting balance: USD 100
After a USD 20 loss: USD 80
A 20% gain on USD 80: USD 16
Ending balance: USD 96
To return from USD 80 to USD 100, the required USD 20 gain is 25% of USD 80.
That is arithmetic, not a recovery target or a reason to take more risk.
This ignores deposits, withdrawals and costs.
It describes a changing denominator, not a return forecast.
67

·
--
Проверено
Статья
S&P 500 Is 8.2% Below Its Record After Six Straight Losses: What Happened After the Previous 34 TimeDisclosure: It is not financial advice.
On Thursday 19 November 2026 the S&P 500 fell 2.02% to 7,175.83, its sixth straight loss, according to CNBC. AP described it as the longest losing streak in two and a half years and put the index 8.2% below the all-time high set last month.
A line like that makes people ask two things: "how bad can it get?" and "how long until it is back?" I did not want to answer from feeling, so I pulled the index history and counted.
What the last six days look like
I used Yahoo Finance daily closes for the S&P 500 (the price index, so dividends are excluded). The record close is 7,818.93 on 6 October 2026. The last close, 7,175.83, is 8.22% below it.
The six losing days are 12 to 19 November. Together they took the index from 7,619.38 (11 November) to 7,175.83, a fall of 5.82%. The other 2.5% came earlier, between the record and 11 November.
The first piece of arithmetic: why recovery needs more than 8.22%
Losses and gains are not symmetric. If $10,000 was invested at the record close, it is $9,177.51 today. To get back to $10,000 it needs to gain $822.49, which is +8.96% on the smaller base.
The same formula gets steep fast. A 20% fall needs a 25% gain. The 2020 low, 33.9% below the peak, needed 51.35%. The 2007 to 2009 low, 56.8% below, needed about 131%. I am not saying that is where we are going. I am saying the cost of a deeper fall is not linear.
What happened after the previous 34 times
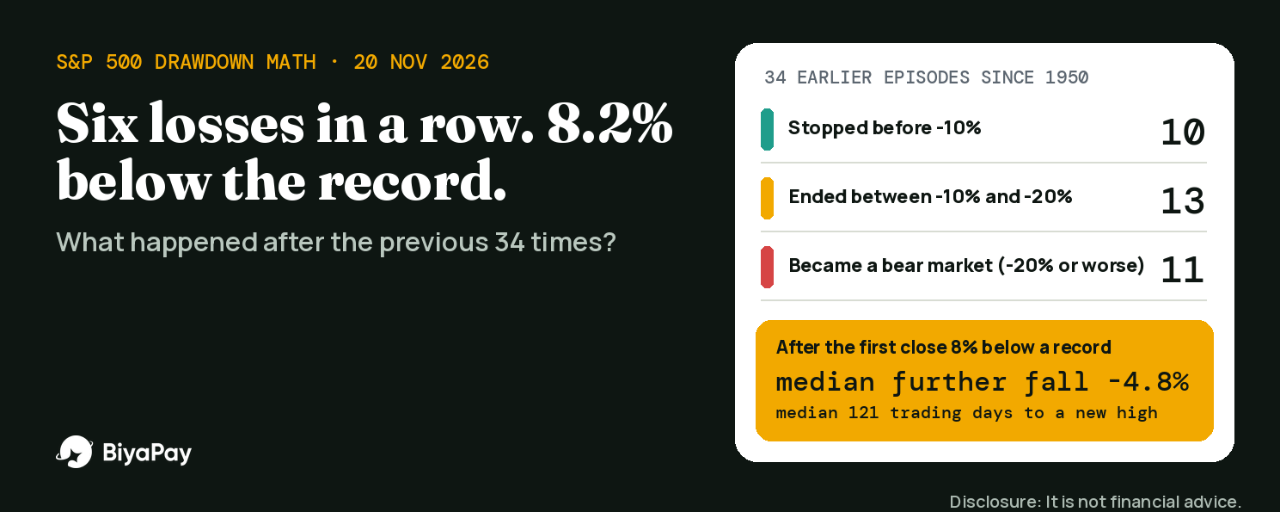
Next I counted every time since 1950 that the S&P 500 first closed at least 8% below a record high. I counted one episode per record high and left out the current one. That gives 34 episodes, and all 34 have since made a new closing high.
How they ended:
- 10 of 34 stopped before reaching -10%
- 13 of 34 ended between -10% and -20%
- 11 of 34 became bear markets of -20% or worse (with troughs in 1957, 1962, 1966, 1970, 1974, 1982, 1987, 2002, 2009, 2020 and 2022)
After that first close 8% below a record, the median further fall was 4.8%. In 17 of the 34 cases the index fell at least another 5%, in 15 at least another 10%, and in 8 at least another 20%.
On the other side, the median time from the first -8% close to a new closing high was 121 trading days, about six months. The range is wide: 12 days in March-April 2026, 32 days in 2024, and 1,851 days after 1973.
One year after that first close, the index was higher in 22 of the 33 episodes that have a full year of data behind them, with a median change of +8.4%. It was lower in 11, and the worst was -37.5% from November 2007.
Reading it honestly: this is close to a coin flip on whether the first -8% is the worst of it. The sample is small, the episodes overlap with very different backdrops, and price-only data understates recoveries because dividends are left out.
What this is not telling you
It covers the broad US index, not a single stock. AMD lost nearly 8% on Thursday after Hunterbrook Capital disclosed a short position (CNBC), which is a different kind of risk from an index drifting lower.
It also says nothing about this exact cycle. The Fed's October minutes showed officials open to more rate hikes, and futures were pricing a 25 basis point hike for December (Straits Times, 19 November). The 10-year Treasury yield was about 5.05% on Thursday (CoinDesk). Many of the 34 episodes came with different rate backdrops, so I treat them as a range of outcomes, not a forecast.
What you can do with BiyaPay: the S&P 500 through an ETF
If someone wants S&P 500 exposure without picking stocks, the usual route is an ETF. BiyaPay's public pages list the three biggest S&P 500 funds: VOO, SPY and IVV. I checked them signed out on 20 November 2026 at about 05:17 to 05:19 WIB.
- What is shown: VOO showed a post-market price of 658.01, equal to its 19 November close in Yahoo's data. SPY showed 715.87 and IVV 719.05, which also match. The order panel shows Buy and Sell, Limit, Market and Stop order, and a session choice of pre-market, regular and after-hours
- Requirements: the page says BiyaPay cannot provide services in the United States. Trading needs a sign-in; I stopped at the login and did not open an account for this article
- Fees: on BiyaPay's Cost Center, US stock commission is $0, platform fee is $0.005 per share with a $0.99 minimum per order and a 1% cap, settlement is $0.003 per share, and SEC and trading activity fees apply to sells. On 15 whole shares of VOO ($9,870.15) my arithmetic gives $1.035 to buy and $1.248 to sell, $2.283 in total, or 0.023%
- Fund cost: VOO and IVV charge a 0.03% expense ratio and SPY 0.0945%, according to their fund documents. On $9,870 that is about $2.96 a year for VOO
- Not verified: minimum deposit, deposit methods and limits sit behind the login, and I have not checked whether any of these ETFs allows fractional orders. I would check both in the app before planning around them
Fees are not the reason to buy or not buy. At this size they are tiny next to the market moving 2% in a day, which is why I would spend my effort on position size instead.
My opinion
I do not know if 7,175.83 is the low, and the 34 episodes say nobody should be confident either way. What I take from them is simpler.
First, size matters more than timing. If a 20% fall, which would turn $10,000 into $8,000, would force me to sell something I need, the position is too big already.
Second, if I add, I would add in steps decided in advance, not all at once because of a headline. On an account this size, splitting into a few whole-share orders costs about $1 in fees per order.
Third, I would not use leverage into a streak like this. A drawdown that history says can run another 5% to 10% is exactly when forced selling hurts.
When this applies, and when it does not
This applies to a broad US stock index and to someone who can hold for years. It does not apply to single stocks, to leveraged or short-term products, to money needed within a year, or to anyone who cannot sleep at -20%. The statistics are from price data, and a different definition of an episode would give slightly different counts.
Checklist I use
- Write down the drop I could accept before I buy, in dollars, not in percent
- Remember that recovery math is not symmetric: -20% needs +25%
- Check whether I am looking at an index, an ETF or a single stock
- Decide the buying steps in advance, with a date or a level, not in the middle of a red day
- Read the order preview for fees before confirming, and the fund's expense ratio once
- Confirm the service is available in my country and what the deposit route costs
- Do not borrow to buy a falling market
Sources (all checked 20 November 2026, Asia/Jakarta): CNBC, "Stock market news for Nov. 19, 2026"; AP, "Wall Street tumbles to its longest losing streak since 2024 as the Dow drops 1,100 points" (19 November 2026); Straits Times, "Wall Street ends mixed after Nvidia earnings and Fed minutes" (19 November 2026); CoinDesk live updates, 19 November 2026; Yahoo Finance daily closes for ^GSPC (1950 to 19 November 2026), VOO, SPY and IVV; BiyaPay VOO, SPY and IVV pages and Cost Center US stock fees (20 November 2026); Vanguard VOO fact sheet (25 March 2026); iShares IVV prospectus (31 July 2026); State Street SPY prospectus (0.0945%). Episode counts, streak sums and fee arithmetic are my own calculations.
#BiyaPay #SP500 #ETF #StockMarket #Drawdown
S&P 500 Is 8.2% Below Its Record After Six Straight Losses: What Happened After the Previous 34 Time
Disclosure: It is not financial advice.
On Thursday 19 November 2026 the S&P 500 fell 2.02% to 7,175.83, its sixth straight loss, according to CNBC. AP described it as the longest losing streak in two and a half years and put the index 8.2% below the all-time high set last month.
A line like that makes people ask two things: "how bad can it get?" and "how long until it is back?" I did not want to answer from feeling, so I pulled the index history and counted.
What the last six days look like
I used Yahoo Finance daily closes for the S&P 500 (the price index, so dividends are excluded). The record close is 7,818.93 on 6 October 2026. The last close, 7,175.83, is 8.22% below it.
The six losing days are 12 to 19 November. Together they took the index from 7,619.38 (11 November) to 7,175.83, a fall of 5.82%. The other 2.5% came earlier, between the record and 11 November.
The first piece of arithmetic: why recovery needs more than 8.22%
Losses and gains are not symmetric. If $10,000 was invested at the record close, it is $9,177.51 today. To get back to $10,000 it needs to gain $822.49, which is +8.96% on the smaller base.
The same formula gets steep fast. A 20% fall needs a 25% gain. The 2020 low, 33.9% below the peak, needed 51.35%. The 2007 to 2009 low, 56.8% below, needed about 131%. I am not saying that is where we are going. I am saying the cost of a deeper fall is not linear.
What happened after the previous 34 times
Next I counted every time since 1950 that the S&P 500 first closed at least 8% below a record high. I counted one episode per record high and left out the current one. That gives 34 episodes, and all 34 have since made a new closing high.
How they ended:
- 10 of 34 stopped before reaching -10%
- 13 of 34 ended between -10% and -20%
- 11 of 34 became bear markets of -20% or worse (with troughs in 1957, 1962, 1966, 1970, 1974, 1982, 1987, 2002, 2009, 2020 and 2022)
After that first close 8% below a record, the median further fall was 4.8%. In 17 of the 34 cases the index fell at least another 5%, in 15 at least another 10%, and in 8 at least another 20%.
On the other side, the median time from the first -8% close to a new closing high was 121 trading days, about six months. The range is wide: 12 days in March-April 2026, 32 days in 2024, and 1,851 days after 1973.
One year after that first close, the index was higher in 22 of the 33 episodes that have a full year of data behind them, with a median change of +8.4%. It was lower in 11, and the worst was -37.5% from November 2007.
Reading it honestly: this is close to a coin flip on whether the first -8% is the worst of it. The sample is small, the episodes overlap with very different backdrops, and price-only data understates recoveries because dividends are left out.
What this is not telling you
It covers the broad US index, not a single stock. AMD lost nearly 8% on Thursday after Hunterbrook Capital disclosed a short position (CNBC), which is a different kind of risk from an index drifting lower.
It also says nothing about this exact cycle. The Fed's October minutes showed officials open to more rate hikes, and futures were pricing a 25 basis point hike for December (Straits Times, 19 November). The 10-year Treasury yield was about 5.05% on Thursday (CoinDesk). Many of the 34 episodes came with different rate backdrops, so I treat them as a range of outcomes, not a forecast.
What you can do with BiyaPay: the S&P 500 through an ETF
If someone wants S&P 500 exposure without picking stocks, the usual route is an ETF. BiyaPay's public pages list the three biggest S&P 500 funds: VOO, SPY and IVV. I checked them signed out on 20 November 2026 at about 05:17 to 05:19 WIB.
- What is shown: VOO showed a post-market price of 658.01, equal to its 19 November close in Yahoo's data. SPY showed 715.87 and IVV 719.05, which also match. The order panel shows Buy and Sell, Limit, Market and Stop order, and a session choice of pre-market, regular and after-hours
- Requirements: the page says BiyaPay cannot provide services in the United States. Trading needs a sign-in; I stopped at the login and did not open an account for this article
- Fees: on BiyaPay's Cost Center, US stock commission is $0, platform fee is $0.005 per share with a $0.99 minimum per order and a 1% cap, settlement is $0.003 per share, and SEC and trading activity fees apply to sells. On 15 whole shares of VOO ($9,870.15) my arithmetic gives $1.035 to buy and $1.248 to sell, $2.283 in total, or 0.023%
- Fund cost: VOO and IVV charge a 0.03% expense ratio and SPY 0.0945%, according to their fund documents. On $9,870 that is about $2.96 a year for VOO
- Not verified: minimum deposit, deposit methods and limits sit behind the login, and I have not checked whether any of these ETFs allows fractional orders. I would check both in the app before planning around them
Fees are not the reason to buy or not buy. At this size they are tiny next to the market moving 2% in a day, which is why I would spend my effort on position size instead.
My opinion
I do not know if 7,175.83 is the low, and the 34 episodes say nobody should be confident either way. What I take from them is simpler.
First, size matters more than timing. If a 20% fall, which would turn $10,000 into $8,000, would force me to sell something I need, the position is too big already.
Second, if I add, I would add in steps decided in advance, not all at once because of a headline. On an account this size, splitting into a few whole-share orders costs about $1 in fees per order.
Third, I would not use leverage into a streak like this. A drawdown that history says can run another 5% to 10% is exactly when forced selling hurts.
When this applies, and when it does not
This applies to a broad US stock index and to someone who can hold for years. It does not apply to single stocks, to leveraged or short-term products, to money needed within a year, or to anyone who cannot sleep at -20%. The statistics are from price data, and a different definition of an episode would give slightly different counts.
Checklist I use
- Write down the drop I could accept before I buy, in dollars, not in percent
- Remember that recovery math is not symmetric: -20% needs +25%
- Check whether I am looking at an index, an ETF or a single stock
- Decide the buying steps in advance, with a date or a level, not in the middle of a red day
- Read the order preview for fees before confirming, and the fund's expense ratio once
- Confirm the service is available in my country and what the deposit route costs
- Do not borrow to buy a falling market
Sources (all checked 20 November 2026, Asia/Jakarta): CNBC, "Stock market news for Nov. 19, 2026"; AP, "Wall Street tumbles to its longest losing streak since 2024 as the Dow drops 1,100 points" (19 November 2026); Straits Times, "Wall Street ends mixed after Nvidia earnings and Fed minutes" (19 November 2026); CoinDesk live updates, 19 November 2026; Yahoo Finance daily closes for ^GSPC (1950 to 19 November 2026), VOO, SPY and IVV; BiyaPay VOO, SPY and IVV pages and Cost Center US stock fees (20 November 2026); Vanguard VOO fact sheet (25 March 2026); iShares IVV prospectus (31 July 2026); State Street SPY prospectus (0.0945%). Episode counts, streak sums and fee arithmetic are my own calculations.
#BiyaPay #SP500 #ETF #StockMarket #Drawdown
On Thursday 19 November 2026 the S&P 500 fell 2.02% to 7,175.83, its sixth straight loss, according to CNBC. AP described it as the longest losing streak in two and a half years and put the index 8.2% below the all-time high set last month.
A line like that makes people ask two things: "how bad can it get?" and "how long until it is back?" I did not want to answer from feeling, so I pulled the index history and counted.
What the last six days look like
I used Yahoo Finance daily closes for the S&P 500 (the price index, so dividends are excluded). The record close is 7,818.93 on 6 October 2026. The last close, 7,175.83, is 8.22% below it.
The six losing days are 12 to 19 November. Together they took the index from 7,619.38 (11 November) to 7,175.83, a fall of 5.82%. The other 2.5% came earlier, between the record and 11 November.
The first piece of arithmetic: why recovery needs more than 8.22%
Losses and gains are not symmetric. If $10,000 was invested at the record close, it is $9,177.51 today. To get back to $10,000 it needs to gain $822.49, which is +8.96% on the smaller base.
The same formula gets steep fast. A 20% fall needs a 25% gain. The 2020 low, 33.9% below the peak, needed 51.35%. The 2007 to 2009 low, 56.8% below, needed about 131%. I am not saying that is where we are going. I am saying the cost of a deeper fall is not linear.
What happened after the previous 34 times
Next I counted every time since 1950 that the S&P 500 first closed at least 8% below a record high. I counted one episode per record high and left out the current one. That gives 34 episodes, and all 34 have since made a new closing high.
How they ended:
- 10 of 34 stopped before reaching -10%
- 13 of 34 ended between -10% and -20%
- 11 of 34 became bear markets of -20% or worse (with troughs in 1957, 1962, 1966, 1970, 1974, 1982, 1987, 2002, 2009, 2020 and 2022)
After that first close 8% below a record, the median further fall was 4.8%. In 17 of the 34 cases the index fell at least another 5%, in 15 at least another 10%, and in 8 at least another 20%.
On the other side, the median time from the first -8% close to a new closing high was 121 trading days, about six months. The range is wide: 12 days in March-April 2026, 32 days in 2024, and 1,851 days after 1973.
One year after that first close, the index was higher in 22 of the 33 episodes that have a full year of data behind them, with a median change of +8.4%. It was lower in 11, and the worst was -37.5% from November 2007.
Reading it honestly: this is close to a coin flip on whether the first -8% is the worst of it. The sample is small, the episodes overlap with very different backdrops, and price-only data understates recoveries because dividends are left out.
What this is not telling you
It covers the broad US index, not a single stock. AMD lost nearly 8% on Thursday after Hunterbrook Capital disclosed a short position (CNBC), which is a different kind of risk from an index drifting lower.
It also says nothing about this exact cycle. The Fed's October minutes showed officials open to more rate hikes, and futures were pricing a 25 basis point hike for December (Straits Times, 19 November). The 10-year Treasury yield was about 5.05% on Thursday (CoinDesk). Many of the 34 episodes came with different rate backdrops, so I treat them as a range of outcomes, not a forecast.
What you can do with BiyaPay: the S&P 500 through an ETF
If someone wants S&P 500 exposure without picking stocks, the usual route is an ETF. BiyaPay's public pages list the three biggest S&P 500 funds: VOO, SPY and IVV. I checked them signed out on 20 November 2026 at about 05:17 to 05:19 WIB.
- What is shown: VOO showed a post-market price of 658.01, equal to its 19 November close in Yahoo's data. SPY showed 715.87 and IVV 719.05, which also match. The order panel shows Buy and Sell, Limit, Market and Stop order, and a session choice of pre-market, regular and after-hours
- Requirements: the page says BiyaPay cannot provide services in the United States. Trading needs a sign-in; I stopped at the login and did not open an account for this article
- Fees: on BiyaPay's Cost Center, US stock commission is $0, platform fee is $0.005 per share with a $0.99 minimum per order and a 1% cap, settlement is $0.003 per share, and SEC and trading activity fees apply to sells. On 15 whole shares of VOO ($9,870.15) my arithmetic gives $1.035 to buy and $1.248 to sell, $2.283 in total, or 0.023%
- Fund cost: VOO and IVV charge a 0.03% expense ratio and SPY 0.0945%, according to their fund documents. On $9,870 that is about $2.96 a year for VOO
- Not verified: minimum deposit, deposit methods and limits sit behind the login, and I have not checked whether any of these ETFs allows fractional orders. I would check both in the app before planning around them
Fees are not the reason to buy or not buy. At this size they are tiny next to the market moving 2% in a day, which is why I would spend my effort on position size instead.
My opinion
I do not know if 7,175.83 is the low, and the 34 episodes say nobody should be confident either way. What I take from them is simpler.
First, size matters more than timing. If a 20% fall, which would turn $10,000 into $8,000, would force me to sell something I need, the position is too big already.
Second, if I add, I would add in steps decided in advance, not all at once because of a headline. On an account this size, splitting into a few whole-share orders costs about $1 in fees per order.
Third, I would not use leverage into a streak like this. A drawdown that history says can run another 5% to 10% is exactly when forced selling hurts.
When this applies, and when it does not
This applies to a broad US stock index and to someone who can hold for years. It does not apply to single stocks, to leveraged or short-term products, to money needed within a year, or to anyone who cannot sleep at -20%. The statistics are from price data, and a different definition of an episode would give slightly different counts.
Checklist I use
- Write down the drop I could accept before I buy, in dollars, not in percent
- Remember that recovery math is not symmetric: -20% needs +25%
- Check whether I am looking at an index, an ETF or a single stock
- Decide the buying steps in advance, with a date or a level, not in the middle of a red day
- Read the order preview for fees before confirming, and the fund's expense ratio once
- Confirm the service is available in my country and what the deposit route costs
- Do not borrow to buy a falling market
Sources (all checked 20 November 2026, Asia/Jakarta): CNBC, "Stock market news for Nov. 19, 2026"; AP, "Wall Street tumbles to its longest losing streak since 2024 as the Dow drops 1,100 points" (19 November 2026); Straits Times, "Wall Street ends mixed after Nvidia earnings and Fed minutes" (19 November 2026); CoinDesk live updates, 19 November 2026; Yahoo Finance daily closes for ^GSPC (1950 to 19 November 2026), VOO, SPY and IVV; BiyaPay VOO, SPY and IVV pages and Cost Center US stock fees (20 November 2026); Vanguard VOO fact sheet (25 March 2026); iShares IVV prospectus (31 July 2026); State Street SPY prospectus (0.0945%). Episode counts, streak sums and fee arithmetic are my own calculations.
#BiyaPay #SP500 #ETF #StockMarket #Drawdown
1
1k
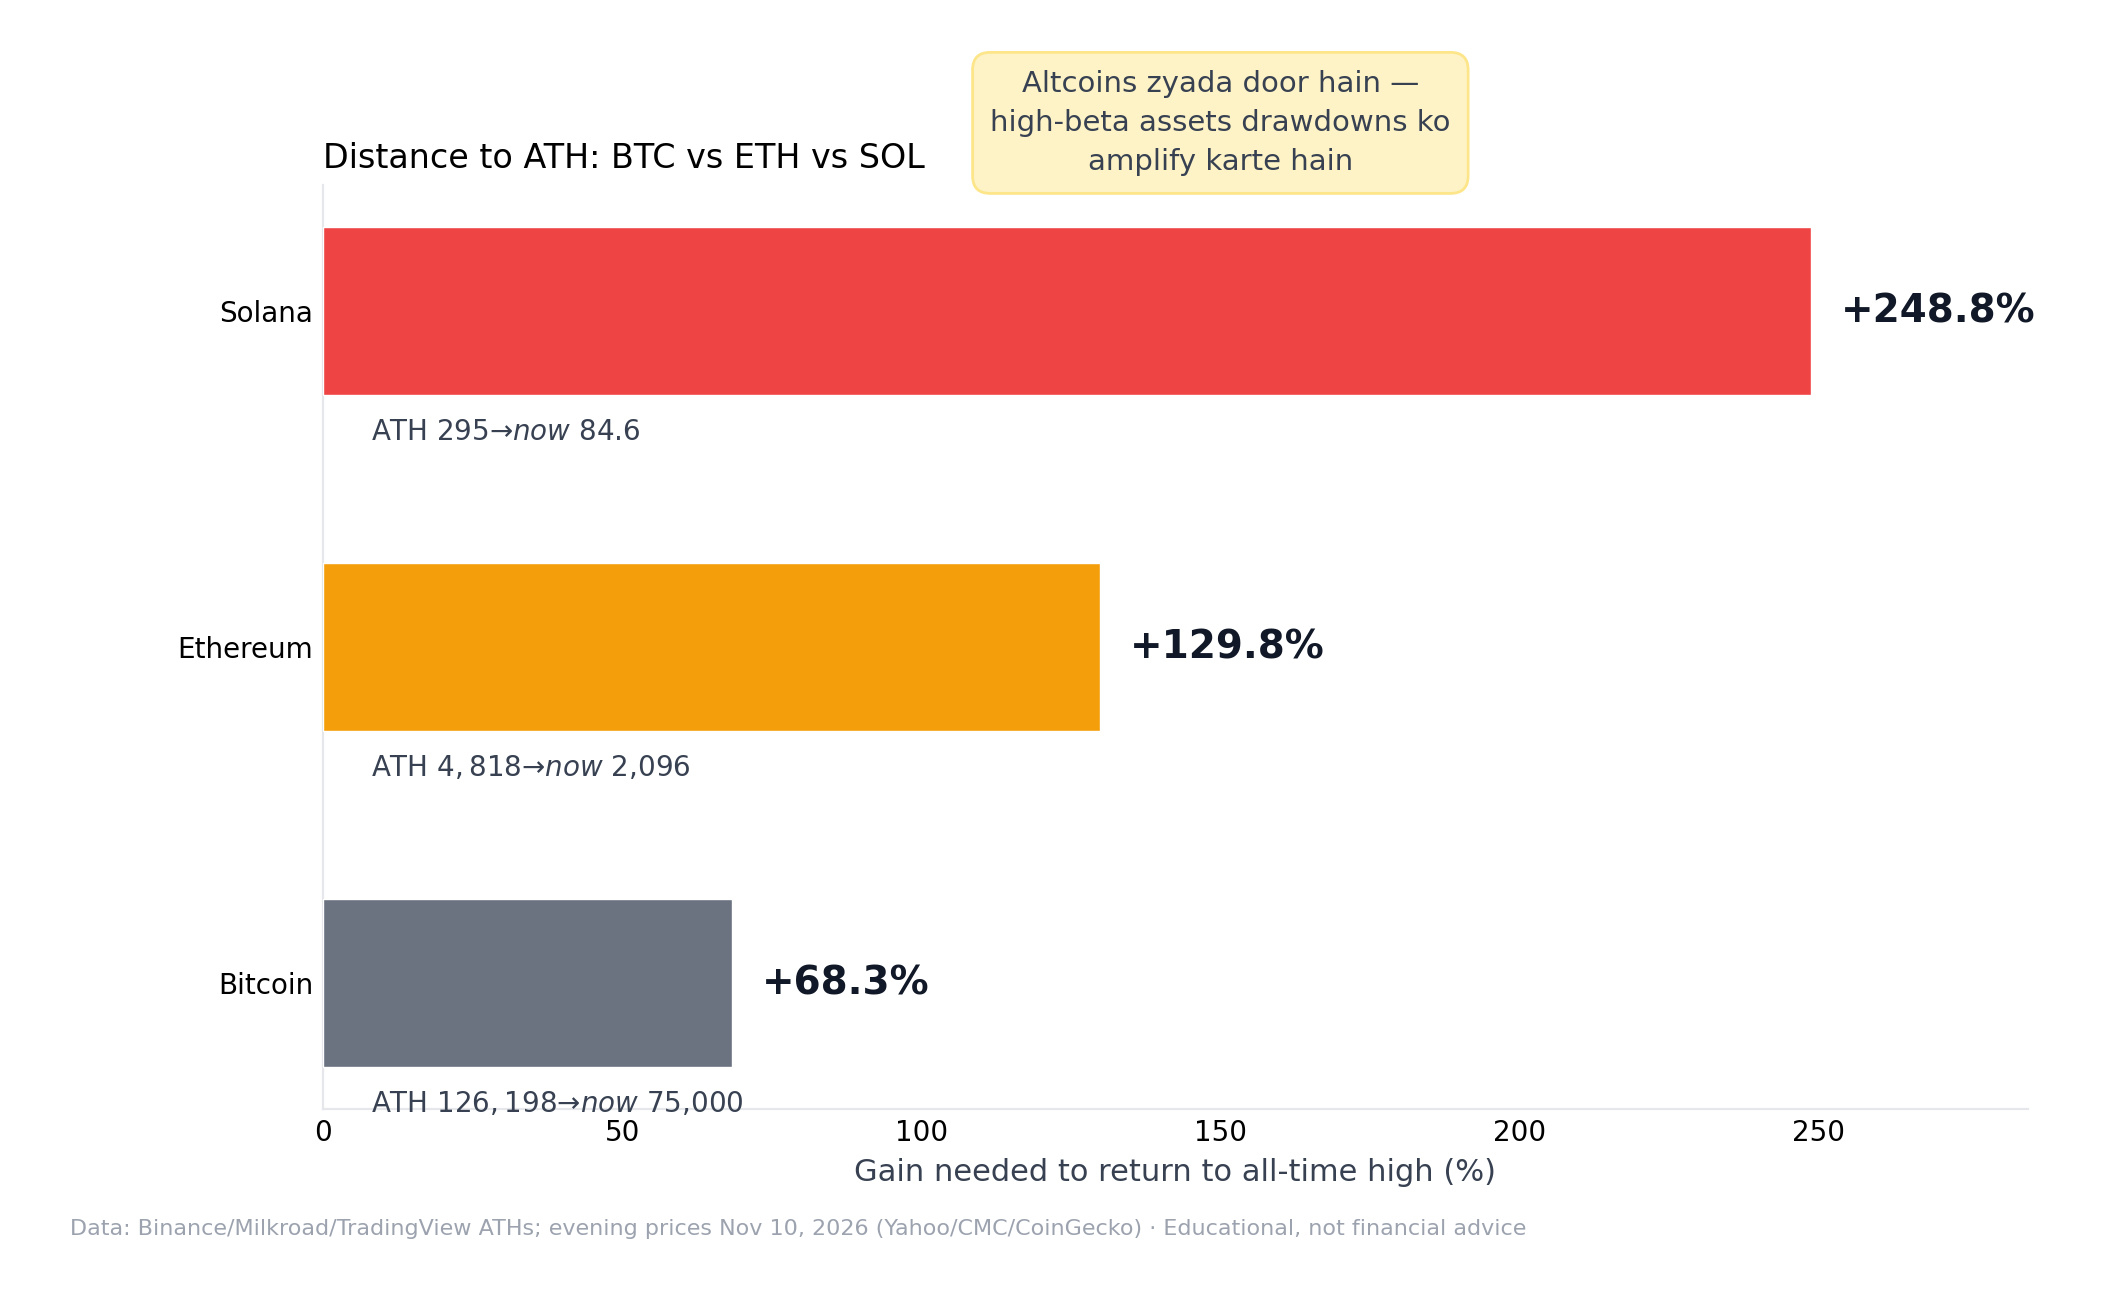
📏 Distance to ATH — altcoins kitne door hain? Ek chart, poora scale.
Numbers (aaj shaam ke prices):
1️⃣ BTC: ATH $126,198 → ~$75K: +68.3% chahiye
2️⃣ ETH: ATH $4,818 → ~$2,096: +129.8% chahiye
3️⃣ SOL: ATH $295 → ~$84.6: +248.8% chahiye
Pattern saaf: BTC se neeche jao to recovery ka safar lamba. High-beta assets zyada girte hain, wapas aane mein zyada waqt lagta hai.
Ye hope ka nahi, math ka chart hai: har price level ka apna recovery % hota hai. Expectations ko isi scale par rakho.
Educational context, not financial advice. 🧮
$BTC $ETH $SOL
#Altcoins #CryptoAnalysis #Drawdown
📏 Distance to ATH — altcoins kitne door hain? Ek chart, poora scale.
Numbers (aaj shaam ke prices):
1️⃣ BTC: ATH $126,198 → ~$75K: +68.3% chahiye
2️⃣ ETH: ATH $4,818 → ~$2,096: +129.8% chahiye
3️⃣ SOL: ATH $295 → ~$84.6: +248.8% chahiye
Pattern saaf: BTC se neeche jao to recovery ka safar lamba. High-beta assets zyada girte hain, wapas aane mein zyada waqt lagta hai.
Ye hope ka nahi, math ka chart hai: har price level ka apna recovery % hota hai. Expectations ko isi scale par rakho.
Educational context, not financial advice. 🧮
$BTC $ETH $SOL
#Altcoins #CryptoAnalysis #Drawdown
Numbers (aaj shaam ke prices):
1️⃣ BTC: ATH $126,198 → ~$75K: +68.3% chahiye
2️⃣ ETH: ATH $4,818 → ~$2,096: +129.8% chahiye
3️⃣ SOL: ATH $295 → ~$84.6: +248.8% chahiye
Pattern saaf: BTC se neeche jao to recovery ka safar lamba. High-beta assets zyada girte hain, wapas aane mein zyada waqt lagta hai.
Ye hope ka nahi, math ka chart hai: har price level ka apna recovery % hota hai. Expectations ko isi scale par rakho.
Educational context, not financial advice. 🧮
$BTC $ETH $SOL
#Altcoins #CryptoAnalysis #Drawdown

·
--
The SMR stock price dropped roughly 27% in three weeks during October, from above $7.60 to near $5.60. Three forces drove the sell-off.
Higher interest rates continued to punish pre-revenue growth stocks. NuScale carries a beta of 2.37, amplifying every broad market move. Analyst downgrades from UBS ($6 target, Sell), Barclays ($5, Underweight), and Citi ($4, Sell) accelerated selling. The ENTRA1 and TVA pipeline of up to 6 gigawatts remained non-binding, and the market stopped giving credit for potential.
The balance sheet provides a counterargument. Total liquidity near $1.9 billion gives NuScale four to five years of runway. The Doosan manufacturing contract moves the program into first-unit production. Q3 earnings on November 5 will test whether these are enough to stop the bleeding. Not a guarantee either way.
#SMR #NuScale #StockPrice #NuclearEnergy #Drawdown
The SMR stock price dropped roughly 27% in three weeks during October, from above $7.60 to near $5.60. Three forces drove the sell-off.
Higher interest rates continued to punish pre-revenue growth stocks. NuScale carries a beta of 2.37, amplifying every broad market move. Analyst downgrades from UBS ($6 target, Sell), Barclays ($5, Underweight), and Citi ($4, Sell) accelerated selling. The ENTRA1 and TVA pipeline of up to 6 gigawatts remained non-binding, and the market stopped giving credit for potential.
The balance sheet provides a counterargument. Total liquidity near $1.9 billion gives NuScale four to five years of runway. The Doosan manufacturing contract moves the program into first-unit production. Q3 earnings on November 5 will test whether these are enough to stop the bleeding. Not a guarantee either way.
#SMR #NuScale #StockPrice #NuclearEnergy #Drawdown
Higher interest rates continued to punish pre-revenue growth stocks. NuScale carries a beta of 2.37, amplifying every broad market move. Analyst downgrades from UBS ($6 target, Sell), Barclays ($5, Underweight), and Citi ($4, Sell) accelerated selling. The ENTRA1 and TVA pipeline of up to 6 gigawatts remained non-binding, and the market stopped giving credit for potential.
The balance sheet provides a counterargument. Total liquidity near $1.9 billion gives NuScale four to five years of runway. The Doosan manufacturing contract moves the program into first-unit production. Q3 earnings on November 5 will test whether these are enough to stop the bleeding. Not a guarantee either way.
#SMR #NuScale #StockPrice #NuclearEnergy #Drawdown
SMRUS-2,38%
105
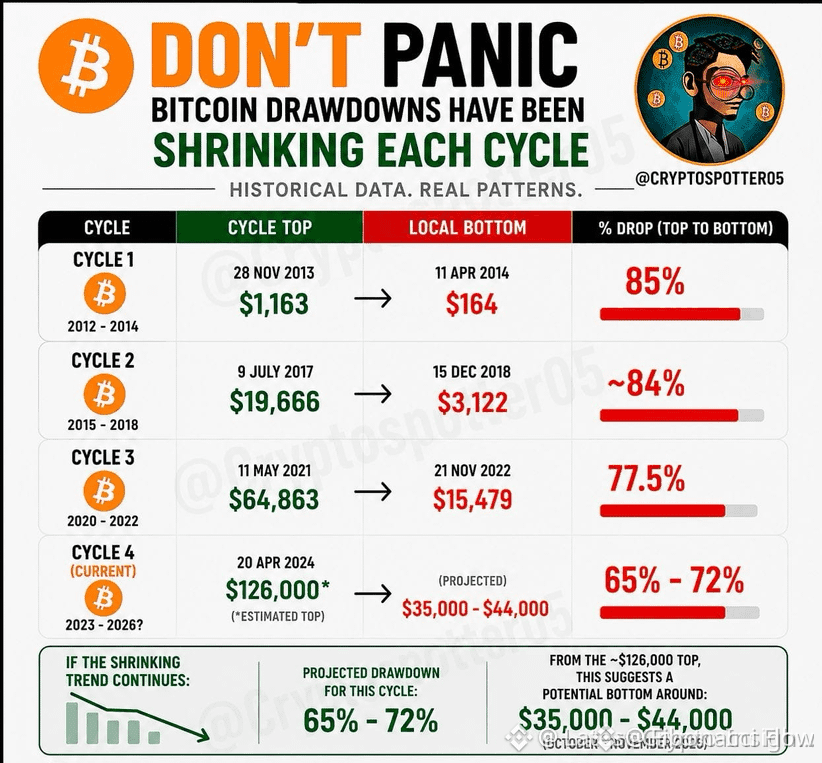
BITCOIN'S DRAWDOWNS SHRINK EVERY CYCLE — $126K TOP IN SIGHT? 🚀🐂
Each cycle's sell-off gets shallower — that's the signature of a maturing asset. 📊 The progression from 85% → 84% → 77.5% isn't coincidence; it's Bitcoin shaking out weak hands with less force every time. 💡 If history holds, the next floor sits between $35K and $44K, with a ceiling at $126K. That's a clean 3x from bottom to top — and a fraction of past volatility. 🛡️
The bigger the market, the softer the crashes. The data doesn't lie: this cycle is built different. 🔍 Where do you see the next bottom? Drop your number below 👇
⚠️ Not financial advice. Always manage your risk. 🛡️
🏷️ #BTC #Bitcoin #CycleAnalysis #Drawdown #Crypto
🐂 🌕
BITCOIN'S DRAWDOWNS SHRINK EVERY CYCLE — $126K TOP IN SIGHT? 🚀🐂
Each cycle's sell-off gets shallower — that's the signature of a maturing asset. 📊 The progression from 85% → 84% → 77.5% isn't coincidence; it's Bitcoin shaking out weak hands with less force every time. 💡 If history holds, the next floor sits between $35K and $44K, with a ceiling at $126K. That's a clean 3x from bottom to top — and a fraction of past volatility. 🛡️
The bigger the market, the softer the crashes. The data doesn't lie: this cycle is built different. 🔍 Where do you see the next bottom? Drop your number below 👇
⚠️ Not financial advice. Always manage your risk. 🛡️
🏷️ #BTC #Bitcoin #CycleAnalysis #Drawdown #Crypto
🐂 🌕
Each cycle's sell-off gets shallower — that's the signature of a maturing asset. 📊 The progression from 85% → 84% → 77.5% isn't coincidence; it's Bitcoin shaking out weak hands with less force every time. 💡 If history holds, the next floor sits between $35K and $44K, with a ceiling at $126K. That's a clean 3x from bottom to top — and a fraction of past volatility. 🛡️
The bigger the market, the softer the crashes. The data doesn't lie: this cycle is built different. 🔍 Where do you see the next bottom? Drop your number below 👇
⚠️ Not financial advice. Always manage your risk. 🛡️
🏷️ #BTC #Bitcoin #CycleAnalysis #Drawdown #Crypto
🐂 🌕
29
·
--
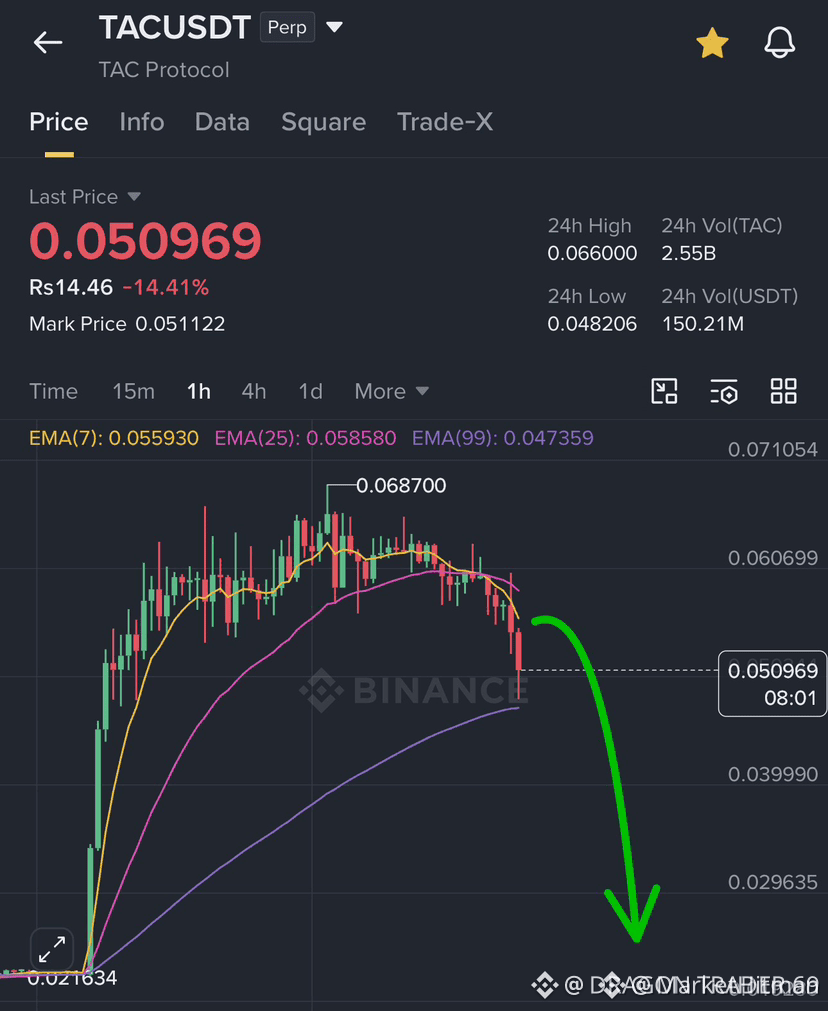
$TAC DROPPED 25% FROM ENTRY – NOW WHAT? ❓
A 25% decline from the initial entry level often shakes out weak hands and resets the order flow. Volume is declining on the lower timeframes which suggests selling pressure is exhausting.
The key question is whether this drop is a liquidity sweep below a major support or the start of a deeper correction. Are you scaling into this dip or waiting for a structural shift?
Not financial advice. Always manage your risk.
#TAC #Crypto #Trading #Drawdown #SupportZone
🎯
$TAC DROPPED 25% FROM ENTRY – NOW WHAT? ❓
A 25% decline from the initial entry level often shakes out weak hands and resets the order flow. Volume is declining on the lower timeframes which suggests selling pressure is exhausting.
The key question is whether this drop is a liquidity sweep below a major support or the start of a deeper correction. Are you scaling into this dip or waiting for a structural shift?
Not financial advice. Always manage your risk.
#TAC #Crypto #Trading #Drawdown #SupportZone
🎯
A 25% decline from the initial entry level often shakes out weak hands and resets the order flow. Volume is declining on the lower timeframes which suggests selling pressure is exhausting.
The key question is whether this drop is a liquidity sweep below a major support or the start of a deeper correction. Are you scaling into this dip or waiting for a structural shift?
Not financial advice. Always manage your risk.
#TAC #Crypto #Trading #Drawdown #SupportZone
🎯
104

·
--
Most traders size positions based on how much they want to make. Fewer size based on how much drawdown they can actually survive.
That asymmetry is where portfolios get destroyed.
Drawdown tolerance is not a soft preference — it is a hard constraint. If a 40% peak-to-trough drawdown on a position forces you to sell at the bottom, your position size was wrong from the start — regardless of whether the thesis was right.
A simple framework:
1. Define your max tolerable drawdown per position before entry, not after.
2. Back-calculate position size from historical volatility. High-beta altcoins can drop 60-70% in a correction faster than blue-chip crypto.
3. Separate conviction from capacity. High conviction does not give you a larger risk budget — it just means you hold longer.
4. Use trailing stops or rebalance bands to lock in gains mechanically, removing emotion from the exit.
The real edge in crypto is not finding the right asset. Plenty of people identified the right asset and still lost money by sizing poorly and panic-selling drawdowns.
Drawdown management is how you stay in the game long enough to be right.
$BTC $AVAX $DOT
#RiskManagement #CryptoTrading #PositionSizing #Drawdown #BinanceSquare
Most traders size positions based on how much they want to make. Fewer size based on how much drawdown they can actually survive.
That asymmetry is where portfolios get destroyed.
Drawdown tolerance is not a soft preference — it is a hard constraint. If a 40% peak-to-trough drawdown on a position forces you to sell at the bottom, your position size was wrong from the start — regardless of whether the thesis was right.
A simple framework:
1. Define your max tolerable drawdown per position before entry, not after.
2. Back-calculate position size from historical volatility. High-beta altcoins can drop 60-70% in a correction faster than blue-chip crypto.
3. Separate conviction from capacity. High conviction does not give you a larger risk budget — it just means you hold longer.
4. Use trailing stops or rebalance bands to lock in gains mechanically, removing emotion from the exit.
The real edge in crypto is not finding the right asset. Plenty of people identified the right asset and still lost money by sizing poorly and panic-selling drawdowns.
Drawdown management is how you stay in the game long enough to be right.
$BTC $AVAX $DOT
#RiskManagement #CryptoTrading #PositionSizing #Drawdown #BinanceSquare
That asymmetry is where portfolios get destroyed.
Drawdown tolerance is not a soft preference — it is a hard constraint. If a 40% peak-to-trough drawdown on a position forces you to sell at the bottom, your position size was wrong from the start — regardless of whether the thesis was right.
A simple framework:
1. Define your max tolerable drawdown per position before entry, not after.
2. Back-calculate position size from historical volatility. High-beta altcoins can drop 60-70% in a correction faster than blue-chip crypto.
3. Separate conviction from capacity. High conviction does not give you a larger risk budget — it just means you hold longer.
4. Use trailing stops or rebalance bands to lock in gains mechanically, removing emotion from the exit.
The real edge in crypto is not finding the right asset. Plenty of people identified the right asset and still lost money by sizing poorly and panic-selling drawdowns.
Drawdown management is how you stay in the game long enough to be right.
$BTC $AVAX $DOT
#RiskManagement #CryptoTrading #PositionSizing #Drawdown #BinanceSquare
91

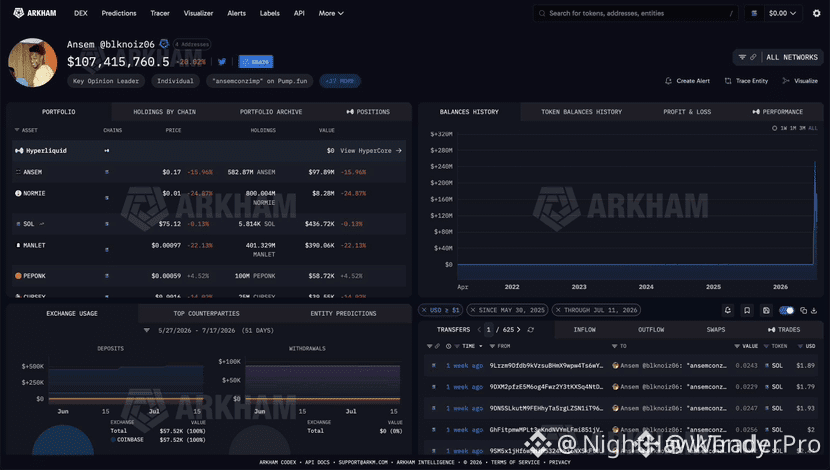
OVER $160M ERASED FROM ANSEM'S $ANSEM HOLDINGS IN TWO WEEKS 💸
That's a 60% drawdown from the peak — $260M down to $97.9M. On-chain data shows the KOL hasn't sold a single token through the drop. He's still betting on the Creator Economy thesis despite losing nine figures.
The question is whether this is conviction or stubbornness. The market doesn't care about your thesis if liquidity dries up. Would you hold through a 60% drawdown on a high conviction play?
Not financial advice. Always manage your risk.
#ANSEM #KOL #Drawdown #Crypto #Holding
💸
OVER $160M ERASED FROM ANSEM'S $ANSEM HOLDINGS IN TWO WEEKS 💸
That's a 60% drawdown from the peak — $260M down to $97.9M. On-chain data shows the KOL hasn't sold a single token through the drop. He's still betting on the Creator Economy thesis despite losing nine figures.
The question is whether this is conviction or stubbornness. The market doesn't care about your thesis if liquidity dries up. Would you hold through a 60% drawdown on a high conviction play?
Not financial advice. Always manage your risk.
#ANSEM #KOL #Drawdown #Crypto #Holding
💸
That's a 60% drawdown from the peak — $260M down to $97.9M. On-chain data shows the KOL hasn't sold a single token through the drop. He's still betting on the Creator Economy thesis despite losing nine figures.
The question is whether this is conviction or stubbornness. The market doesn't care about your thesis if liquidity dries up. Would you hold through a 60% drawdown on a high conviction play?
Not financial advice. Always manage your risk.
#ANSEM #KOL #Drawdown #Crypto #Holding
💸
74

·
--
🐻 IS $BTC HEADING TOWARD ITS SHALLOWEST BEAR CORRECTION EVER? 🔍
The historical script is brutally consistent: -92%, -82.5%, -83%, -75.5%. Now we sit at -52.5% — a drawdown that would rewrite the entire bear-market playbook if it holds. 📉 On one side, seller exhaustion suggests the forced liquidation wave has largely passed. 🦈 On the other, spot demand remains too anemic to confirm a durable floor.
This is not a bottom until volume-backed accumulation says so. 📊 Shallow corrections without recovery momentum leave the door open for one more liquidity sweep into the lows. But if buyers absorb this fading supply, we may be watching a historically compressed cycle form in real time.
💬 Do you think -52.5% marks the worst of it — or is another leg down still lurking below the surface?
⚠️ Not financial advice. Always manage your risk. 🛡️
🏷️ #BTC #Bitcoin #BearMarket #Drawdown #Crypto
🔍 📊
🐻 IS $BTC HEADING TOWARD ITS SHALLOWEST BEAR CORRECTION EVER? 🔍
The historical script is brutally consistent: -92%, -82.5%, -83%, -75.5%. Now we sit at -52.5% — a drawdown that would rewrite the entire bear-market playbook if it holds. 📉 On one side, seller exhaustion suggests the forced liquidation wave has largely passed. 🦈 On the other, spot demand remains too anemic to confirm a durable floor.
This is not a bottom until volume-backed accumulation says so. 📊 Shallow corrections without recovery momentum leave the door open for one more liquidity sweep into the lows. But if buyers absorb this fading supply, we may be watching a historically compressed cycle form in real time.
💬 Do you think -52.5% marks the worst of it — or is another leg down still lurking below the surface?
⚠️ Not financial advice. Always manage your risk. 🛡️
🏷️ #BTC #Bitcoin #BearMarket #Drawdown #Crypto
🔍 📊
The historical script is brutally consistent: -92%, -82.5%, -83%, -75.5%. Now we sit at -52.5% — a drawdown that would rewrite the entire bear-market playbook if it holds. 📉 On one side, seller exhaustion suggests the forced liquidation wave has largely passed. 🦈 On the other, spot demand remains too anemic to confirm a durable floor.
This is not a bottom until volume-backed accumulation says so. 📊 Shallow corrections without recovery momentum leave the door open for one more liquidity sweep into the lows. But if buyers absorb this fading supply, we may be watching a historically compressed cycle form in real time.
💬 Do you think -52.5% marks the worst of it — or is another leg down still lurking below the surface?
⚠️ Not financial advice. Always manage your risk. 🛡️
🏷️ #BTC #Bitcoin #BearMarket #Drawdown #Crypto
🔍 📊
19
Войдите, чтобы посмотреть больше материала
Присоединяйтесь к пользователям криптовалют по всему миру на Binance Square
⚡️ Получайте новейшую и полезную информацию о криптоактивах.
💬 Нам доверяет крупнейшая в мире криптобиржа.
👍 Получите достоверные аналитические данные от верифицированных создателей контента.
Эл. почта/номер телефона
В тренде
1
#GlobalStocksFaceLongestLosingStreakSince2023
Просмотров: 0
25 обсуждают
2
#BTCBelow$62KAmidHikeFearsAndShiftToAnthropic
Просмотров: 20,381
146 обсуждают
3
#GaoTengBitcoinETFListsOnHKEX
Просмотров: 0
89 обсуждают
4
#TradFiForBeginners
Просмотров: 946,825
5,209 обсуждают
5
#NvidiaBoardReportedlySplitOverHuang’sReturn
Просмотров: 258,674
2,206 обсуждают
6
#CanGTA6'sLaunchLiftTTWOShares?
Просмотров: 207,868
1,599 обсуждают
7
#HongKongProposesSFCLicensingForFourVirtualAssetServices
Просмотров: 404
25 обсуждают
8
#BlackRockBitcoinETFRecordsLargestDailyOutflow
Просмотров: 17,904
296 обсуждают
9
#LedgerProbesTamperedWalletsInBerlinAndDubai
Просмотров: 26,327
407 обсуждают
10
#13FInstitutionsBitcoinSpotETPHoldingsHitRecord
Просмотров: 42,516
451 обсуждают