
#bitcoindropsbelow$71k
bitcoindropsbelow$71k
Просмотров: 23,156
119 обсуждают
Популярные
Новые

·
--
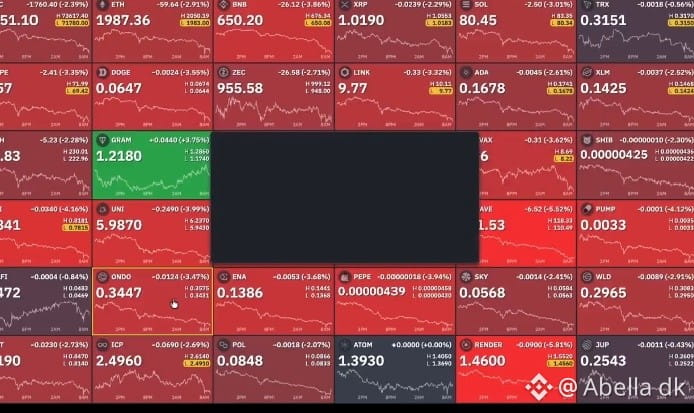
🚨 THE CRYPTO MARKET IS IN PANIC MODE! 🩸
This is not just a normal correction. Multiple forces are hitting the market simultaneously.
Here's what's happening:
📉 1. HOTTER US INFLATION October's US inflation data came in above expectations, increasing fears that the Federal Reserve could raise interest rates in December. Higher rates put pressure on risky assets like Bitcoin and Ethereum.
💸 2. BILLIONS LEAVING BITCOIN ETFs Institutional investors are pulling money out of spot Bitcoin ETFs. This is weakening one of the major sources of buying demand.
🐋 3. LEVERAGED TRADERS GETTING DESTROYED As BTC falls, leveraged long positions get liquidated. Those forced liquidations create additional selling pressure, pushing prices even lower.
⚠️ 4. FEAR IS SPREADING Regulatory uncertainty, geopolitical tensions and the Binance hack fallout are adding to investor anxiety.
🔥 WHAT HAPPENS NEXT?
BTC: $71K–$72K is a critical support zone.
BTC: Losing $70K could open the door to further downside.
#MSCIRemovalMayCurbStrategy’sBitcoinBuying
ETH: $2,000 is a major psychological level.
#AnthropicRejectsIPODelayValuationinQuestion
The latest reports confirm that approximately $220 million in leveraged long positions were liquidated within just one hour.
MY TAKE: Don't blindly buy the dip. Don't panic-sell either. Watch ETF flows, liquidation data and whether buyers defend key support levels.
THE BIG QUESTION: IS THIS THE START OF A DEEPER BEAR MARKET OR THE BIGGEST BUYING OPPORTUNITY OF 2026? 🧐
$BTC $ETH $BNB
🚨 THE CRYPTO MARKET IS IN PANIC MODE! 🩸
This is not just a normal correction. Multiple forces are hitting the market simultaneously.
Here's what's happening:
📉 1. HOTTER US INFLATION October's US inflation data came in above expectations, increasing fears that the Federal Reserve could raise interest rates in December. Higher rates put pressure on risky assets like Bitcoin and Ethereum.
💸 2. BILLIONS LEAVING BITCOIN ETFs Institutional investors are pulling money out of spot Bitcoin ETFs. This is weakening one of the major sources of buying demand.
🐋 3. LEVERAGED TRADERS GETTING DESTROYED As BTC falls, leveraged long positions get liquidated. Those forced liquidations create additional selling pressure, pushing prices even lower.
⚠️ 4. FEAR IS SPREADING Regulatory uncertainty, geopolitical tensions and the Binance hack fallout are adding to investor anxiety.
🔥 WHAT HAPPENS NEXT?
BTC: $71K–$72K is a critical support zone.
BTC: Losing $70K could open the door to further downside.
#MSCIRemovalMayCurbStrategy’sBitcoinBuying
ETH: $2,000 is a major psychological level.
#AnthropicRejectsIPODelayValuationinQuestion
The latest reports confirm that approximately $220 million in leveraged long positions were liquidated within just one hour.
MY TAKE: Don't blindly buy the dip. Don't panic-sell either. Watch ETF flows, liquidation data and whether buyers defend key support levels.
THE BIG QUESTION: IS THIS THE START OF A DEEPER BEAR MARKET OR THE BIGGEST BUYING OPPORTUNITY OF 2026? 🧐
$BTC $ETH $BNB
This is not just a normal correction. Multiple forces are hitting the market simultaneously.
Here's what's happening:
📉 1. HOTTER US INFLATION October's US inflation data came in above expectations, increasing fears that the Federal Reserve could raise interest rates in December. Higher rates put pressure on risky assets like Bitcoin and Ethereum.
💸 2. BILLIONS LEAVING BITCOIN ETFs Institutional investors are pulling money out of spot Bitcoin ETFs. This is weakening one of the major sources of buying demand.
🐋 3. LEVERAGED TRADERS GETTING DESTROYED As BTC falls, leveraged long positions get liquidated. Those forced liquidations create additional selling pressure, pushing prices even lower.
⚠️ 4. FEAR IS SPREADING Regulatory uncertainty, geopolitical tensions and the Binance hack fallout are adding to investor anxiety.
🔥 WHAT HAPPENS NEXT?
BTC: $71K–$72K is a critical support zone.
BTC: Losing $70K could open the door to further downside.
#MSCIRemovalMayCurbStrategy’sBitcoinBuying
ETH: $2,000 is a major psychological level.
#AnthropicRejectsIPODelayValuationinQuestion
The latest reports confirm that approximately $220 million in leveraged long positions were liquidated within just one hour.
MY TAKE: Don't blindly buy the dip. Don't panic-sell either. Watch ETF flows, liquidation data and whether buyers defend key support levels.
THE BIG QUESTION: IS THIS THE START OF A DEEPER BEAR MARKET OR THE BIGGEST BUYING OPPORTUNITY OF 2026? 🧐
$BTC $ETH $BNB
bapidas Gomes uBE8:
Nice meet you
19
8
5.4k


Guys, I was warning you not to buy $BTC when it was trading at $87K and $85K.
I clearly told you that it was just a trap, not a real move or the beginning of a rally.
90% of the comments were against me. People were laughing at me, saying that I had missed the bottom.
Even when BTC dropped to $83K, I was still warning you: DON’T BUY!
But nobody wanted to listen.
Those who bought at $85K might already have been liquidated by now.
And look where you $BTC is today — around $71K!
My buying levels are still below $60K.
I also believe a major move could be coming within the next 10–15 days.
Follow me and turn on notifications so you never miss my important market updates.
{spot}(BTCUSDT)
Guys, I was warning you not to buy $BTC when it was trading at $87K and $85K.
I clearly told you that it was just a trap, not a real move or the beginning of a rally.
90% of the comments were against me. People were laughing at me, saying that I had missed the bottom.
Even when BTC dropped to $83K, I was still warning you: DON’T BUY!
But nobody wanted to listen.
Those who bought at $85K might already have been liquidated by now.
And look where you $BTC is today — around $71K!
My buying levels are still below $60K.
I also believe a major move could be coming within the next 10–15 days.
Follow me and turn on notifications so you never miss my important market updates.
I clearly told you that it was just a trap, not a real move or the beginning of a rally.
90% of the comments were against me. People were laughing at me, saying that I had missed the bottom.
Even when BTC dropped to $83K, I was still warning you: DON’T BUY!
But nobody wanted to listen.
Those who bought at $85K might already have been liquidated by now.
And look where you $BTC is today — around $71K!
My buying levels are still below $60K.
I also believe a major move could be coming within the next 10–15 days.
Follow me and turn on notifications so you never miss my important market updates.
Kym Underland r2tK:
50k? 😮
8
10
5.8k

·
--
Падение
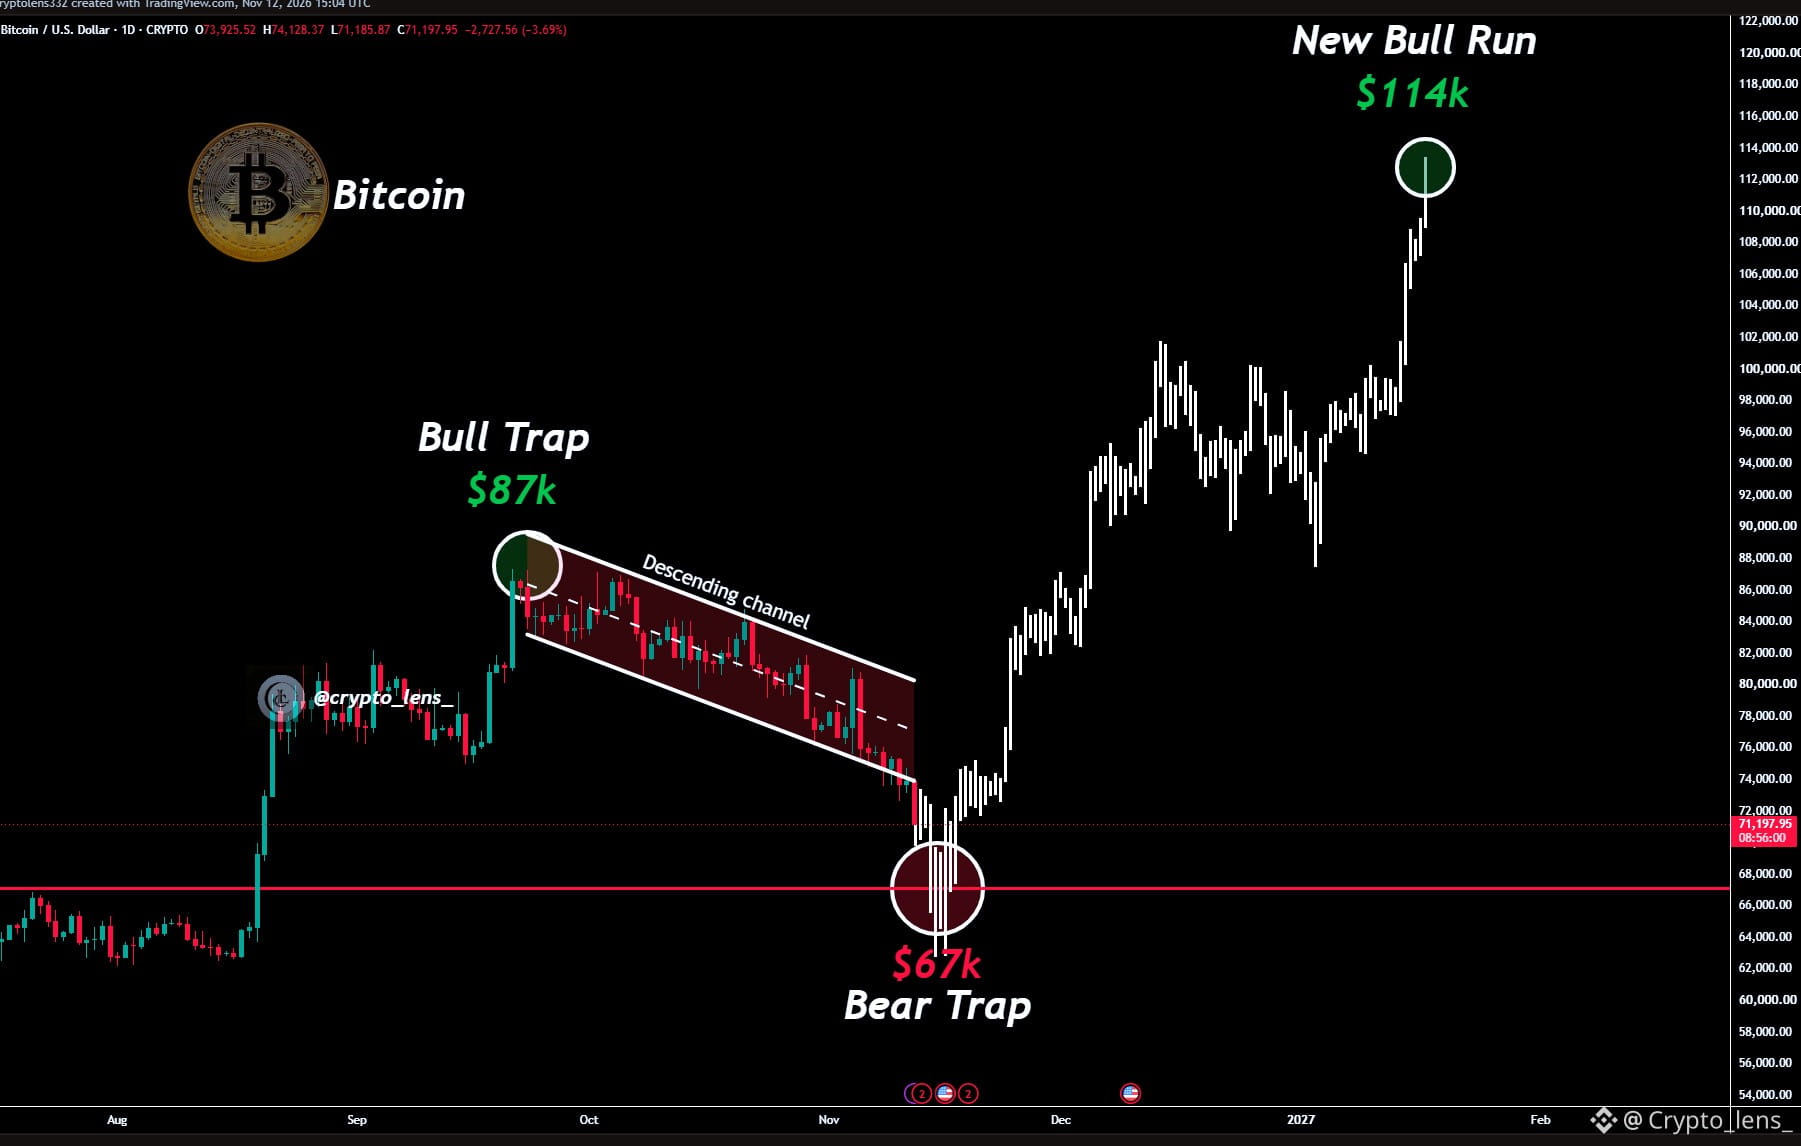
🚨 BITCOIN HAS OFFICIALLY ENTERED A BEAR TRAP
Two days ago, I warned you that Bitcoin's dump below $75K was confirmed and that it would crash to $71K.
Everything is playing out exactly as I predicted.
The next move is clear:
$71K → $67K (Bear Trap) → $100K → $114K
Don't get trapped.
Follow me and turn on notifications. Don’t be late.
Whatever update comes next, I’ll post it here first.
$BTC
🚨 BITCOIN HAS OFFICIALLY ENTERED A BEAR TRAP
Two days ago, I warned you that Bitcoin's dump below $75K was confirmed and that it would crash to $71K.
Everything is playing out exactly as I predicted.
The next move is clear:
$71K → $67K (Bear Trap) → $100K → $114K
Don't get trapped.
Follow me and turn on notifications. Don’t be late.
Whatever update comes next, I’ll post it here first.
$BTC
Two days ago, I warned you that Bitcoin's dump below $75K was confirmed and that it would crash to $71K.
Everything is playing out exactly as I predicted.
The next move is clear:
$71K → $67K (Bear Trap) → $100K → $114K
Don't get trapped.
Follow me and turn on notifications. Don’t be late.
Whatever update comes next, I’ll post it here first.
$BTC
Edna Rossa piqh:
bagaimana kira2 prediksi Masi turun ke 65k ?
24
2
102
67.4k

🚨 البيتكوين دخل رسميًا في فخ هبوطي! 🐻🔥
قبل يومين، حذّرتكم من أن هبوط البيتكوين دون مستوى $75K أصبح مؤكدًا، وأن الهدف الهبوطي التالي سيكون عند $71K.
والآن، تتحرك الأمور وفقًا للتوقعات! 🎯
إليكم المسار المحتمل القادم:
$71K → $67K (فخ هبوطي) → $100K → $114K 🚀
لا تقعوا في فخ السوق! ⚠️
تابعوني وفعّلوا الإشعارات 🔔 لتكونوا على اطلاع بكل التحركات المهمة.
أي تحديث جديد سيصلكم هنا أولًا!
$BTC
🚨 البيتكوين دخل رسميًا في فخ هبوطي! 🐻🔥
قبل يومين، حذّرتكم من أن هبوط البيتكوين دون مستوى $75K أصبح مؤكدًا، وأن الهدف الهبوطي التالي سيكون عند $71K.
والآن، تتحرك الأمور وفقًا للتوقعات! 🎯
إليكم المسار المحتمل القادم:
$71K → $67K (فخ هبوطي) → $100K → $114K 🚀
لا تقعوا في فخ السوق! ⚠️
تابعوني وفعّلوا الإشعارات 🔔 لتكونوا على اطلاع بكل التحركات المهمة.
أي تحديث جديد سيصلكم هنا أولًا!
$BTC
قبل يومين، حذّرتكم من أن هبوط البيتكوين دون مستوى $75K أصبح مؤكدًا، وأن الهدف الهبوطي التالي سيكون عند $71K.
والآن، تتحرك الأمور وفقًا للتوقعات! 🎯
إليكم المسار المحتمل القادم:
$71K → $67K (فخ هبوطي) → $100K → $114K 🚀
لا تقعوا في فخ السوق! ⚠️
تابعوني وفعّلوا الإشعارات 🔔 لتكونوا على اطلاع بكل التحركات المهمة.
أي تحديث جديد سيصلكم هنا أولًا!
$BTC
3.2k

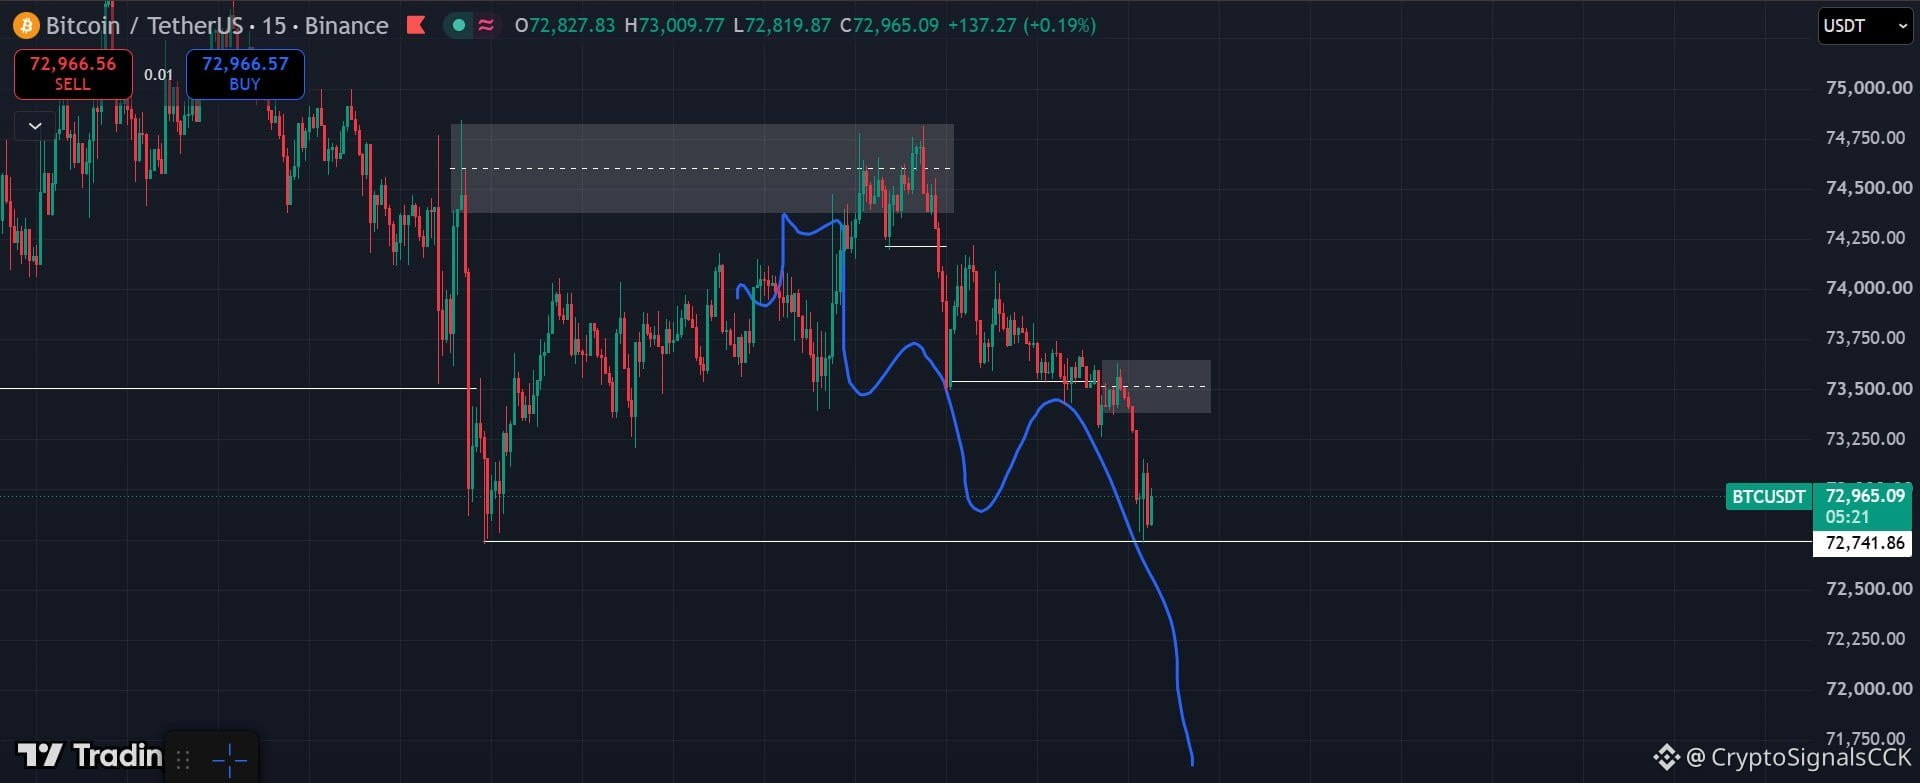
$BTC bears still in control - fresh lows below 72.7K are coming. 🥶👇
Tapped the 74.5k LTF supply, retested it, and got rejected again as mapped.
If bitcoin bounces slightly instead of dumping straight under 72.7k, the BTCUSDT 73.5k mini supply is the retest zone before the move to 71k zone.
#BTCUSDTAnalysis #btcupdates #CryptoSignalsCCK
$BTC bears still in control - fresh lows below 72.7K are coming. 🥶👇
Tapped the 74.5k LTF supply, retested it, and got rejected again as mapped.
If bitcoin bounces slightly instead of dumping straight under 72.7k, the BTCUSDT 73.5k mini supply is the retest zone before the move to 71k zone.
#BTCUSDTAnalysis #btcupdates #CryptoSignalsCCK
Tapped the 74.5k LTF supply, retested it, and got rejected again as mapped.
If bitcoin bounces slightly instead of dumping straight under 72.7k, the BTCUSDT 73.5k mini supply is the retest zone before the move to 71k zone.
#BTCUSDTAnalysis #btcupdates #CryptoSignalsCCK
1
2
978

·
--
Рост
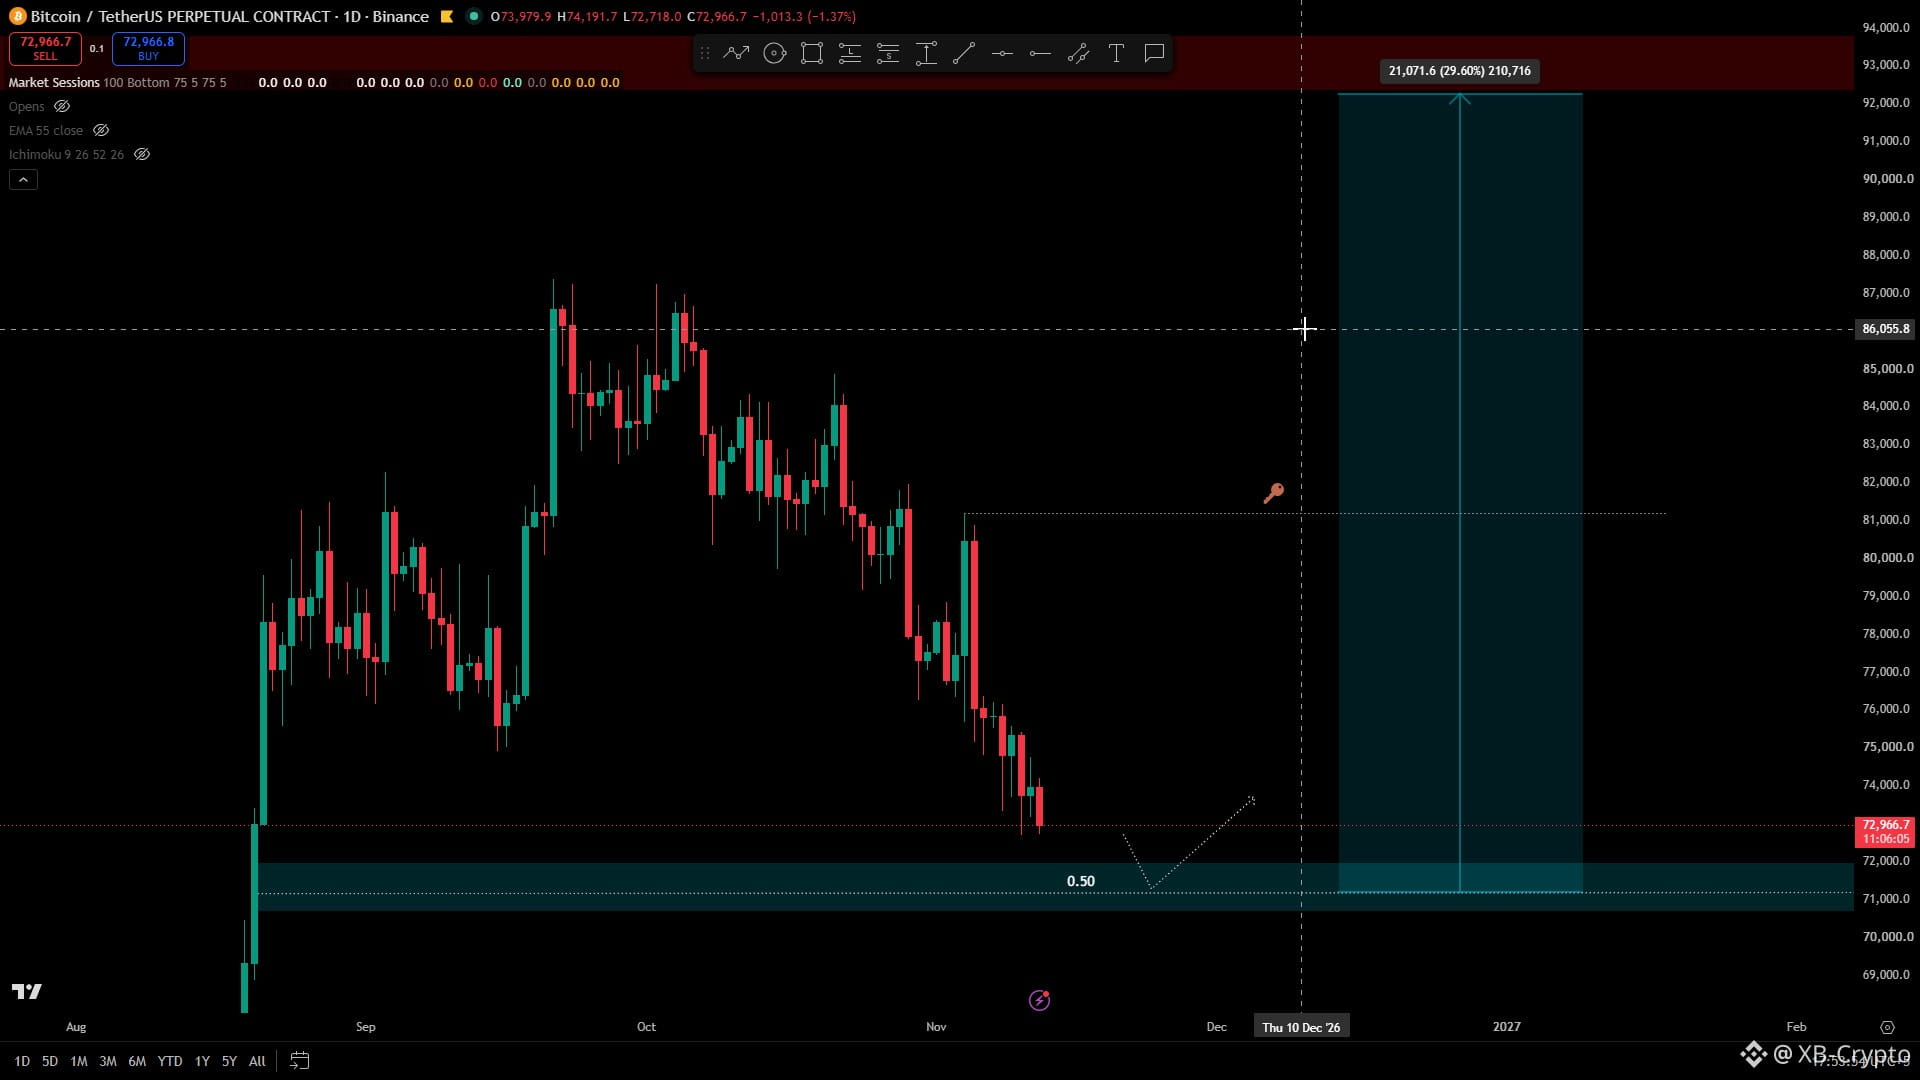
$BTC is approaching a key higher timeframe key zone around $71K–$72K, where I see a strong possibility of a bullish reversal.
For now, I'm primarily interested in long opportunities within the highlighted region, but I'm not blindly bullish.
If this zone fails to hold and $BTC forms a bearish FVG, the same region could flip into resistance, opening the door for further downside.
I am prepared for both scenarios. The idea is simple: trade the reaction, not the expectation.
Always have a plan, respect your invalidation levels, and manage your risk properly.
#BTC #bitcoin
$BTC is approaching a key higher timeframe key zone around $71K–$72K, where I see a strong possibility of a bullish reversal.
For now, I'm primarily interested in long opportunities within the highlighted region, but I'm not blindly bullish.
If this zone fails to hold and $BTC forms a bearish FVG, the same region could flip into resistance, opening the door for further downside.
I am prepared for both scenarios. The idea is simple: trade the reaction, not the expectation.
Always have a plan, respect your invalidation levels, and manage your risk properly.
#BTC #bitcoin
For now, I'm primarily interested in long opportunities within the highlighted region, but I'm not blindly bullish.
If this zone fails to hold and $BTC forms a bearish FVG, the same region could flip into resistance, opening the door for further downside.
I am prepared for both scenarios. The idea is simple: trade the reaction, not the expectation.
Always have a plan, respect your invalidation levels, and manage your risk properly.
#BTC #bitcoin
Trader M08:
Price is already inside your 71K to 72K zone. On Binance spot BTC lost Tuesday's 72,727 low today and printed 71,500, the lowest low of the last ten days. A daily close back above 72,727 is the reaction I would want to see before calling it a hold.
1
1
885

·
--
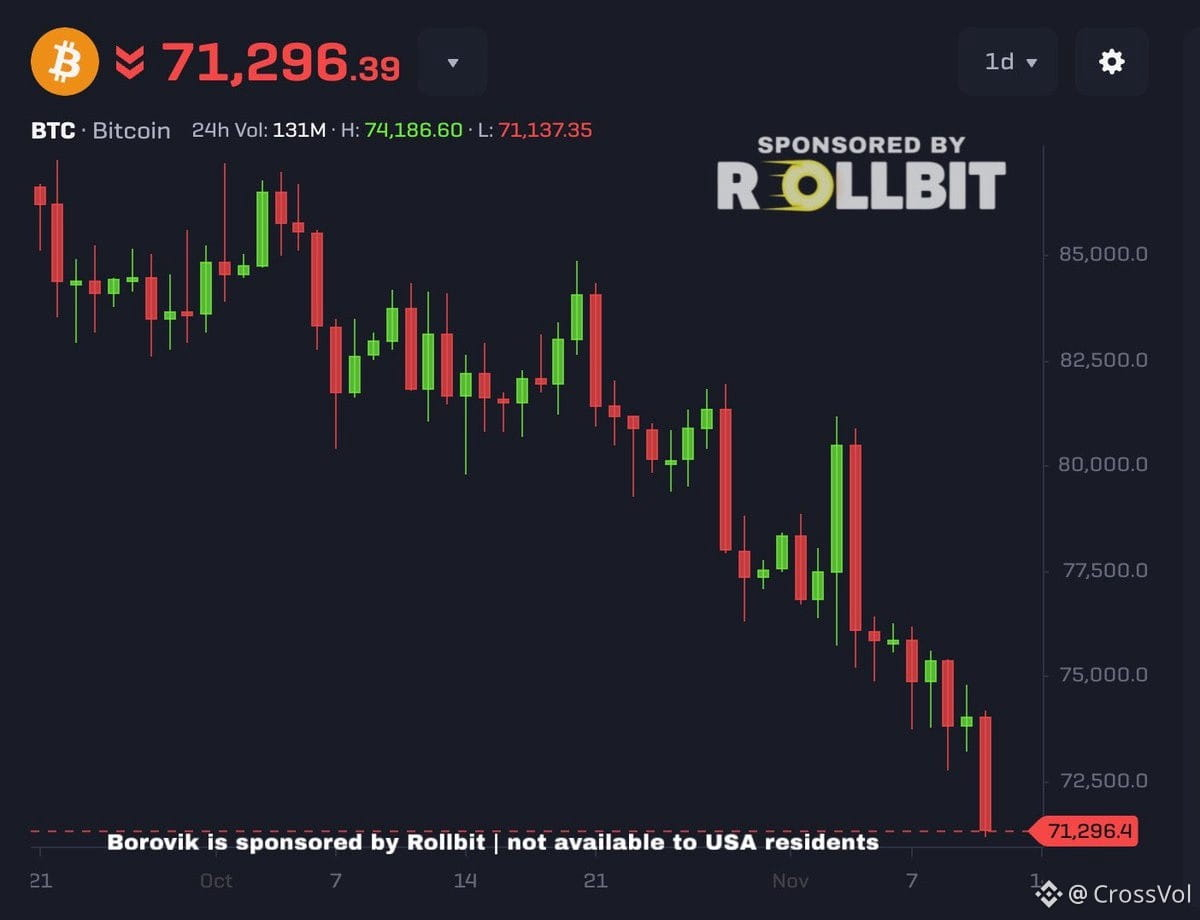
$BTC sitting at $71k — 12% off the post-election high. Clean pullback, nothing broken yet. This is accumulation range if you're thinking 2027–2030 cycle. Watch $69k–$70k for support hold. If we lose that, $65k is the real test. Short-term noise, long-term setup. Still wildly bullish into next halving cycle — these dips are the entry windows people regret missing later.
$BTC sitting at $71k — 12% off the post-election high. Clean pullback, nothing broken yet. This is accumulation range if you're thinking 2027–2030 cycle. Watch $69k–$70k for support hold. If we lose that, $65k is the real test. Short-term noise, long-term setup. Still wildly bullish into next halving cycle — these dips are the entry windows people regret missing later.
146

BTC vs ETH comparison$BTC vs $ETH - Today, 13 Nov 2026 - CRASH DAY
### Comparison Graph - Clear
Left: Both crashing, but $ETH falling 2x faster than $BTC since 9 Nov
Right: $ETH losing in every timeframe - YTD -40.88% vs $BTC -17.96%
### Latest Prices Today
**$BTC** $ETH
**Price** **$69,305 - $71,314** $2,005 - $2,017
**24h** **-6.06%** -2.35% to -3.16%
7 Days -5.8% -10.33%
30 Days -14.47% -19.75%
YTD -17.96% -40.88%
1 Year -29.91% -41.05%
Market Cap $1.43T $243.4B
**Fear & Greed** 20 - Extreme Fear Same market
### Today's News - Why Both Crashed
1. Nvidia CEO Resignation - Main Trigger
Nvidia CEO Jensen Huang resigned after affair allegations. Nvidia stock -5.8% to $163.60. AI stocks crash spilled into crypto. Global crypto cap fell 5.7% in 24h. $719.9M liquidations, $642M longs wiped.
2. $BTC - Broke 200-Day MA, Lowest in 86 Days
- $BTC fell to $68,943 low, lowest since late Aug
- Open $73,780, High $73,884, Low $68,943, Close ∼$69,305 - -6.06% in one day
- Broke below $71,100, $73,000 support failed. Now testing $69,550 bid wall and $70,500 support. Next support $68,900
- Funding: +0.0099% per 8h, OI $2.97B. Heat Score 7 - COLD, down -4 vs yesterday
3. $ETH - Broke $2,000 For First Time Since Aug 19
- $ETH touched $1,982 - $1,983 low on Thu 12 Nov at 14:29 UTC, closed $2,017, now $2,005
- Below 200-day MA of $2,149. Below all EMAs $2,220-$2,335
- Support: $1,971 / $1,877 / $1,800. Resistance: $2,090 / $2,125 / $2,240
- RSI 29.4 - Oversold, but still falling
4. ETF Outflows - Both Bleeding
- $BTC ETF: Outflows continue, 4th+ straight session
- $ETH ETF: 5th straight day of outflows, Nov 11 alone -$145M, Oct total -$1.61B, Last 7 weeks -$2.35B
5. $ETH Positive - Staking Record
Despite crash, $ETH staking hit record 36.3% of supply. 44.5M $ETH staked (up from 42.1M in Aug). 911,938 $ETH waiting to stake, only 264k waiting to exit. Vitalik pushing $ETH as store of value.
### Verdict: Who Is Stronger?
$BTC is winning the bear market.
- $BTC down only -8% from 9 Nov, $ETH down -17%
- $BTC YTD -18% vs $ETH -41%
- Investors fleeing to $BTC as safer crypto, selling $ETH faster
$ETH is oversold but weaker. If $BTC holds $69,500, $ETH may bounce from $2,000. If $BTC breaks $68,900, $ETH could fall to $1,877 fast.
#AnthropicRejectsIPODelayValuationinQuestion #BitcoinDropsBelow$71K #ChipStocksExtendLossesAfterNvidiaCEOChange #BitMineReports$6.3BNetLossForFiscal2026 #NvidiaNamesColetteKressInterimCEO
BTC vs ETH comparison
$BTC vs $ETH - Today, 13 Nov 2026 - CRASH DAY
### Comparison Graph - Clear
Left: Both crashing, but $ETH falling 2x faster than $BTC since 9 Nov
Right: $ETH losing in every timeframe - YTD -40.88% vs $BTC -17.96%
### Latest Prices Today
**$BTC** $ETH
**Price** **$69,305 - $71,314** $2,005 - $2,017
**24h** **-6.06%** -2.35% to -3.16%
7 Days -5.8% -10.33%
30 Days -14.47% -19.75%
YTD -17.96% -40.88%
1 Year -29.91% -41.05%
Market Cap $1.43T $243.4B
**Fear & Greed** 20 - Extreme Fear Same market
### Today's News - Why Both Crashed
1. Nvidia CEO Resignation - Main Trigger
Nvidia CEO Jensen Huang resigned after affair allegations. Nvidia stock -5.8% to $163.60. AI stocks crash spilled into crypto. Global crypto cap fell 5.7% in 24h. $719.9M liquidations, $642M longs wiped.
2. $BTC - Broke 200-Day MA, Lowest in 86 Days
- $BTC fell to $68,943 low, lowest since late Aug
- Open $73,780, High $73,884, Low $68,943, Close ∼$69,305 - -6.06% in one day
- Broke below $71,100, $73,000 support failed. Now testing $69,550 bid wall and $70,500 support. Next support $68,900
- Funding: +0.0099% per 8h, OI $2.97B. Heat Score 7 - COLD, down -4 vs yesterday
3. $ETH - Broke $2,000 For First Time Since Aug 19
- $ETH touched $1,982 - $1,983 low on Thu 12 Nov at 14:29 UTC, closed $2,017, now $2,005
- Below 200-day MA of $2,149. Below all EMAs $2,220-$2,335
- Support: $1,971 / $1,877 / $1,800. Resistance: $2,090 / $2,125 / $2,240
- RSI 29.4 - Oversold, but still falling
4. ETF Outflows - Both Bleeding
- $BTC ETF: Outflows continue, 4th+ straight session
- $ETH ETF: 5th straight day of outflows, Nov 11 alone -$145M, Oct total -$1.61B, Last 7 weeks -$2.35B
5. $ETH Positive - Staking Record
Despite crash, $ETH staking hit record 36.3% of supply. 44.5M $ETH staked (up from 42.1M in Aug). 911,938 $ETH waiting to stake, only 264k waiting to exit. Vitalik pushing $ETH as store of value.
### Verdict: Who Is Stronger?
$BTC is winning the bear market.
- $BTC down only -8% from 9 Nov, $ETH down -17%
- $BTC YTD -18% vs $ETH -41%
- Investors fleeing to $BTC as safer crypto, selling $ETH faster
$ETH is oversold but weaker. If $BTC holds $69,500, $ETH may bounce from $2,000. If $BTC breaks $68,900, $ETH could fall to $1,877 fast.
#AnthropicRejectsIPODelayValuationinQuestion #BitcoinDropsBelow$71K #ChipStocksExtendLossesAfterNvidiaCEOChange #BitMineReports$6.3BNetLossForFiscal2026 #NvidiaNamesColetteKressInterimCEO
### Comparison Graph - Clear
Left: Both crashing, but $ETH falling 2x faster than $BTC since 9 Nov
Right: $ETH losing in every timeframe - YTD -40.88% vs $BTC -17.96%
### Latest Prices Today
**$BTC** $ETH
**Price** **$69,305 - $71,314** $2,005 - $2,017
**24h** **-6.06%** -2.35% to -3.16%
7 Days -5.8% -10.33%
30 Days -14.47% -19.75%
YTD -17.96% -40.88%
1 Year -29.91% -41.05%
Market Cap $1.43T $243.4B
**Fear & Greed** 20 - Extreme Fear Same market
### Today's News - Why Both Crashed
1. Nvidia CEO Resignation - Main Trigger
Nvidia CEO Jensen Huang resigned after affair allegations. Nvidia stock -5.8% to $163.60. AI stocks crash spilled into crypto. Global crypto cap fell 5.7% in 24h. $719.9M liquidations, $642M longs wiped.
2. $BTC - Broke 200-Day MA, Lowest in 86 Days
- $BTC fell to $68,943 low, lowest since late Aug
- Open $73,780, High $73,884, Low $68,943, Close ∼$69,305 - -6.06% in one day
- Broke below $71,100, $73,000 support failed. Now testing $69,550 bid wall and $70,500 support. Next support $68,900
- Funding: +0.0099% per 8h, OI $2.97B. Heat Score 7 - COLD, down -4 vs yesterday
3. $ETH - Broke $2,000 For First Time Since Aug 19
- $ETH touched $1,982 - $1,983 low on Thu 12 Nov at 14:29 UTC, closed $2,017, now $2,005
- Below 200-day MA of $2,149. Below all EMAs $2,220-$2,335
- Support: $1,971 / $1,877 / $1,800. Resistance: $2,090 / $2,125 / $2,240
- RSI 29.4 - Oversold, but still falling
4. ETF Outflows - Both Bleeding
- $BTC ETF: Outflows continue, 4th+ straight session
- $ETH ETF: 5th straight day of outflows, Nov 11 alone -$145M, Oct total -$1.61B, Last 7 weeks -$2.35B
5. $ETH Positive - Staking Record
Despite crash, $ETH staking hit record 36.3% of supply. 44.5M $ETH staked (up from 42.1M in Aug). 911,938 $ETH waiting to stake, only 264k waiting to exit. Vitalik pushing $ETH as store of value.
### Verdict: Who Is Stronger?
$BTC is winning the bear market.
- $BTC down only -8% from 9 Nov, $ETH down -17%
- $BTC YTD -18% vs $ETH -41%
- Investors fleeing to $BTC as safer crypto, selling $ETH faster
$ETH is oversold but weaker. If $BTC holds $69,500, $ETH may bounce from $2,000. If $BTC breaks $68,900, $ETH could fall to $1,877 fast.
#AnthropicRejectsIPODelayValuationinQuestion #BitcoinDropsBelow$71K #ChipStocksExtendLossesAfterNvidiaCEOChange #BitMineReports$6.3BNetLossForFiscal2026 #NvidiaNamesColetteKressInterimCEO
150
·
--
Падение
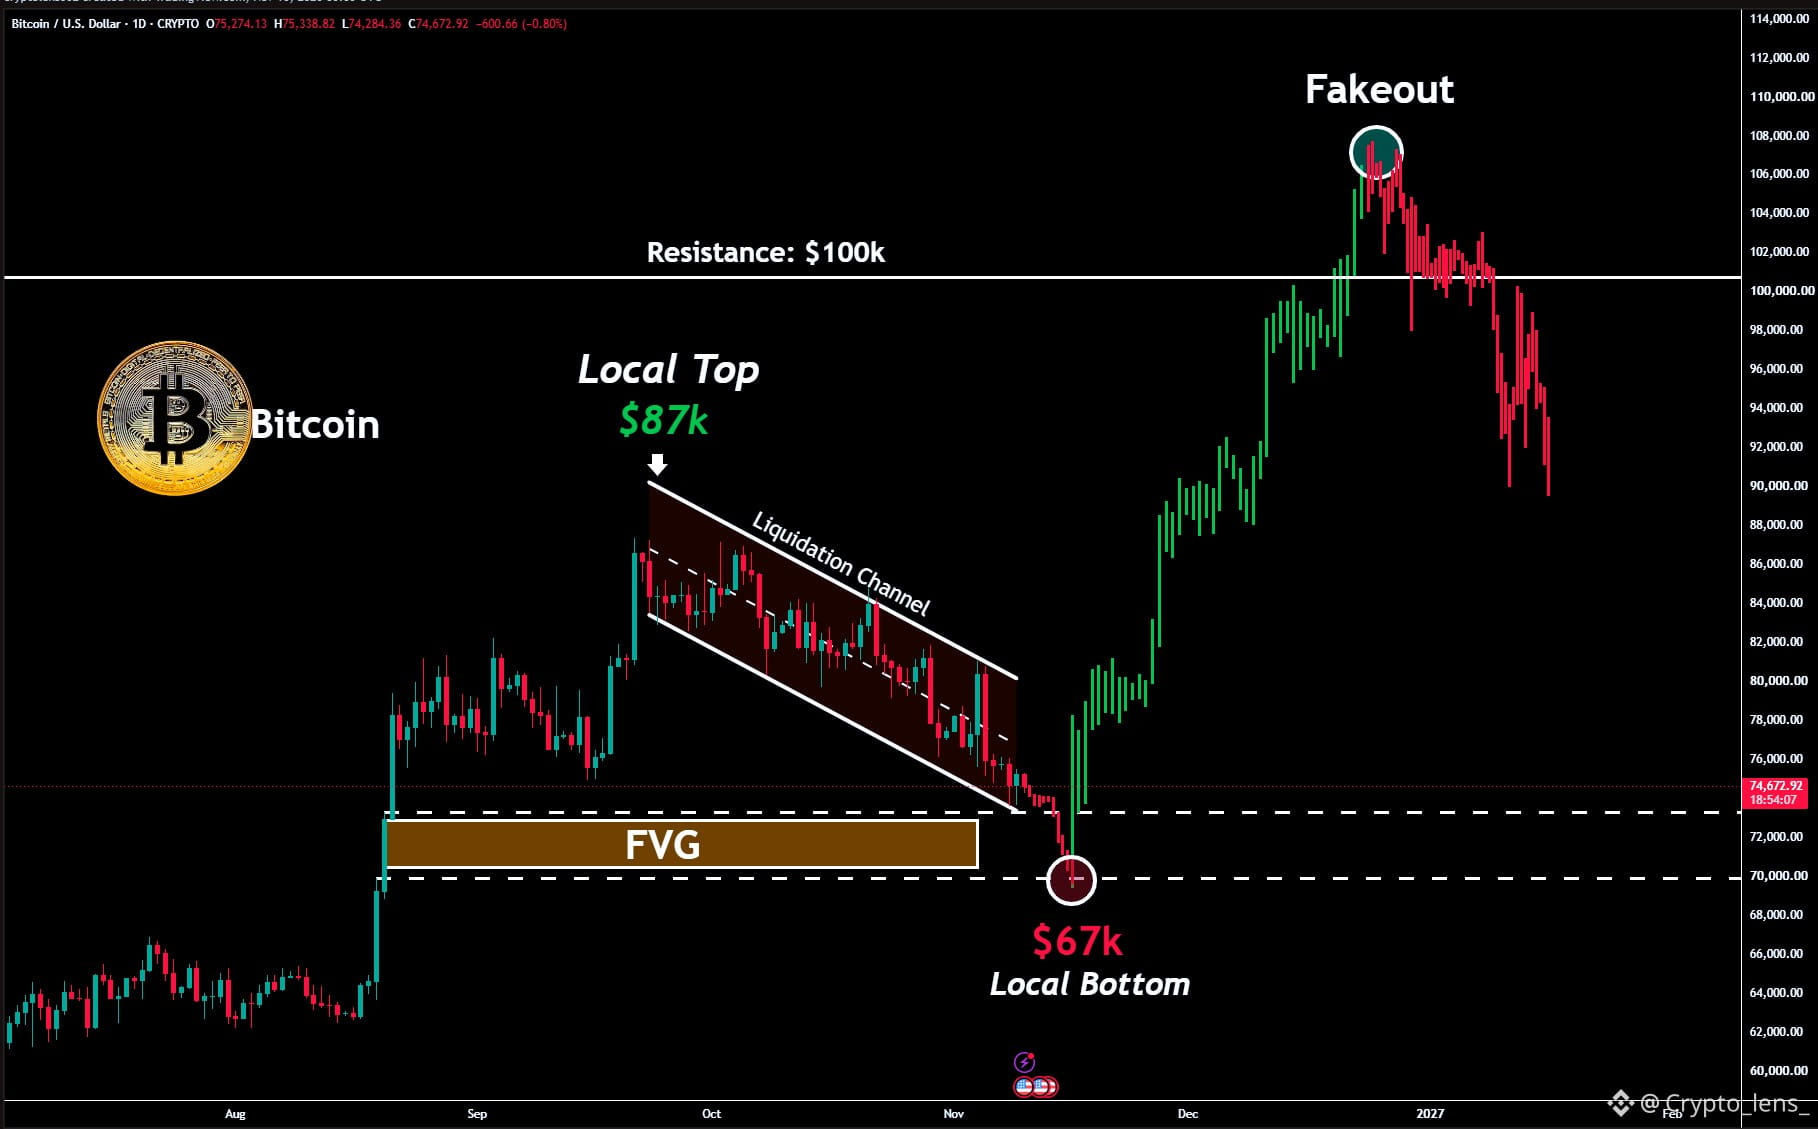
🚨 EVERYTHING IS HAPPENING EXACTLY AS I PREDICTED
One month ago, I told you to short Bitcoin at $87K.
Bitcoin's pattern is now complete, and it has dropped -14% from the exact level.
One more final shakeout is still left in the market.
My next move is clear:
$74K → $71K (Local Bottom) → $81K → $100K
Don't get trapped in the final November trap.
Save this chart now and check it again next month.
Turn on notifications. Follow before you’re late.
I’ll post every major update here first.
$BTC
🚨 EVERYTHING IS HAPPENING EXACTLY AS I PREDICTED
One month ago, I told you to short Bitcoin at $87K.
Bitcoin's pattern is now complete, and it has dropped -14% from the exact level.
One more final shakeout is still left in the market.
My next move is clear:
$74K → $71K (Local Bottom) → $81K → $100K
Don't get trapped in the final November trap.
Save this chart now and check it again next month.
Turn on notifications. Follow before you’re late.
I’ll post every major update here first.
$BTC
One month ago, I told you to short Bitcoin at $87K.
Bitcoin's pattern is now complete, and it has dropped -14% from the exact level.
One more final shakeout is still left in the market.
My next move is clear:
$74K → $71K (Local Bottom) → $81K → $100K
Don't get trapped in the final November trap.
Save this chart now and check it again next month.
Turn on notifications. Follow before you’re late.
I’ll post every major update here first.
$BTC
Crypto student since 2017:
What a moron.
15
56
46.7k


Статья
Why Is Bitcoin Price Down Today?$BTC Bitcoin, the world’s largest cryptocurrency, fell to $69,792 on Monday, retesting its 2021 all-time high as growing geopolitical tensions weighed on market sentiment. The cryptocurrency has lost more than $3,000 over the past 24 hours, dropping 4.2% from around $72,853 a day earlier.
Strategy’s Bitcoin Sale Sparks Sell-Off
One of the biggest talking points came from Strategy, the world’s largest corporate Bitcoin holder. The company disclosed that it sold 32 BTC between May 26 and May 31 for approximately $2.5 million, marking its first Bitcoin sale since December 2022.
While the transaction represented just 0.0037% of its holdings, the move caught investors’ attention because Michael Saylor has long been known for his aggressive buy-and-hold approach.
Despite the sale, Strategy still holds more than 843,000 BTC worth roughly $60 billion.
Mt. Gox Moves $739 Million Worth of Bitcoin
Additional pressure came from the long-defunct crypto exchange Mt. Gox.
Blockchain data showed the exchange transferred 10,422 BTC, worth approximately $739 million, from cold storage. The funds were split between a known hot wallet and another address that has not yet spent the coins.
Although no direct selling has been confirmed, the transfer revived concerns about potential creditor repayments. Many traders fear that recipients could choose to sell part of their Bitcoin holdings, increasing supply in the market. The move marked Mt. Gox’s first major on-chain transaction in nearly two months.
Bitcoin ETF Outflows Continue to Accelerate
Institutional demand also remains under pressure. U.S. spot Bitcoin ETFs have now recorded 11 consecutive days of outflows, with nearly $3 billion leaving the sector during that period.
On June 1 alone, Bitcoin ETFs saw approximately $483.8 million in net outflows. BlackRock’s IBIT accounted for nearly $440 million of that total, highlighting a sharp slowdown in institutional buying activity.
Liquidations Push Bitcoin Below Key Support
The selloff triggered another wave of forced liquidations. According to CoinGlass, more than 155,000 traders were liquidated over the past 24 hours, totaling $798.36 million.
Bitcoin accounted for roughly $458 million in long liquidations, while the largest single liquidation on Binance reached $23.99 million.
What’s Next for Bitcoin Price?
Bitcoin has now broken below a key bear flag pattern that many traders were watching.
According to Altcoin Daily, similar breakdowns have led to deeper corrections. He sees a worst-case scenario near $50,000 if a full 30% decline develops from current levels.
However, many market participants believe the more realistic target is Bitcoin’s 200-week moving average near $62,000. In previous bear market cycles, Bitcoin has repeatedly tested or briefly fallen below this level before forming a long-term bottom.
#BitcoinDropsBelow$71K
Why Is Bitcoin Price Down Today?
$BTC Bitcoin, the world’s largest cryptocurrency, fell to $69,792 on Monday, retesting its 2021 all-time high as growing geopolitical tensions weighed on market sentiment. The cryptocurrency has lost more than $3,000 over the past 24 hours, dropping 4.2% from around $72,853 a day earlier.
Strategy’s Bitcoin Sale Sparks Sell-Off
One of the biggest talking points came from Strategy, the world’s largest corporate Bitcoin holder. The company disclosed that it sold 32 BTC between May 26 and May 31 for approximately $2.5 million, marking its first Bitcoin sale since December 2022.
While the transaction represented just 0.0037% of its holdings, the move caught investors’ attention because Michael Saylor has long been known for his aggressive buy-and-hold approach.
Despite the sale, Strategy still holds more than 843,000 BTC worth roughly $60 billion.
Mt. Gox Moves $739 Million Worth of Bitcoin
Additional pressure came from the long-defunct crypto exchange Mt. Gox.
Blockchain data showed the exchange transferred 10,422 BTC, worth approximately $739 million, from cold storage. The funds were split between a known hot wallet and another address that has not yet spent the coins.
Although no direct selling has been confirmed, the transfer revived concerns about potential creditor repayments. Many traders fear that recipients could choose to sell part of their Bitcoin holdings, increasing supply in the market. The move marked Mt. Gox’s first major on-chain transaction in nearly two months.
Bitcoin ETF Outflows Continue to Accelerate
Institutional demand also remains under pressure. U.S. spot Bitcoin ETFs have now recorded 11 consecutive days of outflows, with nearly $3 billion leaving the sector during that period.
On June 1 alone, Bitcoin ETFs saw approximately $483.8 million in net outflows. BlackRock’s IBIT accounted for nearly $440 million of that total, highlighting a sharp slowdown in institutional buying activity.
Liquidations Push Bitcoin Below Key Support
The selloff triggered another wave of forced liquidations. According to CoinGlass, more than 155,000 traders were liquidated over the past 24 hours, totaling $798.36 million.
Bitcoin accounted for roughly $458 million in long liquidations, while the largest single liquidation on Binance reached $23.99 million.
What’s Next for Bitcoin Price?
Bitcoin has now broken below a key bear flag pattern that many traders were watching.
According to Altcoin Daily, similar breakdowns have led to deeper corrections. He sees a worst-case scenario near $50,000 if a full 30% decline develops from current levels.
However, many market participants believe the more realistic target is Bitcoin’s 200-week moving average near $62,000. In previous bear market cycles, Bitcoin has repeatedly tested or briefly fallen below this level before forming a long-term bottom.
#BitcoinDropsBelow$71K
Strategy’s Bitcoin Sale Sparks Sell-Off
One of the biggest talking points came from Strategy, the world’s largest corporate Bitcoin holder. The company disclosed that it sold 32 BTC between May 26 and May 31 for approximately $2.5 million, marking its first Bitcoin sale since December 2022.
While the transaction represented just 0.0037% of its holdings, the move caught investors’ attention because Michael Saylor has long been known for his aggressive buy-and-hold approach.
Despite the sale, Strategy still holds more than 843,000 BTC worth roughly $60 billion.
Mt. Gox Moves $739 Million Worth of Bitcoin
Additional pressure came from the long-defunct crypto exchange Mt. Gox.
Blockchain data showed the exchange transferred 10,422 BTC, worth approximately $739 million, from cold storage. The funds were split between a known hot wallet and another address that has not yet spent the coins.
Although no direct selling has been confirmed, the transfer revived concerns about potential creditor repayments. Many traders fear that recipients could choose to sell part of their Bitcoin holdings, increasing supply in the market. The move marked Mt. Gox’s first major on-chain transaction in nearly two months.
Bitcoin ETF Outflows Continue to Accelerate
Institutional demand also remains under pressure. U.S. spot Bitcoin ETFs have now recorded 11 consecutive days of outflows, with nearly $3 billion leaving the sector during that period.
On June 1 alone, Bitcoin ETFs saw approximately $483.8 million in net outflows. BlackRock’s IBIT accounted for nearly $440 million of that total, highlighting a sharp slowdown in institutional buying activity.
Liquidations Push Bitcoin Below Key Support
The selloff triggered another wave of forced liquidations. According to CoinGlass, more than 155,000 traders were liquidated over the past 24 hours, totaling $798.36 million.
Bitcoin accounted for roughly $458 million in long liquidations, while the largest single liquidation on Binance reached $23.99 million.
What’s Next for Bitcoin Price?
Bitcoin has now broken below a key bear flag pattern that many traders were watching.
According to Altcoin Daily, similar breakdowns have led to deeper corrections. He sees a worst-case scenario near $50,000 if a full 30% decline develops from current levels.
However, many market participants believe the more realistic target is Bitcoin’s 200-week moving average near $62,000. In previous bear market cycles, Bitcoin has repeatedly tested or briefly fallen below this level before forming a long-term bottom.
#BitcoinDropsBelow$71K
1
1
65

·
--
Падение
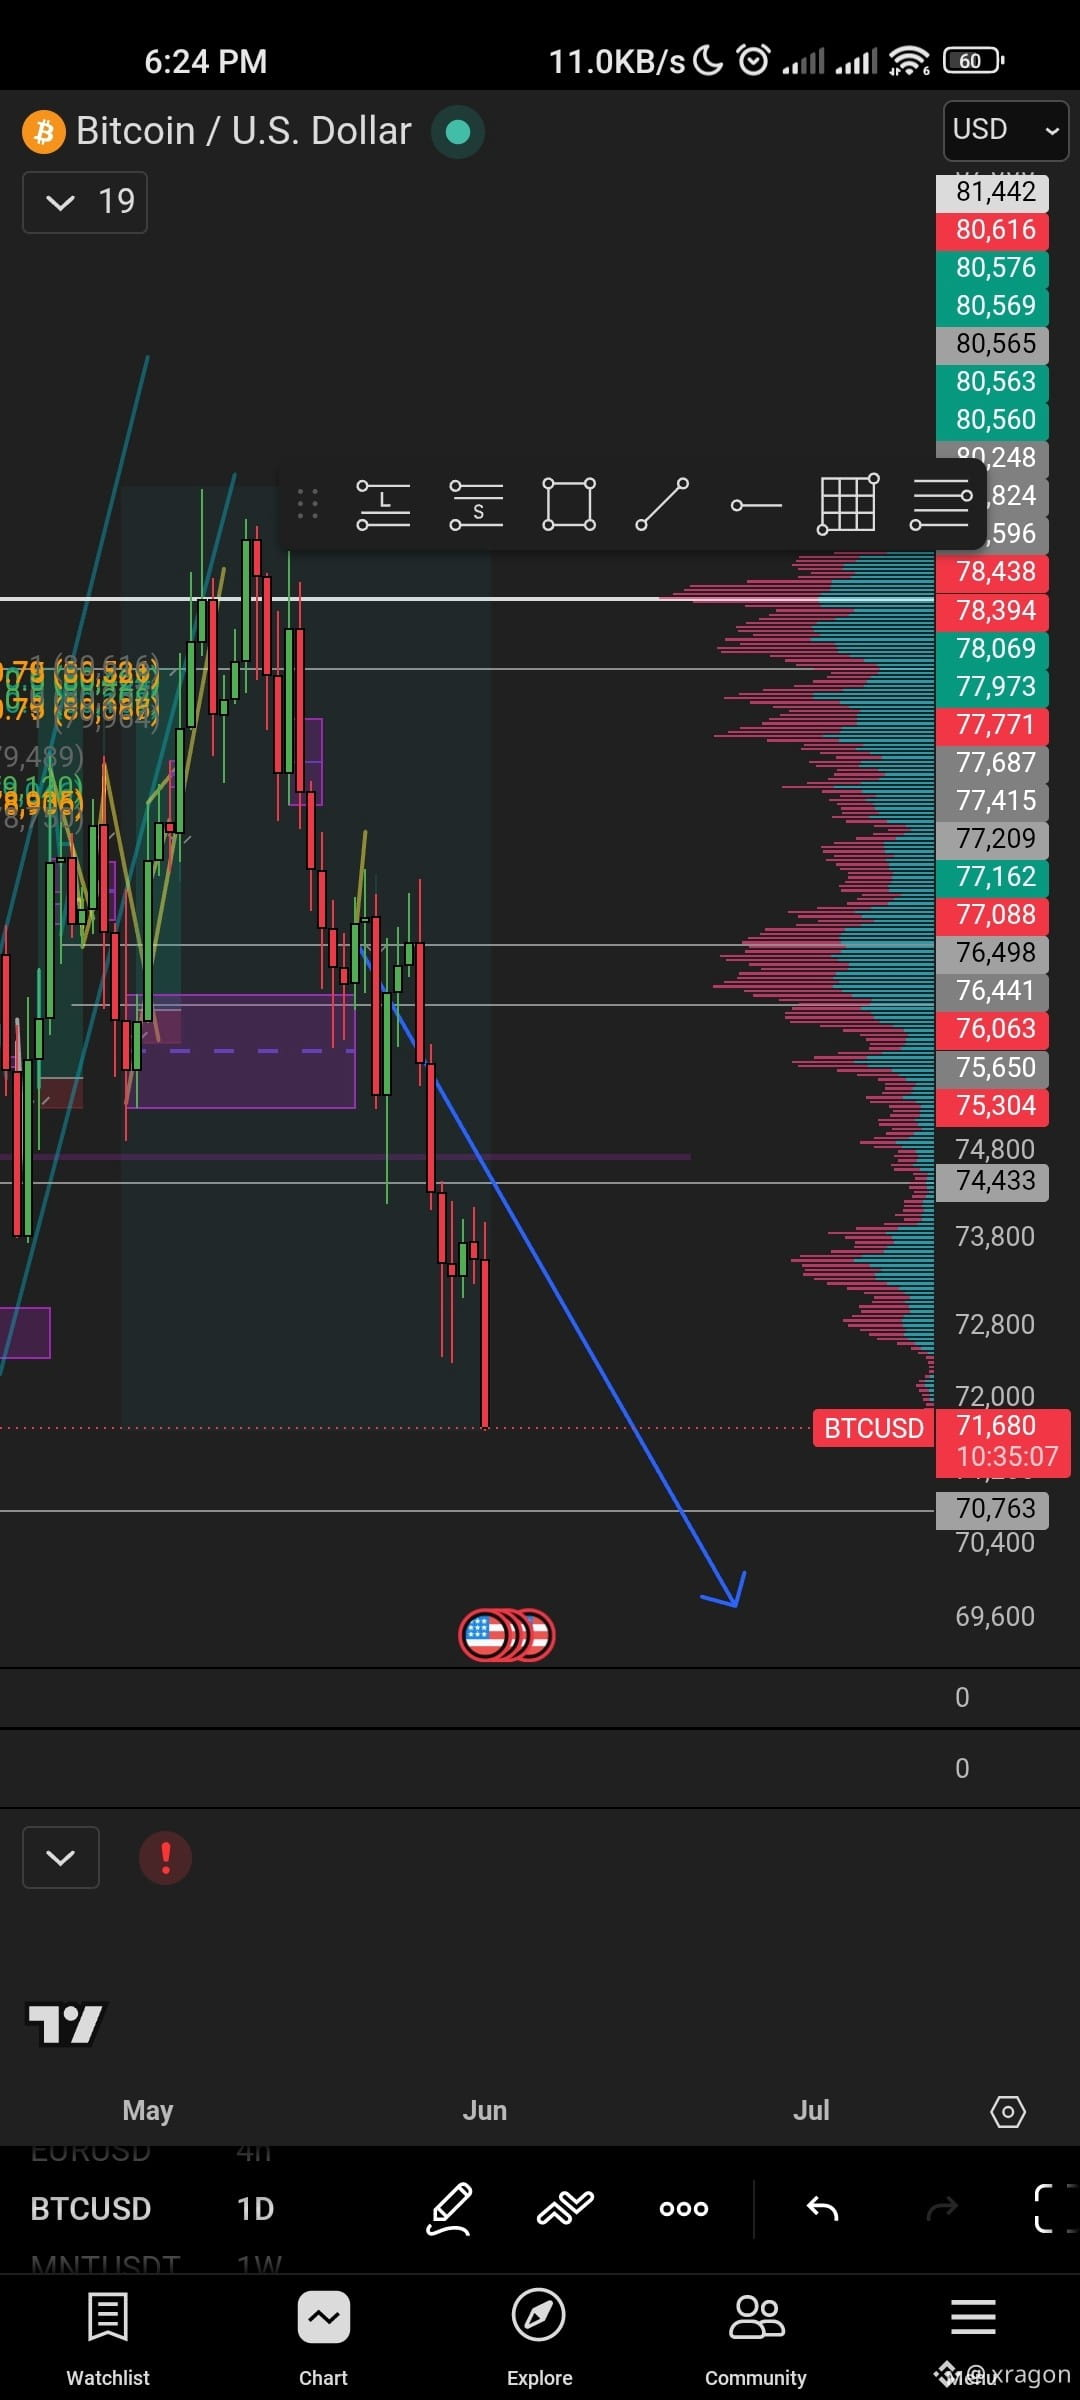
Called for Short Momentum on $BTC from 76K🩸
Now its at 71K Our Bias never Fails💵💯
Now what to look for the lower liquidity 69K to 70K zones possibly will be hit in the peak NY sessions and manage risk accordingly!!
{future}(BTCUSDT)
Called for Short Momentum on $BTC from 76K🩸
Now its at 71K Our Bias never Fails💵💯
Now what to look for the lower liquidity 69K to 70K zones possibly will be hit in the peak NY sessions and manage risk accordingly!!
Now its at 71K Our Bias never Fails💵💯
Now what to look for the lower liquidity 69K to 70K zones possibly will be hit in the peak NY sessions and manage risk accordingly!!
2
5
1.2k

·
--

Статья
Crypto Market Update: BTC Falls Below $71K While ETH, SOL, XRP & BNB Face Market PressureThe cryptocurrency market began the week under pressure as $BTC dropped below the $71,000 level, increasing uncertainty across the digital asset sector. According to Binance Market Data, BTC recently traded around $70,975 after a notable decline over the past 24 hours.
The latest weakness in the market is being linked to continued ETF outflows and cautious investor sentiment. Market participants are closely watching whether Bitcoin can hold the important $70,000 support zone. A successful defense of this level could help restore confidence and trigger a broader recovery.
$ETH remains under pressure near the $2,000 region, while major altcoins including $SOL are also experiencing increased volatility. Despite the recent correction, long-term investors continue to view these assets as key players in the next phase of crypto adoption.
Analysts suggest that if Bitcoin reclaims the $74,000 resistance area, bullish momentum could quickly return to the broader market. Until then, traders are expected to remain cautious as macroeconomic uncertainty and market volatility continue to influence price action#BitcoinDropsBelow$71K #ETHETFsApproved
{spot}(ETHUSDT)
Crypto Market Update: BTC Falls Below $71K While ETH, SOL, XRP & BNB Face Market Pressure
The cryptocurrency market began the week under pressure as $BTC dropped below the $71,000 level, increasing uncertainty across the digital asset sector. According to Binance Market Data, BTC recently traded around $70,975 after a notable decline over the past 24 hours.
The latest weakness in the market is being linked to continued ETF outflows and cautious investor sentiment. Market participants are closely watching whether Bitcoin can hold the important $70,000 support zone. A successful defense of this level could help restore confidence and trigger a broader recovery.
$ETH remains under pressure near the $2,000 region, while major altcoins including $SOL are also experiencing increased volatility. Despite the recent correction, long-term investors continue to view these assets as key players in the next phase of crypto adoption.
Analysts suggest that if Bitcoin reclaims the $74,000 resistance area, bullish momentum could quickly return to the broader market. Until then, traders are expected to remain cautious as macroeconomic uncertainty and market volatility continue to influence price action#BitcoinDropsBelow$71K #ETHETFsApproved
The latest weakness in the market is being linked to continued ETF outflows and cautious investor sentiment. Market participants are closely watching whether Bitcoin can hold the important $70,000 support zone. A successful defense of this level could help restore confidence and trigger a broader recovery.
$ETH remains under pressure near the $2,000 region, while major altcoins including $SOL are also experiencing increased volatility. Despite the recent correction, long-term investors continue to view these assets as key players in the next phase of crypto adoption.
Analysts suggest that if Bitcoin reclaims the $74,000 resistance area, bullish momentum could quickly return to the broader market. Until then, traders are expected to remain cautious as macroeconomic uncertainty and market volatility continue to influence price action#BitcoinDropsBelow$71K #ETHETFsApproved
137

·
--

Статья
Bitcoin was sold as the asset that survives geopolitical chaos.The chaos arrived.
Bitcoin bled.
The US bombed Iran. Iran fired ballistic missiles at US forces in Kuwait. Israel pushed into Lebanon. The Strait of Hormuz has been effectively closed for ninety-four days. Oil ripped above $90. Bitcoin slid below $70,000 with the longest ETF outflow streak in its history. Ten days. $2.97 billion out. A $1.3 billion BlackRock IBIT block sale through a dark pool.
The S&P 500 closed at an all-time high. The Nasdaq closed at an all-time high. The ninth straight green week on the S&P, the longest streak since 2023. Nvidia ripped 6 percent on a new PC chip. Dell rose 11. HP rose 9. Berkshire anchored Alphabet’s $80 billion equity raise with $10 billion at a discount.
That divergence is the trade.
Gold rose. Bitcoin fell.
That is not the verification trade Bitcoin promised. That is the risk trade Bitcoin became.
The wrapper is the giveaway. The ETF that was supposed to bring Bitcoin to institutional grade has become its exit ramp. Institutional money does not buy Bitcoin to ride a war hedge. It buys the wrapper for exposure, sells it for liquidity, and rotates the proceeds wherever the duration story is paying best.
This week, that meant out of Bitcoin and into AI compute.
Same week, Michael Saylor’s Strategy sold 32 Bitcoin. First sale in four years. The most religious never-sell balance sheet in the asset just sold. The narrative break matters more than the size.
Now look at where the rotation lands. Alphabet is raising $80 billion in equity to fund the AI buildout. Berkshire just anchored at a roughly six percent discount. Nvidia just pledged $150 billion a year in Taiwanese suppliers. The capex flows into chips. The chip orders flow into the same special purpose vehicles, private credit pipes, and insurance balance sheets that have been routing residual GPU risk into American retirement annuities for months.
The institutional dollar leaving Bitcoin is, in real time, rotating into the AI capex cycle that ends inside the same Athene-Bermuda pipe Burry traced last week.
Two stories. One verification regime. The story that wins is the one that lets the slowest-clock holder absorb the residual.
War did not interrupt the rally. War accelerated the rotation.
The S&P at 7,600 and Bitcoin at $70,000 are the same data point read in two languages.
$BTC
{future}(BTCUSDT)
$SPY
{future}(SPYUSDT)
#XRPDropsBelow$1.30OnHeavyVolume #BitcoinDropsBelow$71K #StrategySellsBTCForFirstTimeIn4Years #BlackRockCryptoDown17PctYTD #BitcoinDropsBelow$71000
Bitcoin was sold as the asset that survives geopolitical chaos.
The chaos arrived.
Bitcoin bled.
The US bombed Iran. Iran fired ballistic missiles at US forces in Kuwait. Israel pushed into Lebanon. The Strait of Hormuz has been effectively closed for ninety-four days. Oil ripped above $90. Bitcoin slid below $70,000 with the longest ETF outflow streak in its history. Ten days. $2.97 billion out. A $1.3 billion BlackRock IBIT block sale through a dark pool.
The S&P 500 closed at an all-time high. The Nasdaq closed at an all-time high. The ninth straight green week on the S&P, the longest streak since 2023. Nvidia ripped 6 percent on a new PC chip. Dell rose 11. HP rose 9. Berkshire anchored Alphabet’s $80 billion equity raise with $10 billion at a discount.
That divergence is the trade.
Gold rose. Bitcoin fell.
That is not the verification trade Bitcoin promised. That is the risk trade Bitcoin became.
The wrapper is the giveaway. The ETF that was supposed to bring Bitcoin to institutional grade has become its exit ramp. Institutional money does not buy Bitcoin to ride a war hedge. It buys the wrapper for exposure, sells it for liquidity, and rotates the proceeds wherever the duration story is paying best.
This week, that meant out of Bitcoin and into AI compute.
Same week, Michael Saylor’s Strategy sold 32 Bitcoin. First sale in four years. The most religious never-sell balance sheet in the asset just sold. The narrative break matters more than the size.
Now look at where the rotation lands. Alphabet is raising $80 billion in equity to fund the AI buildout. Berkshire just anchored at a roughly six percent discount. Nvidia just pledged $150 billion a year in Taiwanese suppliers. The capex flows into chips. The chip orders flow into the same special purpose vehicles, private credit pipes, and insurance balance sheets that have been routing residual GPU risk into American retirement annuities for months.
The institutional dollar leaving Bitcoin is, in real time, rotating into the AI capex cycle that ends inside the same Athene-Bermuda pipe Burry traced last week.
Two stories. One verification regime. The story that wins is the one that lets the slowest-clock holder absorb the residual.
War did not interrupt the rally. War accelerated the rotation.
The S&P at 7,600 and Bitcoin at $70,000 are the same data point read in two languages.
$BTC
$SPY
#XRPDropsBelow$1.30OnHeavyVolume #BitcoinDropsBelow$71K #StrategySellsBTCForFirstTimeIn4Years #BlackRockCryptoDown17PctYTD #BitcoinDropsBelow$71000
Bitcoin bled.
The US bombed Iran. Iran fired ballistic missiles at US forces in Kuwait. Israel pushed into Lebanon. The Strait of Hormuz has been effectively closed for ninety-four days. Oil ripped above $90. Bitcoin slid below $70,000 with the longest ETF outflow streak in its history. Ten days. $2.97 billion out. A $1.3 billion BlackRock IBIT block sale through a dark pool.
The S&P 500 closed at an all-time high. The Nasdaq closed at an all-time high. The ninth straight green week on the S&P, the longest streak since 2023. Nvidia ripped 6 percent on a new PC chip. Dell rose 11. HP rose 9. Berkshire anchored Alphabet’s $80 billion equity raise with $10 billion at a discount.
That divergence is the trade.
Gold rose. Bitcoin fell.
That is not the verification trade Bitcoin promised. That is the risk trade Bitcoin became.
The wrapper is the giveaway. The ETF that was supposed to bring Bitcoin to institutional grade has become its exit ramp. Institutional money does not buy Bitcoin to ride a war hedge. It buys the wrapper for exposure, sells it for liquidity, and rotates the proceeds wherever the duration story is paying best.
This week, that meant out of Bitcoin and into AI compute.
Same week, Michael Saylor’s Strategy sold 32 Bitcoin. First sale in four years. The most religious never-sell balance sheet in the asset just sold. The narrative break matters more than the size.
Now look at where the rotation lands. Alphabet is raising $80 billion in equity to fund the AI buildout. Berkshire just anchored at a roughly six percent discount. Nvidia just pledged $150 billion a year in Taiwanese suppliers. The capex flows into chips. The chip orders flow into the same special purpose vehicles, private credit pipes, and insurance balance sheets that have been routing residual GPU risk into American retirement annuities for months.
The institutional dollar leaving Bitcoin is, in real time, rotating into the AI capex cycle that ends inside the same Athene-Bermuda pipe Burry traced last week.
Two stories. One verification regime. The story that wins is the one that lets the slowest-clock holder absorb the residual.
War did not interrupt the rally. War accelerated the rotation.
The S&P at 7,600 and Bitcoin at $70,000 are the same data point read in two languages.
$BTC
$SPY
#XRPDropsBelow$1.30OnHeavyVolume #BitcoinDropsBelow$71K #StrategySellsBTCForFirstTimeIn4Years #BlackRockCryptoDown17PctYTD #BitcoinDropsBelow$71000
2
2
184

·
--
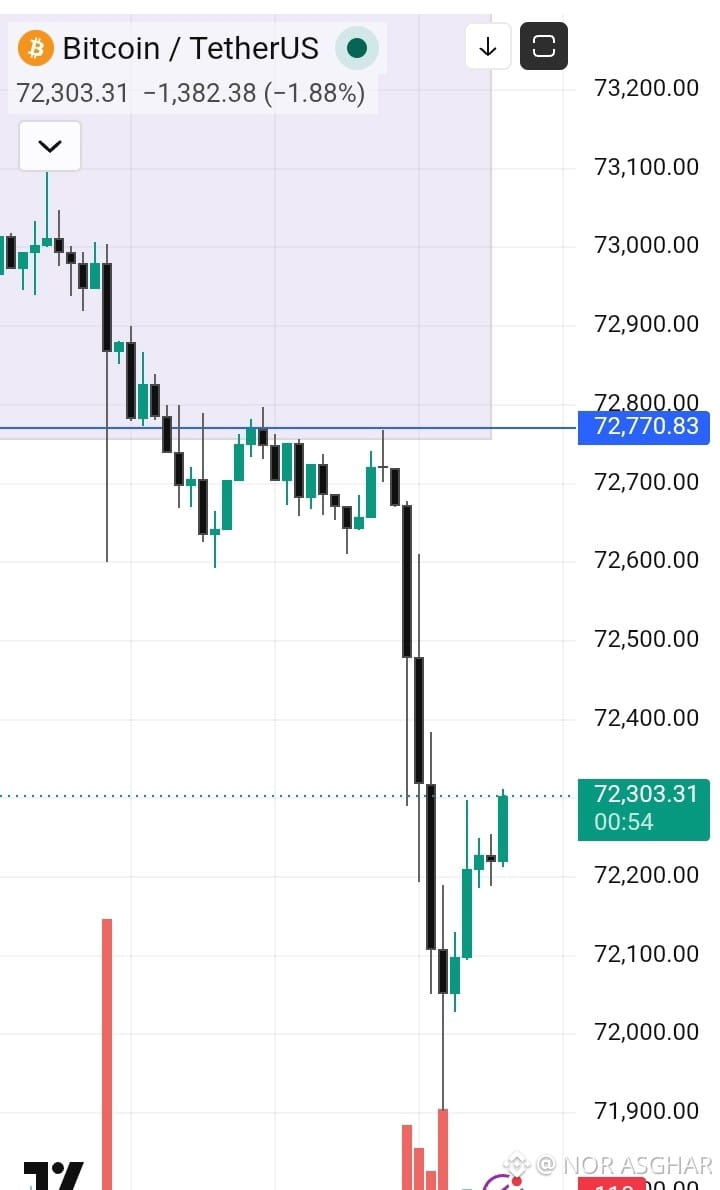
After a Big fall $BTC move up a little remember ...
BTC has gave breakout The next support can be $71k ...
what you think is next support 71k ?
{future}(BTCUSDT)
After a Big fall $BTC move up a little remember ...
BTC has gave breakout The next support can be $71k ...
what you think is next support 71k ?
BTC has gave breakout The next support can be $71k ...
what you think is next support 71k ?
2
164

$BTC is testing one of the most important zones of this cycle.
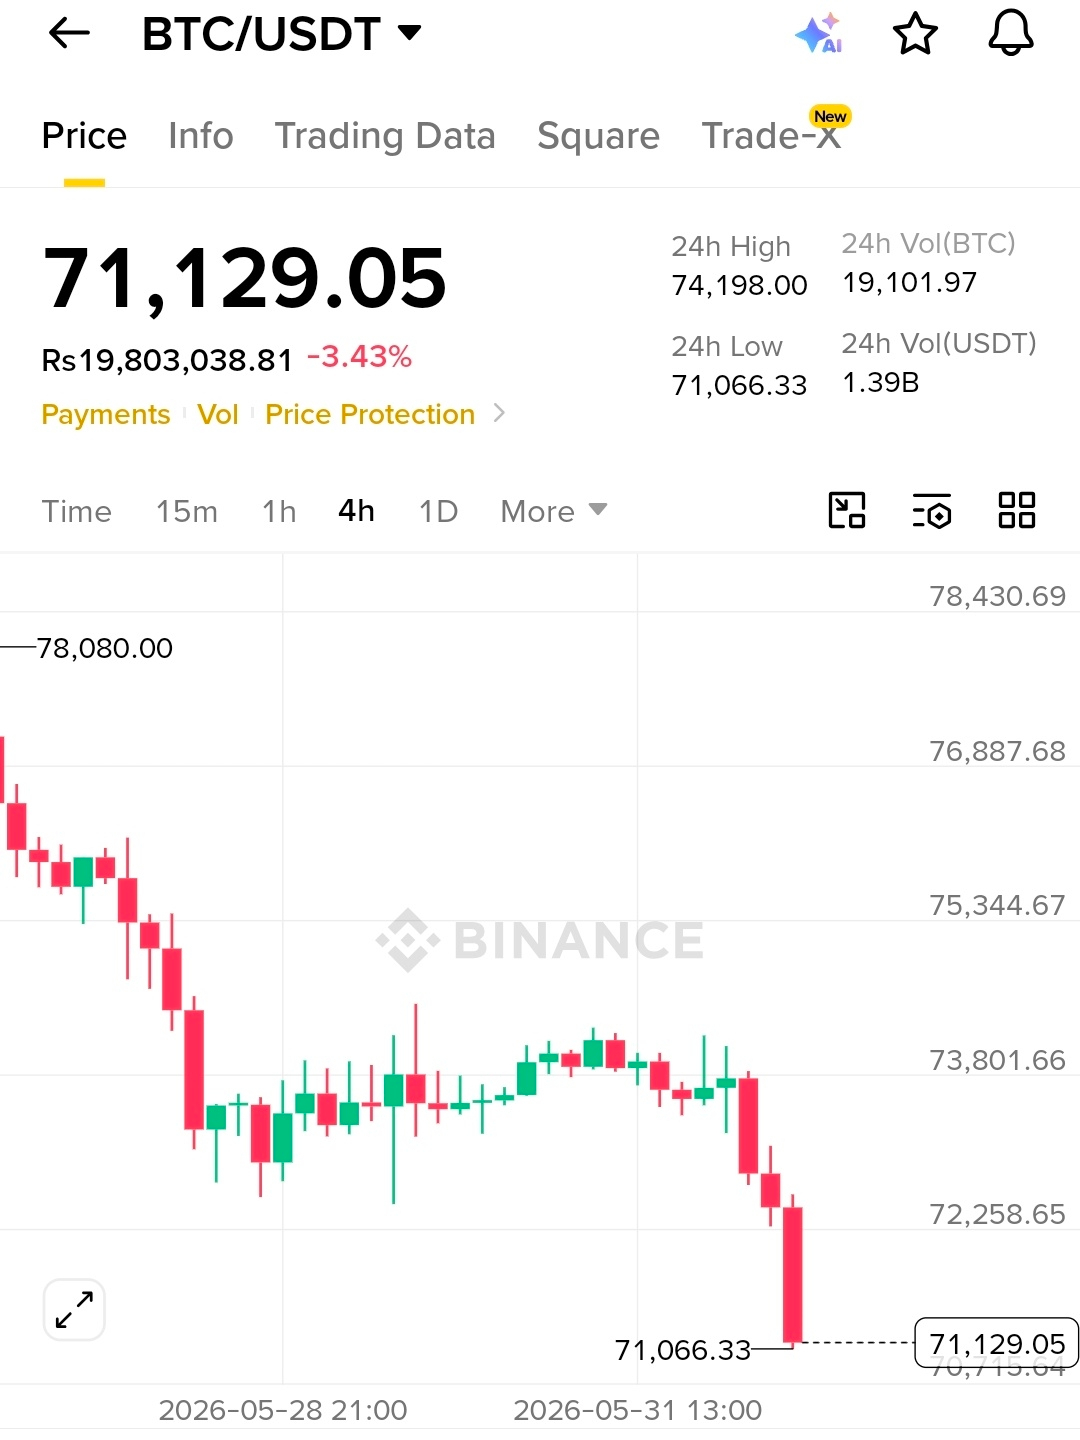
After failing to reclaim the $74K region, sellers stepped in aggressively and pushed BTC down to $71,066 on the 4H chart. The rejection wasn't gradual. It was sharp, fast, and backed by strong momentum, showing that bulls are still struggling to regain control.
What stands out here is the structure.
For several days, Bitcoin moved sideways between roughly $72K and $74K, building a temporary base. Instead of breaking higher, price lost support and flushed directly into the $71K area. That kind of move usually signals fear returning to the market, especially after traders start expecting a quick recovery.
The good news is that $71K remains a major support zone.
This level is now the line many traders are watching. As long as BTC holds above it, the possibility of a relief bounce remains alive. A recovery back toward $72.5K-$74K would not be surprising if buyers defend this area.
However, if $71K breaks with strong volume, the market could quickly search for liquidity lower, opening the door for a deeper correction before any meaningful recovery begins.
Right now, this is not a market for blind optimism or panic.
It's a market that rewards patience.
The next reaction around $71K will likely decide whether Bitcoin is building a bottom or preparing for another leg down. The battle has reached a critical level, and the next few candles could set the tone for the entire week.
$BTC is testing one of the most important zones of this cycle.
After failing to reclaim the $74K region, sellers stepped in aggressively and pushed BTC down to $71,066 on the 4H chart. The rejection wasn't gradual. It was sharp, fast, and backed by strong momentum, showing that bulls are still struggling to regain control.
What stands out here is the structure.
For several days, Bitcoin moved sideways between roughly $72K and $74K, building a temporary base. Instead of breaking higher, price lost support and flushed directly into the $71K area. That kind of move usually signals fear returning to the market, especially after traders start expecting a quick recovery.
The good news is that $71K remains a major support zone.
This level is now the line many traders are watching. As long as BTC holds above it, the possibility of a relief bounce remains alive. A recovery back toward $72.5K-$74K would not be surprising if buyers defend this area.
However, if $71K breaks with strong volume, the market could quickly search for liquidity lower, opening the door for a deeper correction before any meaningful recovery begins.
Right now, this is not a market for blind optimism or panic.
It's a market that rewards patience.
The next reaction around $71K will likely decide whether Bitcoin is building a bottom or preparing for another leg down. The battle has reached a critical level, and the next few candles could set the tone for the entire week.
After failing to reclaim the $74K region, sellers stepped in aggressively and pushed BTC down to $71,066 on the 4H chart. The rejection wasn't gradual. It was sharp, fast, and backed by strong momentum, showing that bulls are still struggling to regain control.
What stands out here is the structure.
For several days, Bitcoin moved sideways between roughly $72K and $74K, building a temporary base. Instead of breaking higher, price lost support and flushed directly into the $71K area. That kind of move usually signals fear returning to the market, especially after traders start expecting a quick recovery.
The good news is that $71K remains a major support zone.
This level is now the line many traders are watching. As long as BTC holds above it, the possibility of a relief bounce remains alive. A recovery back toward $72.5K-$74K would not be surprising if buyers defend this area.
However, if $71K breaks with strong volume, the market could quickly search for liquidity lower, opening the door for a deeper correction before any meaningful recovery begins.
Right now, this is not a market for blind optimism or panic.
It's a market that rewards patience.
The next reaction around $71K will likely decide whether Bitcoin is building a bottom or preparing for another leg down. The battle has reached a critical level, and the next few candles could set the tone for the entire week.
1
443

·
--
QUICK UPDATE $BTC VIEW CURRENTLY 02/06
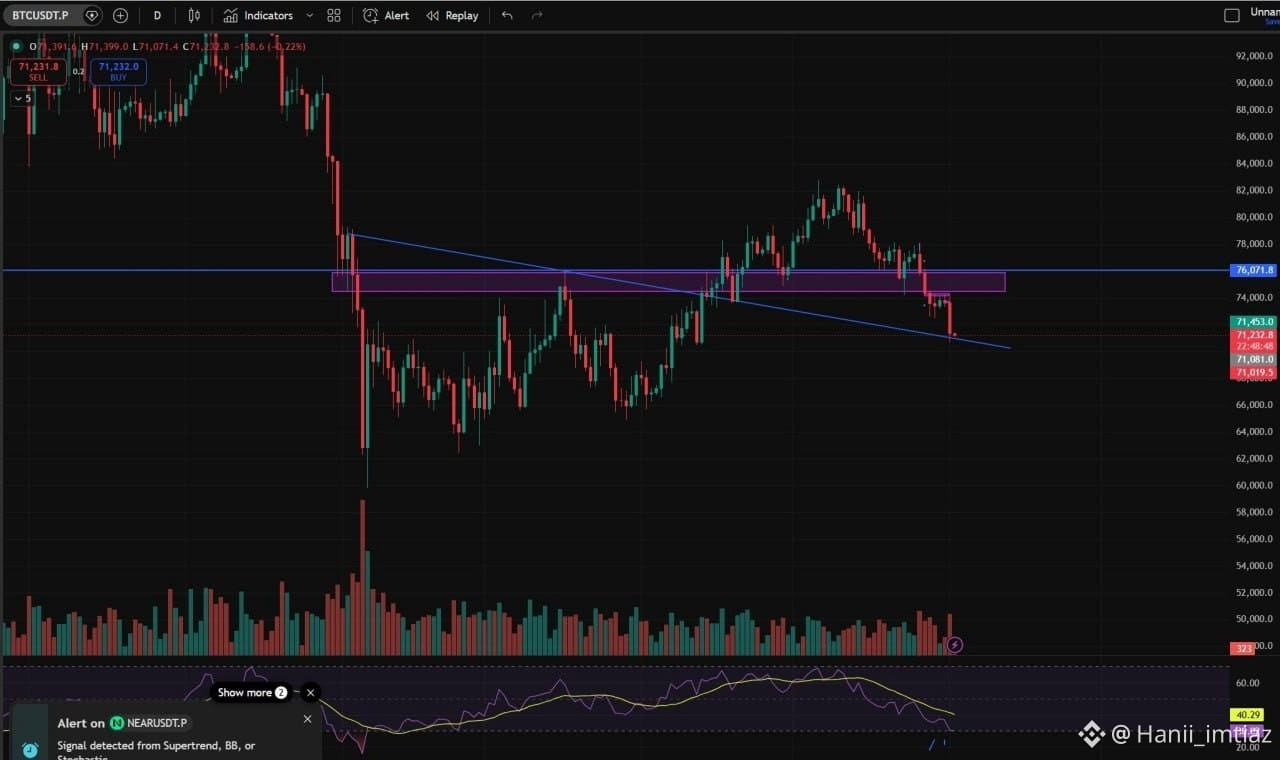
Yesterday's session saw an extremely strong downward trend as BTC plunged from the 74k zone straight to the 71k$ zone and is currently backtesting the support level at 71k$.
However, according to the admin's assessment, this level could be completely broken today given the current selling pressure.
Today, the main strategy remains Shorting, following the trend to be safe and avoid obstacles.
Wishing everyone a new day of great victory 🤩🤩
{future}(BTCUSDT)
QUICK UPDATE $BTC VIEW CURRENTLY 02/06
Yesterday's session saw an extremely strong downward trend as BTC plunged from the 74k zone straight to the 71k$ zone and is currently backtesting the support level at 71k$.
However, according to the admin's assessment, this level could be completely broken today given the current selling pressure.
Today, the main strategy remains Shorting, following the trend to be safe and avoid obstacles.
Wishing everyone a new day of great victory 🤩🤩
Yesterday's session saw an extremely strong downward trend as BTC plunged from the 74k zone straight to the 71k$ zone and is currently backtesting the support level at 71k$.
However, according to the admin's assessment, this level could be completely broken today given the current selling pressure.
Today, the main strategy remains Shorting, following the trend to be safe and avoid obstacles.
Wishing everyone a new day of great victory 🤩🤩
2
518

·
--
$BTC
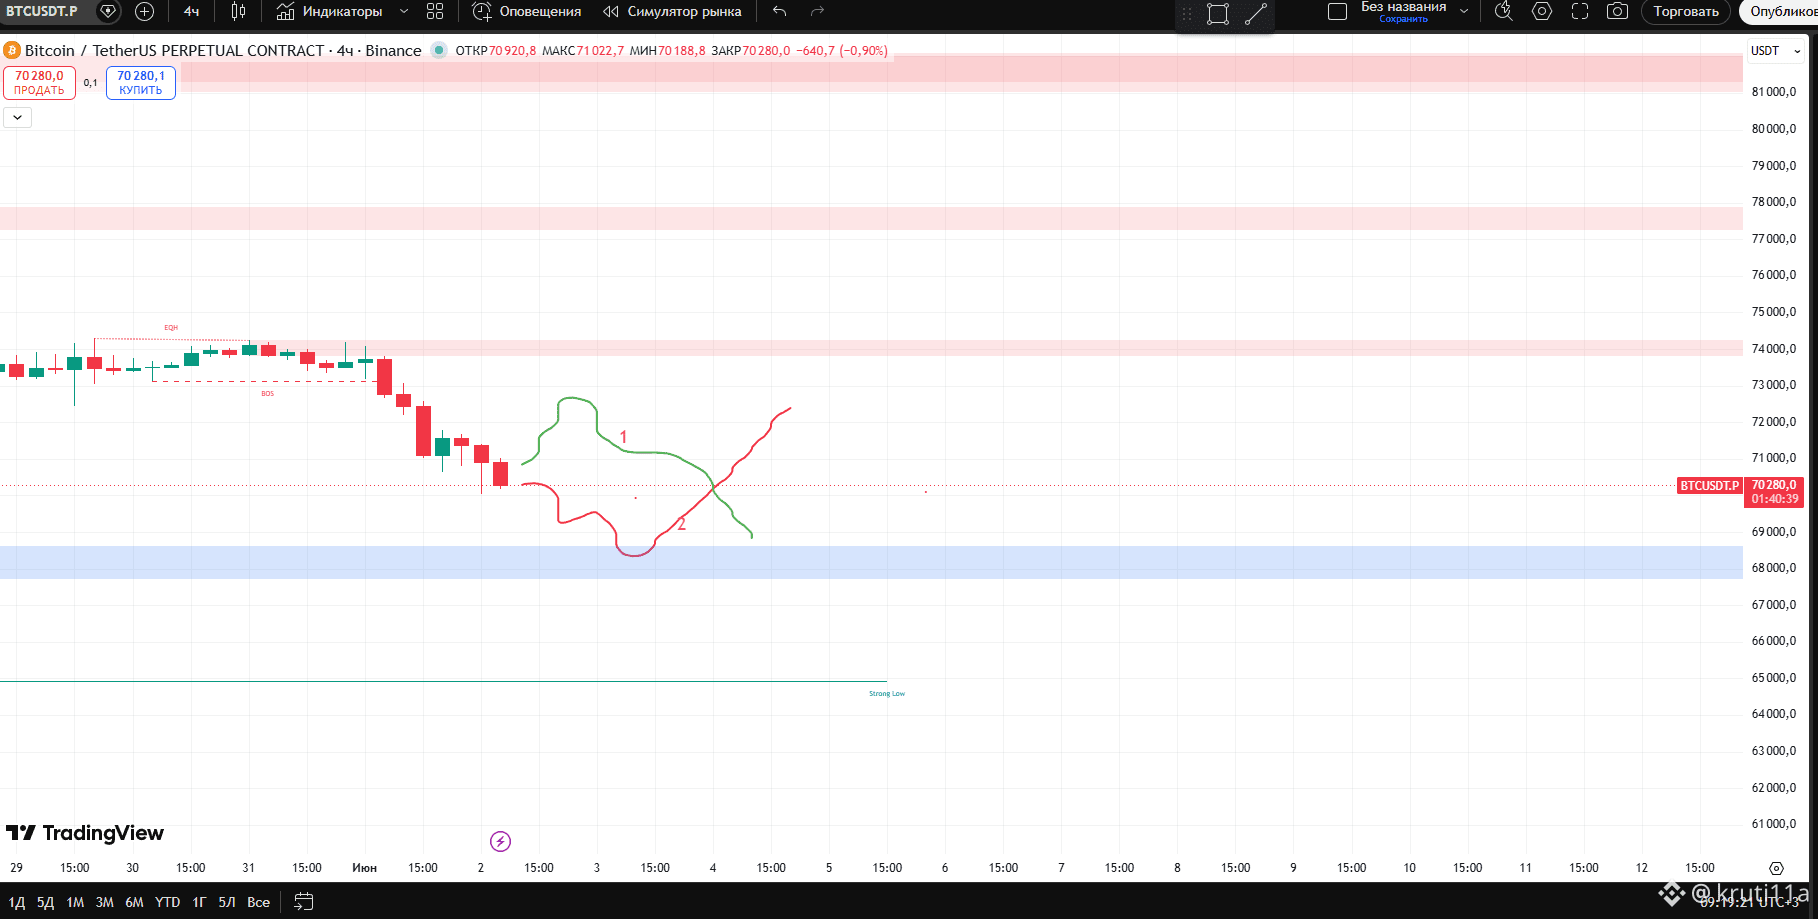
По биткоину возможны 2 варианта развития событий (указаны на графике) Лично я склоняюсь к варианту №2 - опускаемся в район 68-69к и уже потом отскок в район 72-73к. Но возможен отскок и с текущих
#BTC #аналитика #BitcoinDropsBelow$71K #криптовалюта
$BTC
По биткоину возможны 2 варианта развития событий (указаны на графике) Лично я склоняюсь к варианту №2 - опускаемся в район 68-69к и уже потом отскок в район 72-73к. Но возможен отскок и с текущих
#BTC #аналитика #BitcoinDropsBelow$71K #криптовалюта
По биткоину возможны 2 варианта развития событий (указаны на графике) Лично я склоняюсь к варианту №2 - опускаемся в район 68-69к и уже потом отскок в район 72-73к. Но возможен отскок и с текущих
#BTC #аналитика #BitcoinDropsBelow$71K #криптовалюта
266

·
--

Статья
Bitcoin Price Prediction: June Starts With a Broken Chart and the Biggest ETF Exit in MonthsSpot Bitcoin ETFs bled $483.76M on June 1 with BlackRock IBIT leading at $440.29M in a single dayBTC broke below the ascending channel lower trendline for the second time with all four EMAs and SAR overheadBenjamin Cowen calls for a $70K tag followed by a bounce then a revisit of February 2026 lows
Bitcoin trades at $70,261 on June 2, breaking below the ascending channel that recovered price from the February lows, as spot ETF outflows accelerate into the new month and analysts increasingly point toward the February 2026 lows as the June destination.
BTC June 2026 Price Outlook: Second Channel Break and February Lows Back in Play
BTC built an ascending channel from the February lows near $60,000 through the May high near $83,000, then broke below the lower trendline. Price recovered briefly back inside the channel in late May before breaking down again heading into June. Two breaks of the same channel without recovery is not a retest, it is a failed structure.
All four EMAs sit above current price. The 20 EMA at $75,110, the 50 EMA at $75,759, the 100 EMA at $76,313, and the 200 EMA at $80,846 are all clustered in the same zone, with the SAR at $76,367 adding another ceiling in the same area. Reclaiming $75,110 on a weekly close is the minimum requirement before any bullish June case has merit. The horizontal support near $71,000 is thinning after repeated tests. Below that, the February lows near $60,000 are the next meaningful demand area with nothing clean in between.
BTC Key levels for June:
Resistance: $75,110 (20 EMA), $76,313 (100 EMA), $76,367 (SAR)
Support: $71,000 (horizontal), $65,000 (prior base), $60,000 (February lows)
Cowen and Schiff Agree on Direction for Different Reasons
Benjamin Cowen posted that BTC has now tagged $70,000 as he expected, with his base case calling for a small bounce of a few days to a week followed by a return to the February 2026 lows. He framed the call openly, stating if he is wrong about revisiting those lows he will publicly say so. His read sits inside the midterm year pattern he has flagged all year, where June historically marks the weak point before a summer bounce and Q4 resolution.
ETF Outflows Are Now a Trend Not a Single Event
Spot Bitcoin ETFs bled $483.76M on June 1 with BlackRock IBIT alone accounting for $440.29M. Fidelity FBTC added $37.29M and Ark and 21Shares ARKB contributed another $12.32M. Total net assets now sit at $91.16B, down from a peak above $109B in April.
May closed with more than $2.43B in cumulative net outflows from spot Bitcoin ETFs. The selling accelerated toward month-end with approximately $1.42B pulled over the final week alone, the third-largest weekly outflow on record. Outflows have printed red on eleven of the last thirteen trading days and the pace is getting worse, not stabilizing.
{future}(BTCUSDT)
{future}(ETHUSDT)
{future}(BNBUSDT)
BTC Price Prediction for June 2026
Downside: Losing $71,000 on a weekly close accelerates the path toward the February lows near $60,000, which is Cowen’s stated destination after any near-term bounce resolves.
Upside: A bounce off $70,000 that reclaims $75,110 and holds the 20 EMA on a weekly close delays the February low retest and opens $78,000 to $80,000, but that requires ETF outflows to reverse after nearly two weeks of consecutive red.
#XRPDropsBelow$1.30OnHeavyVolume
#BitcoinDropsBelow$71K #SolanaDEXVolumeFalls82Pct
#XRPDropsBelow$1.30OnHeavyVolume
Bitcoin Price Prediction: June Starts With a Broken Chart and the Biggest ETF Exit in Months
Spot Bitcoin ETFs bled $483.76M on June 1 with BlackRock IBIT leading at $440.29M in a single dayBTC broke below the ascending channel lower trendline for the second time with all four EMAs and SAR overheadBenjamin Cowen calls for a $70K tag followed by a bounce then a revisit of February 2026 lows
Bitcoin trades at $70,261 on June 2, breaking below the ascending channel that recovered price from the February lows, as spot ETF outflows accelerate into the new month and analysts increasingly point toward the February 2026 lows as the June destination.
BTC June 2026 Price Outlook: Second Channel Break and February Lows Back in Play
BTC built an ascending channel from the February lows near $60,000 through the May high near $83,000, then broke below the lower trendline. Price recovered briefly back inside the channel in late May before breaking down again heading into June. Two breaks of the same channel without recovery is not a retest, it is a failed structure.
All four EMAs sit above current price. The 20 EMA at $75,110, the 50 EMA at $75,759, the 100 EMA at $76,313, and the 200 EMA at $80,846 are all clustered in the same zone, with the SAR at $76,367 adding another ceiling in the same area. Reclaiming $75,110 on a weekly close is the minimum requirement before any bullish June case has merit. The horizontal support near $71,000 is thinning after repeated tests. Below that, the February lows near $60,000 are the next meaningful demand area with nothing clean in between.
BTC Key levels for June:
Resistance: $75,110 (20 EMA), $76,313 (100 EMA), $76,367 (SAR)
Support: $71,000 (horizontal), $65,000 (prior base), $60,000 (February lows)
Cowen and Schiff Agree on Direction for Different Reasons
Benjamin Cowen posted that BTC has now tagged $70,000 as he expected, with his base case calling for a small bounce of a few days to a week followed by a return to the February 2026 lows. He framed the call openly, stating if he is wrong about revisiting those lows he will publicly say so. His read sits inside the midterm year pattern he has flagged all year, where June historically marks the weak point before a summer bounce and Q4 resolution.
ETF Outflows Are Now a Trend Not a Single Event
Spot Bitcoin ETFs bled $483.76M on June 1 with BlackRock IBIT alone accounting for $440.29M. Fidelity FBTC added $37.29M and Ark and 21Shares ARKB contributed another $12.32M. Total net assets now sit at $91.16B, down from a peak above $109B in April.
May closed with more than $2.43B in cumulative net outflows from spot Bitcoin ETFs. The selling accelerated toward month-end with approximately $1.42B pulled over the final week alone, the third-largest weekly outflow on record. Outflows have printed red on eleven of the last thirteen trading days and the pace is getting worse, not stabilizing.
BTC Price Prediction for June 2026
Downside: Losing $71,000 on a weekly close accelerates the path toward the February lows near $60,000, which is Cowen’s stated destination after any near-term bounce resolves.
Upside: A bounce off $70,000 that reclaims $75,110 and holds the 20 EMA on a weekly close delays the February low retest and opens $78,000 to $80,000, but that requires ETF outflows to reverse after nearly two weeks of consecutive red.
#XRPDropsBelow$1.30OnHeavyVolume
#BitcoinDropsBelow$71K #SolanaDEXVolumeFalls82Pct
#XRPDropsBelow$1.30OnHeavyVolume
Bitcoin trades at $70,261 on June 2, breaking below the ascending channel that recovered price from the February lows, as spot ETF outflows accelerate into the new month and analysts increasingly point toward the February 2026 lows as the June destination.
BTC June 2026 Price Outlook: Second Channel Break and February Lows Back in Play
BTC built an ascending channel from the February lows near $60,000 through the May high near $83,000, then broke below the lower trendline. Price recovered briefly back inside the channel in late May before breaking down again heading into June. Two breaks of the same channel without recovery is not a retest, it is a failed structure.
All four EMAs sit above current price. The 20 EMA at $75,110, the 50 EMA at $75,759, the 100 EMA at $76,313, and the 200 EMA at $80,846 are all clustered in the same zone, with the SAR at $76,367 adding another ceiling in the same area. Reclaiming $75,110 on a weekly close is the minimum requirement before any bullish June case has merit. The horizontal support near $71,000 is thinning after repeated tests. Below that, the February lows near $60,000 are the next meaningful demand area with nothing clean in between.
BTC Key levels for June:
Resistance: $75,110 (20 EMA), $76,313 (100 EMA), $76,367 (SAR)
Support: $71,000 (horizontal), $65,000 (prior base), $60,000 (February lows)
Cowen and Schiff Agree on Direction for Different Reasons
Benjamin Cowen posted that BTC has now tagged $70,000 as he expected, with his base case calling for a small bounce of a few days to a week followed by a return to the February 2026 lows. He framed the call openly, stating if he is wrong about revisiting those lows he will publicly say so. His read sits inside the midterm year pattern he has flagged all year, where June historically marks the weak point before a summer bounce and Q4 resolution.
ETF Outflows Are Now a Trend Not a Single Event
Spot Bitcoin ETFs bled $483.76M on June 1 with BlackRock IBIT alone accounting for $440.29M. Fidelity FBTC added $37.29M and Ark and 21Shares ARKB contributed another $12.32M. Total net assets now sit at $91.16B, down from a peak above $109B in April.
May closed with more than $2.43B in cumulative net outflows from spot Bitcoin ETFs. The selling accelerated toward month-end with approximately $1.42B pulled over the final week alone, the third-largest weekly outflow on record. Outflows have printed red on eleven of the last thirteen trading days and the pace is getting worse, not stabilizing.
BTC Price Prediction for June 2026
Downside: Losing $71,000 on a weekly close accelerates the path toward the February lows near $60,000, which is Cowen’s stated destination after any near-term bounce resolves.
Upside: A bounce off $70,000 that reclaims $75,110 and holds the 20 EMA on a weekly close delays the February low retest and opens $78,000 to $80,000, but that requires ETF outflows to reverse after nearly two weeks of consecutive red.
#XRPDropsBelow$1.30OnHeavyVolume
#BitcoinDropsBelow$71K #SolanaDEXVolumeFalls82Pct
#XRPDropsBelow$1.30OnHeavyVolume
170

·
--
$BTC
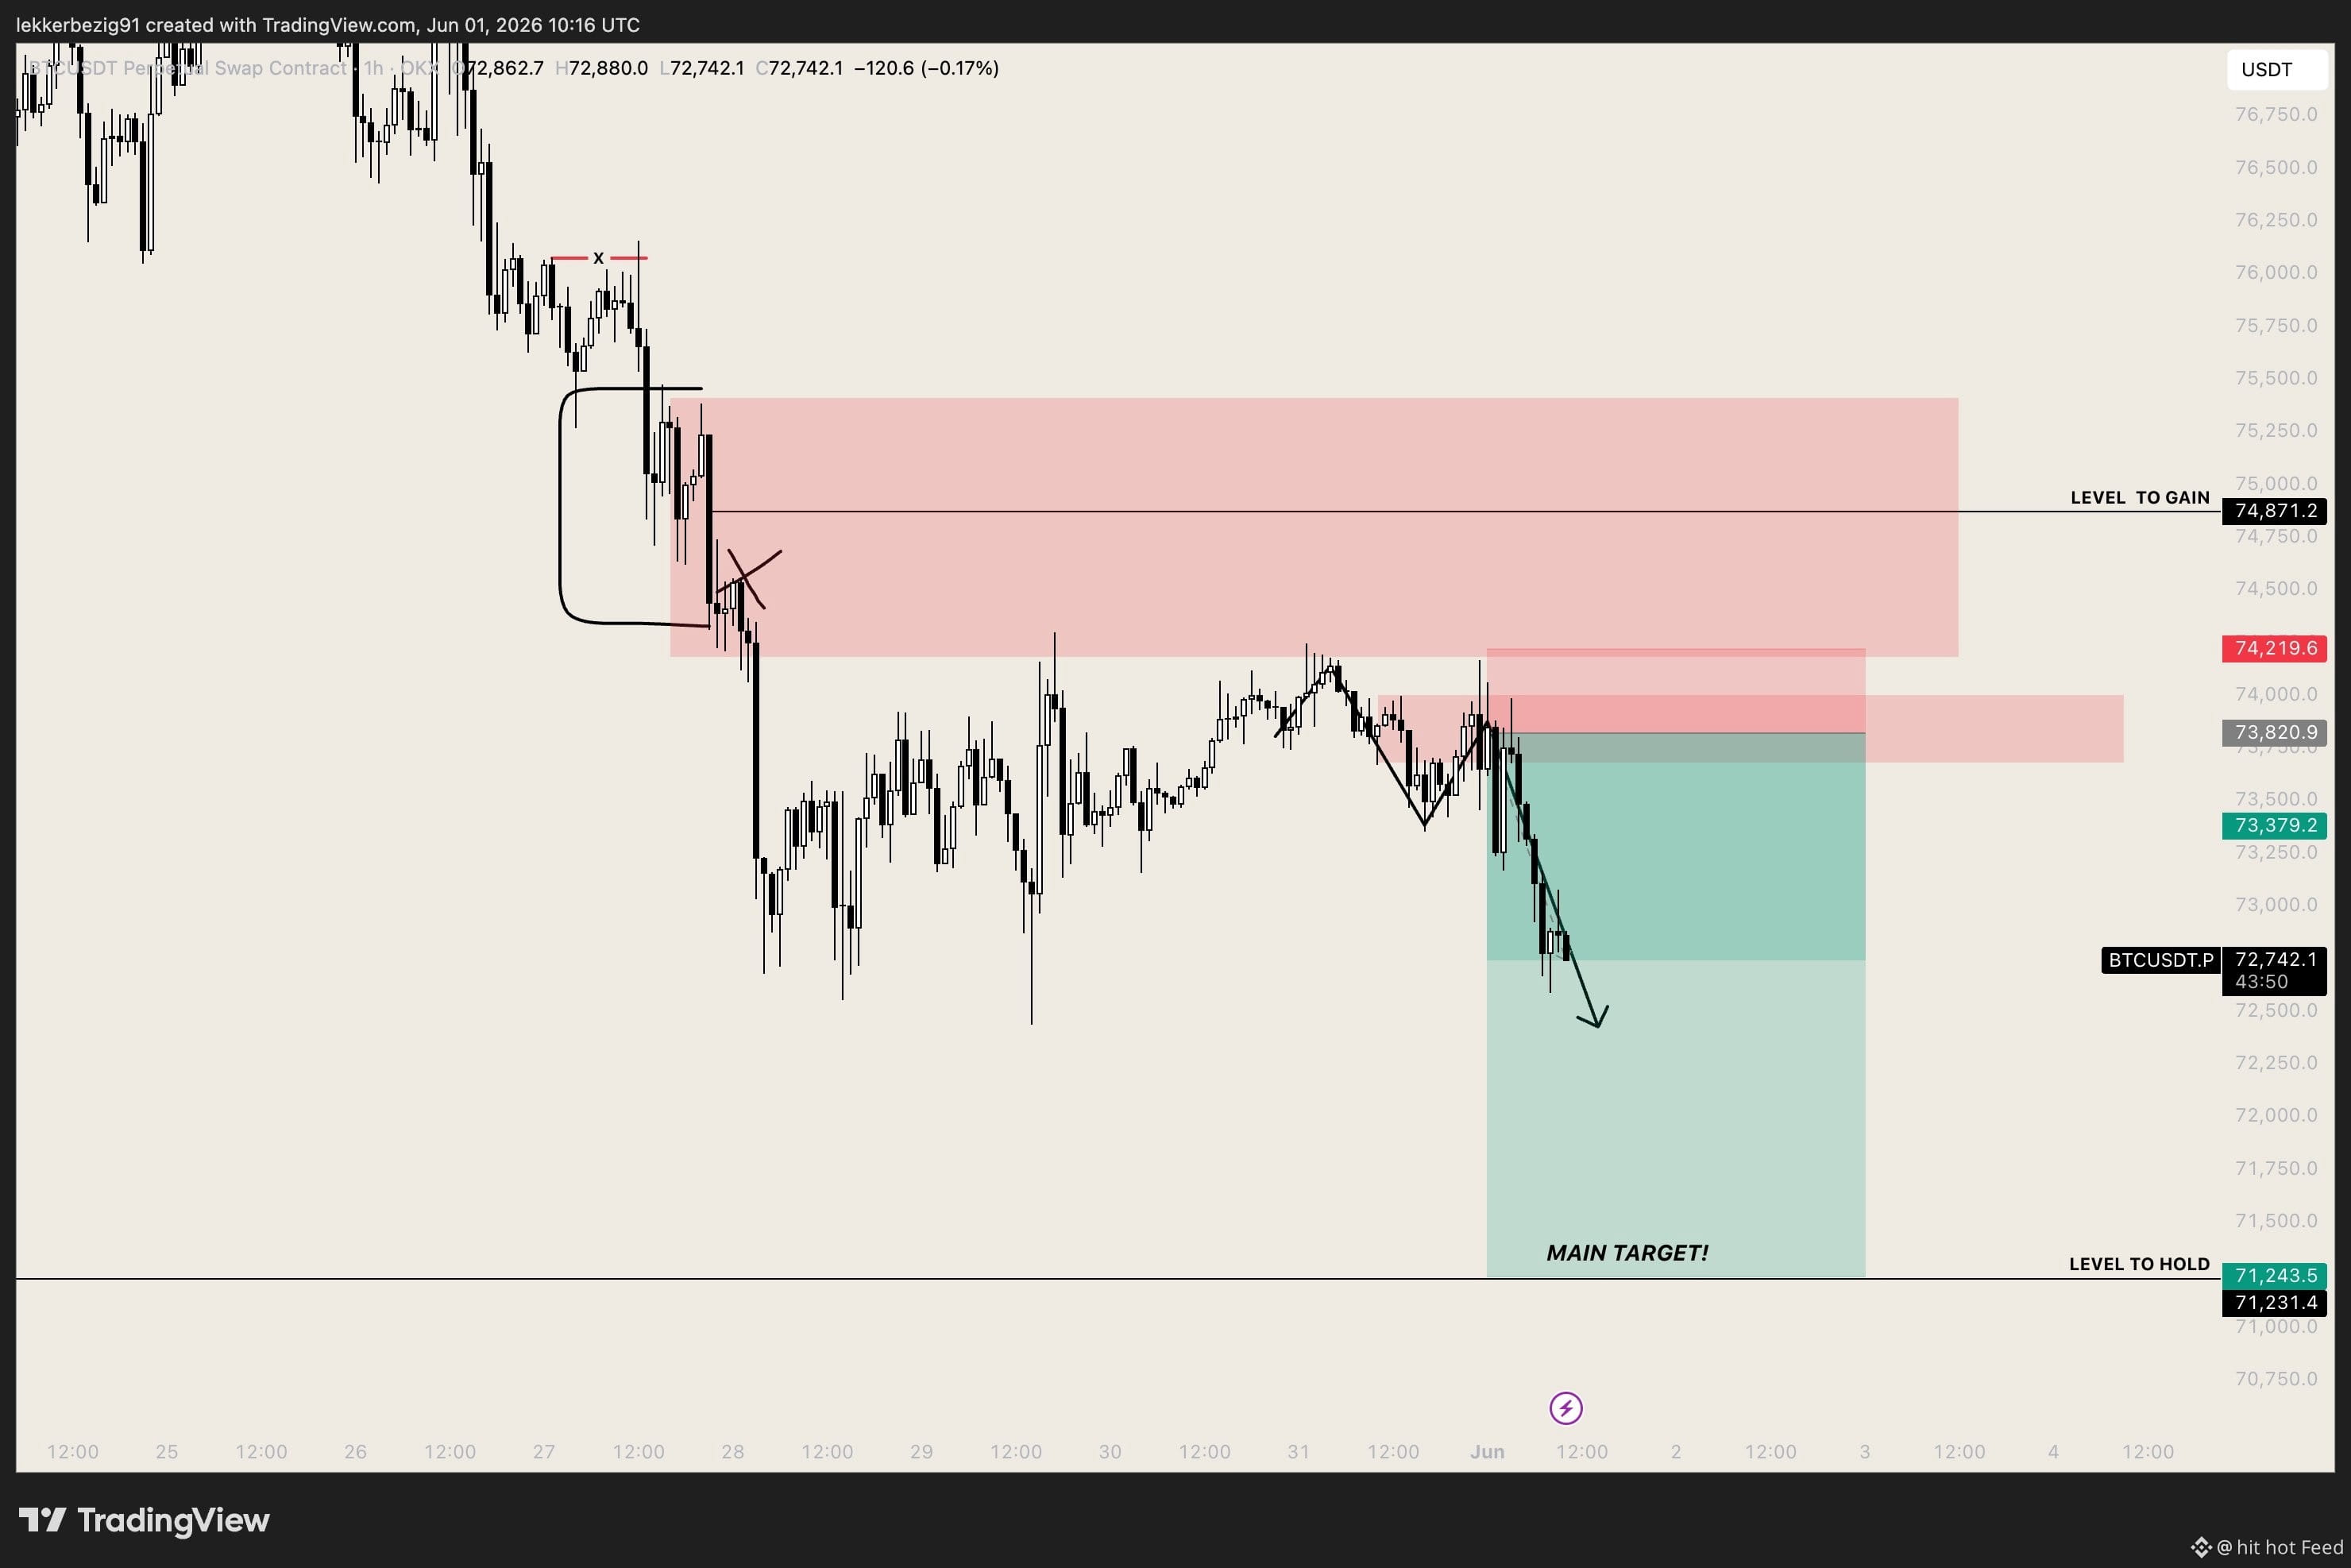
short filled and printing.
Textbook shift in structure after another rejection of our short POI.
Moved SL around BE and targeting lower prices this week. As said market structure remains bearish.
71k-68k main targets for now, lets see!
$BTC
short filled and printing.
Textbook shift in structure after another rejection of our short POI.
Moved SL around BE and targeting lower prices this week. As said market structure remains bearish.
71k-68k main targets for now, lets see!
short filled and printing.
Textbook shift in structure after another rejection of our short POI.
Moved SL around BE and targeting lower prices this week. As said market structure remains bearish.
71k-68k main targets for now, lets see!
5
7
1.2k


Статья
Bitcoin Drops Below $71K as Market Sentiment Turns BearishBitcoin Drops Below $71K as Market Sentiment Turns Bearish
The world’s largest cryptocurrency, Bitcoin, has fallen below $71,000, signaling renewed weakness in the digital asset market as selling pressure intensifies and investor sentiment shifts.
Breakdown Below Key Support
Bitcoin’s move below $71K represents a significant technical breakdown, as the level had previously acted as a short-term support zone. Once the price slipped below this threshold, selling accelerated due to stop-loss triggers and liquidation of leveraged positions.
Analysts note that such breakdowns often lead to increased volatility, as traders reassess market direction and adjust their positions.
What’s Driving the Decline?
Several macroeconomic and market-specific factors are contributing to Bitcoin’s drop. Rising expectations of tighter monetary policy and higher interest rates have reduced appetite for risk assets, including cryptocurrencies.
At the same time, uncertainty in global financial markets has pushed some investors toward safer assets, leading to capital outflows from crypto. Profit-taking after recent rallies has also contributed to the downward movement.
Impact on the Broader Market
Bitcoin’s decline has had a ripple effect across the crypto ecosystem. Major altcoins, including Ethereum and XRP, have also experienced losses, reflecting the strong correlation between Bitcoin and the wider market.
Trading volumes have increased during the downturn, suggesting that the move is backed by strong market participation rather than temporary fluctuations.
Technical Outlook
From a technical perspective, breaking below $71K opens the possibility of further downside if buyers fail to regain control. Traders are now closely watching the next support levels, which could determine whether the market stabilizes or continues to decline.
However, some analysts point out that corrections are a natural part of Bitcoin’s market cycles and often occur even during long-term uptrends.
Long-Term Perspective
Despite the short-term weakness, Bitcoin continues to be viewed as a key asset in the digital economy. Institutional adoption, growing regulatory clarity in some regions, and increasing integration into financial systems continue to support its long-term outlook.
Conclusion
Bitcoin’s drop below $71,000 highlights the ongoing volatility in cryptocurrency markets and the growing influence of macroeconomic factors on digital assets. As investors navigate uncertainty, the coming weeks will be critical in determining whether Bitcoin can recover or faces further downside pressure.
#BitcoinDropsBelow$71K #BitcoinDropsBelow$71000 #BitcoinForecast
{spot}(BTCUSDT)
{future}(BTCUSDT)
Bitcoin Drops Below $71K as Market Sentiment Turns Bearish
Bitcoin Drops Below $71K as Market Sentiment Turns Bearish
The world’s largest cryptocurrency, Bitcoin, has fallen below $71,000, signaling renewed weakness in the digital asset market as selling pressure intensifies and investor sentiment shifts.
Breakdown Below Key Support
Bitcoin’s move below $71K represents a significant technical breakdown, as the level had previously acted as a short-term support zone. Once the price slipped below this threshold, selling accelerated due to stop-loss triggers and liquidation of leveraged positions.
Analysts note that such breakdowns often lead to increased volatility, as traders reassess market direction and adjust their positions.
What’s Driving the Decline?
Several macroeconomic and market-specific factors are contributing to Bitcoin’s drop. Rising expectations of tighter monetary policy and higher interest rates have reduced appetite for risk assets, including cryptocurrencies.
At the same time, uncertainty in global financial markets has pushed some investors toward safer assets, leading to capital outflows from crypto. Profit-taking after recent rallies has also contributed to the downward movement.
Impact on the Broader Market
Bitcoin’s decline has had a ripple effect across the crypto ecosystem. Major altcoins, including Ethereum and XRP, have also experienced losses, reflecting the strong correlation between Bitcoin and the wider market.
Trading volumes have increased during the downturn, suggesting that the move is backed by strong market participation rather than temporary fluctuations.
Technical Outlook
From a technical perspective, breaking below $71K opens the possibility of further downside if buyers fail to regain control. Traders are now closely watching the next support levels, which could determine whether the market stabilizes or continues to decline.
However, some analysts point out that corrections are a natural part of Bitcoin’s market cycles and often occur even during long-term uptrends.
Long-Term Perspective
Despite the short-term weakness, Bitcoin continues to be viewed as a key asset in the digital economy. Institutional adoption, growing regulatory clarity in some regions, and increasing integration into financial systems continue to support its long-term outlook.
Conclusion
Bitcoin’s drop below $71,000 highlights the ongoing volatility in cryptocurrency markets and the growing influence of macroeconomic factors on digital assets. As investors navigate uncertainty, the coming weeks will be critical in determining whether Bitcoin can recover or faces further downside pressure.
#BitcoinDropsBelow$71K #BitcoinDropsBelow$71000 #BitcoinForecast
The world’s largest cryptocurrency, Bitcoin, has fallen below $71,000, signaling renewed weakness in the digital asset market as selling pressure intensifies and investor sentiment shifts.
Breakdown Below Key Support
Bitcoin’s move below $71K represents a significant technical breakdown, as the level had previously acted as a short-term support zone. Once the price slipped below this threshold, selling accelerated due to stop-loss triggers and liquidation of leveraged positions.
Analysts note that such breakdowns often lead to increased volatility, as traders reassess market direction and adjust their positions.
What’s Driving the Decline?
Several macroeconomic and market-specific factors are contributing to Bitcoin’s drop. Rising expectations of tighter monetary policy and higher interest rates have reduced appetite for risk assets, including cryptocurrencies.
At the same time, uncertainty in global financial markets has pushed some investors toward safer assets, leading to capital outflows from crypto. Profit-taking after recent rallies has also contributed to the downward movement.
Impact on the Broader Market
Bitcoin’s decline has had a ripple effect across the crypto ecosystem. Major altcoins, including Ethereum and XRP, have also experienced losses, reflecting the strong correlation between Bitcoin and the wider market.
Trading volumes have increased during the downturn, suggesting that the move is backed by strong market participation rather than temporary fluctuations.
Technical Outlook
From a technical perspective, breaking below $71K opens the possibility of further downside if buyers fail to regain control. Traders are now closely watching the next support levels, which could determine whether the market stabilizes or continues to decline.
However, some analysts point out that corrections are a natural part of Bitcoin’s market cycles and often occur even during long-term uptrends.
Long-Term Perspective
Despite the short-term weakness, Bitcoin continues to be viewed as a key asset in the digital economy. Institutional adoption, growing regulatory clarity in some regions, and increasing integration into financial systems continue to support its long-term outlook.
Conclusion
Bitcoin’s drop below $71,000 highlights the ongoing volatility in cryptocurrency markets and the growing influence of macroeconomic factors on digital assets. As investors navigate uncertainty, the coming weeks will be critical in determining whether Bitcoin can recover or faces further downside pressure.
#BitcoinDropsBelow$71K #BitcoinDropsBelow$71000 #BitcoinForecast
124
Войдите, чтобы посмотреть больше материала
Присоединяйтесь к пользователям криптовалют по всему миру на Binance Square
⚡️ Получайте новейшую и полезную информацию о криптоактивах.
💬 Нам доверяет крупнейшая в мире криптобиржа.
👍 Получите достоверные аналитические данные от верифицированных создателей контента.
Эл. почта/номер телефона
В тренде
1
#WhatWillDriveCryptoandStocks’NextRebound?
Просмотров: 0
0 обсуждают
2
#HuangExitNvidiaStrategyInFocus
Просмотров: 118,690
1,256 обсуждают
3
#AnthropicRejectsIPODelayValuationinQuestion
Просмотров: 727,565
5,457 обсуждают
4
#HedgeFundsCMEBitcoinNetShortsFall89%
Просмотров: 3,271
77 обсуждают
5
#BitMineReports$6.3BNetLossForFiscal2026
Просмотров: 15,013
154 обсуждают
6
#SoFiExpandsSoFiUSDStablecoinToPolygon
Просмотров: 3,662
76 обсуждают
7
#TetherGoldXAUTCompletesKPMGAudit
Просмотров: 4,398
81 обсуждают
8
#ChipStocksExtendLossesAfterNvidiaCEOChange
Просмотров: 45,512
507 обсуждают
9
#TrezorConfirmsMaliciousImplantsIn3Safe5Devices
Просмотров: 1,959
35 обсуждают
10
#TradFiForBeginners
Просмотров: 542,022
3,769 обсуждают