
#beta
beta
Просмотров: 495,845
922 обсуждают
Популярные
Новые

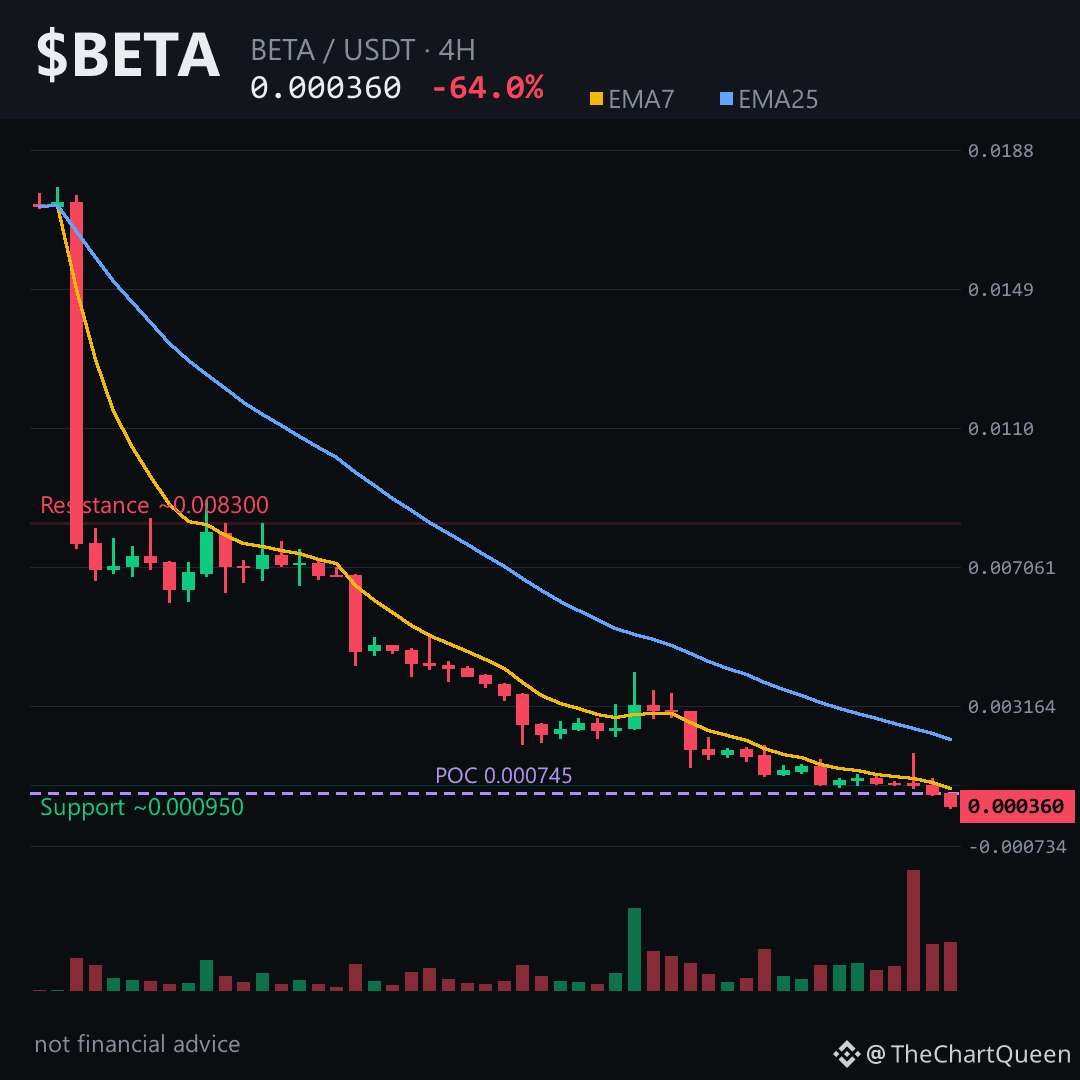
Imagine signing for a package, hearing the doorbell, and opening it to find the box is already empty. That is $BETA right now — a 64% daily drawdown that has left the chart looking less like a market and more like an elevator with the cables cut.
The scary part isn't the drop. It's the silence around it.
No funding rate to speak of, open interest flatlined. Conviction has evaporated. Not fear, not panic — just absence. The quietest kind of bearish.
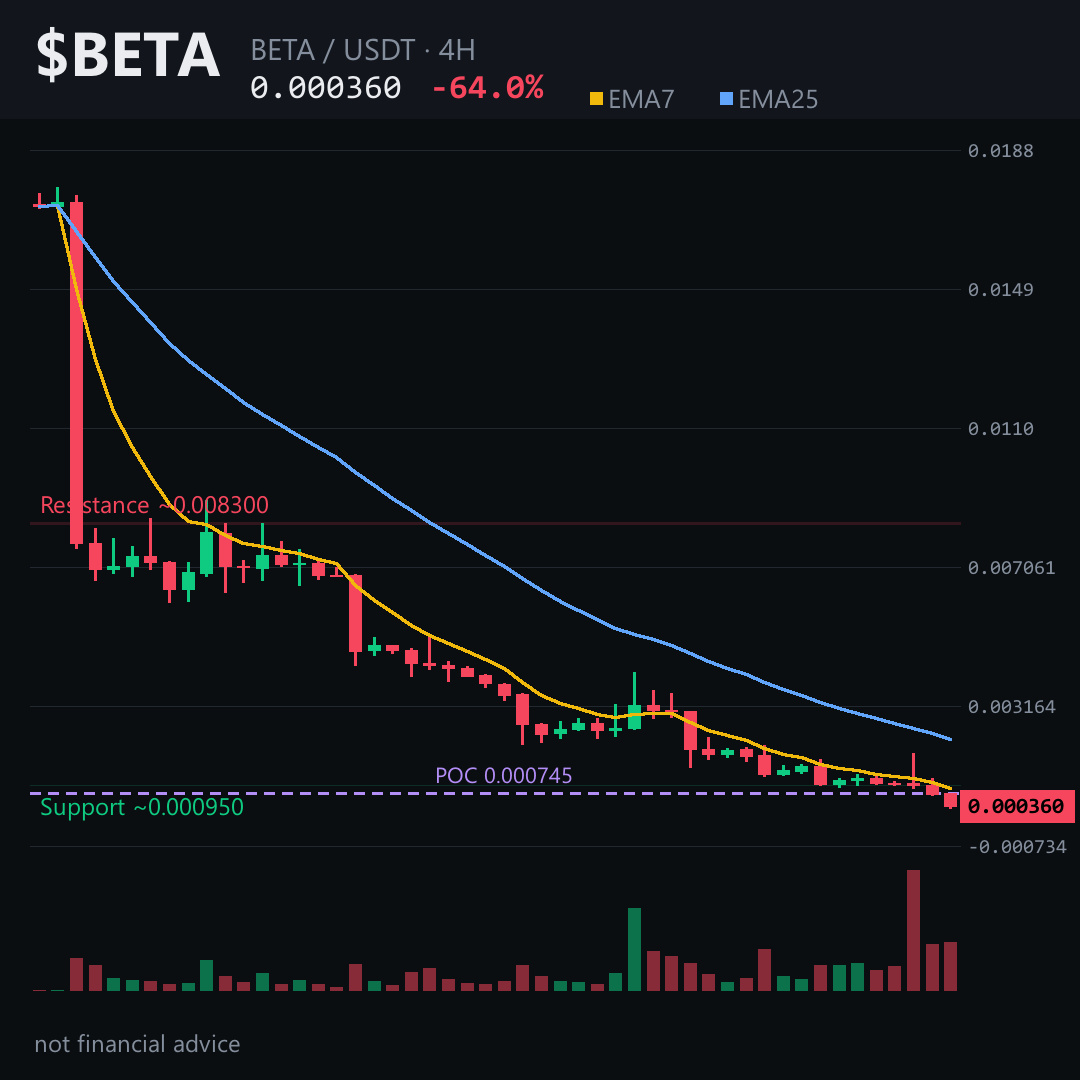
The 4-hour picture is the cleanest read. Price is hovering near 0.00036, and every small bounce got sold before it could mean anything. Moving averages stacked far above, pointing down like a verdict already delivered. Oversold? Sure — but oversold in a -64% candle is a description of damage, not a reason to buy.
The level that matters most is simple. If $BETA cannot reclaim the 0.00038 zone, the path of least resistance stays lower. A daily close above that would be the first honest sign the bleeding is pausing. Until then, the next natural magnet sits around 0.00033, with the 0.00031 low just beneath it as the real fear zone. Tap $BETA to see how cleanly price has respected these levels on the chart.
My read: the trend is not just down — it is hollow. No leverage, no interest, no fight. Bounces are suspicious until proven otherwise.
I'll update this read if the 0.00038 area gets reclaimed or rejected — follow so that lands on your feed. What level are you watching most on BETA right now 👇
⚠️ Not financial advice. DYOR.
#BETA #Crypto #BinanceSquare
Imagine signing for a package, hearing the doorbell, and opening it to find the box is already empty. That is $BETA right now — a 64% daily drawdown that has left the chart looking less like a market and more like an elevator with the cables cut.
The scary part isn't the drop. It's the silence around it.
No funding rate to speak of, open interest flatlined. Conviction has evaporated. Not fear, not panic — just absence. The quietest kind of bearish.
The 4-hour picture is the cleanest read. Price is hovering near 0.00036, and every small bounce got sold before it could mean anything. Moving averages stacked far above, pointing down like a verdict already delivered. Oversold? Sure — but oversold in a -64% candle is a description of damage, not a reason to buy.
The level that matters most is simple. If $BETA cannot reclaim the 0.00038 zone, the path of least resistance stays lower. A daily close above that would be the first honest sign the bleeding is pausing. Until then, the next natural magnet sits around 0.00033, with the 0.00031 low just beneath it as the real fear zone. Tap $BETA to see how cleanly price has respected these levels on the chart.
My read: the trend is not just down — it is hollow. No leverage, no interest, no fight. Bounces are suspicious until proven otherwise.
I'll update this read if the 0.00038 area gets reclaimed or rejected — follow so that lands on your feed. What level are you watching most on BETA right now 👇
⚠️ Not financial advice. DYOR.
#BETA #Crypto #BinanceSquare
The scary part isn't the drop. It's the silence around it.
No funding rate to speak of, open interest flatlined. Conviction has evaporated. Not fear, not panic — just absence. The quietest kind of bearish.
The 4-hour picture is the cleanest read. Price is hovering near 0.00036, and every small bounce got sold before it could mean anything. Moving averages stacked far above, pointing down like a verdict already delivered. Oversold? Sure — but oversold in a -64% candle is a description of damage, not a reason to buy.
The level that matters most is simple. If $BETA cannot reclaim the 0.00038 zone, the path of least resistance stays lower. A daily close above that would be the first honest sign the bleeding is pausing. Until then, the next natural magnet sits around 0.00033, with the 0.00031 low just beneath it as the real fear zone. Tap $BETA to see how cleanly price has respected these levels on the chart.
My read: the trend is not just down — it is hollow. No leverage, no interest, no fight. Bounces are suspicious until proven otherwise.
I'll update this read if the 0.00038 area gets reclaimed or rejected — follow so that lands on your feed. What level are you watching most on BETA right now 👇
⚠️ Not financial advice. DYOR.
#BETA #Crypto #BinanceSquare
1

·
--
sụt -64% trong 24h, liệu có phải là cơ hội?
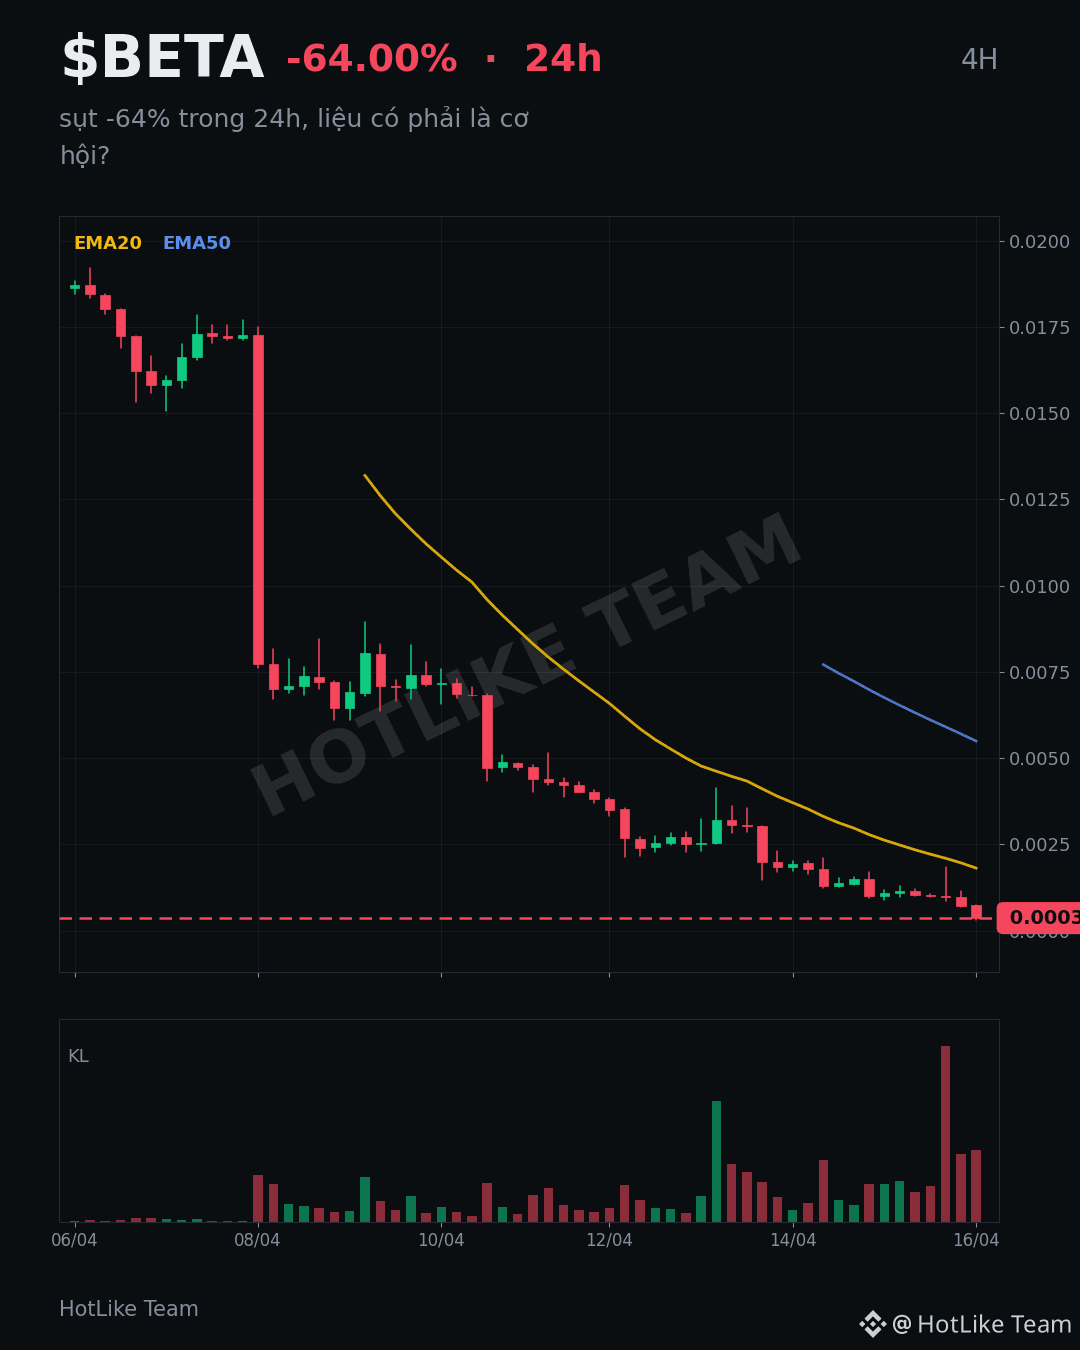
Sáng nay mở bảng giá giật mình thấy giảm mạnh tới -64.00% chỉ trong 24 giờ. 📉
Khối lượng giao dịch đạt 296,136 cũng cho thấy lực bán khủng khiếp. Mình tự hỏi liệu đây có phải là lúc thanh lý lệnh lớn hay có vấn đề gì sâu xa hơn. Cá nhân mình thấy, những cú sụt mạnh thế này thường đi kèm với nỗi sợ hãi tột độ của thị trường.
Liệu chúng ta có đang chứng kiến một đợt điều chỉnh hay là tín hiệu cho một sự thay đổi lớn hơn?
Thông tin tham khảo, không phải lời khuyên đầu tư. DYOR.
#BETA $BETA
sụt -64% trong 24h, liệu có phải là cơ hội?
Sáng nay mở bảng giá giật mình thấy giảm mạnh tới -64.00% chỉ trong 24 giờ. 📉
Khối lượng giao dịch đạt 296,136 cũng cho thấy lực bán khủng khiếp. Mình tự hỏi liệu đây có phải là lúc thanh lý lệnh lớn hay có vấn đề gì sâu xa hơn. Cá nhân mình thấy, những cú sụt mạnh thế này thường đi kèm với nỗi sợ hãi tột độ của thị trường.
Liệu chúng ta có đang chứng kiến một đợt điều chỉnh hay là tín hiệu cho một sự thay đổi lớn hơn?
Thông tin tham khảo, không phải lời khuyên đầu tư. DYOR.
#BETA $BETA
Sáng nay mở bảng giá giật mình thấy giảm mạnh tới -64.00% chỉ trong 24 giờ. 📉
Khối lượng giao dịch đạt 296,136 cũng cho thấy lực bán khủng khiếp. Mình tự hỏi liệu đây có phải là lúc thanh lý lệnh lớn hay có vấn đề gì sâu xa hơn. Cá nhân mình thấy, những cú sụt mạnh thế này thường đi kèm với nỗi sợ hãi tột độ của thị trường.
Liệu chúng ta có đang chứng kiến một đợt điều chỉnh hay là tín hiệu cho một sự thay đổi lớn hơn?
Thông tin tham khảo, không phải lời khuyên đầu tư. DYOR.
#BETA $BETA
3
-64% in 24 hours. That’s not a dip — that’s a structural break.
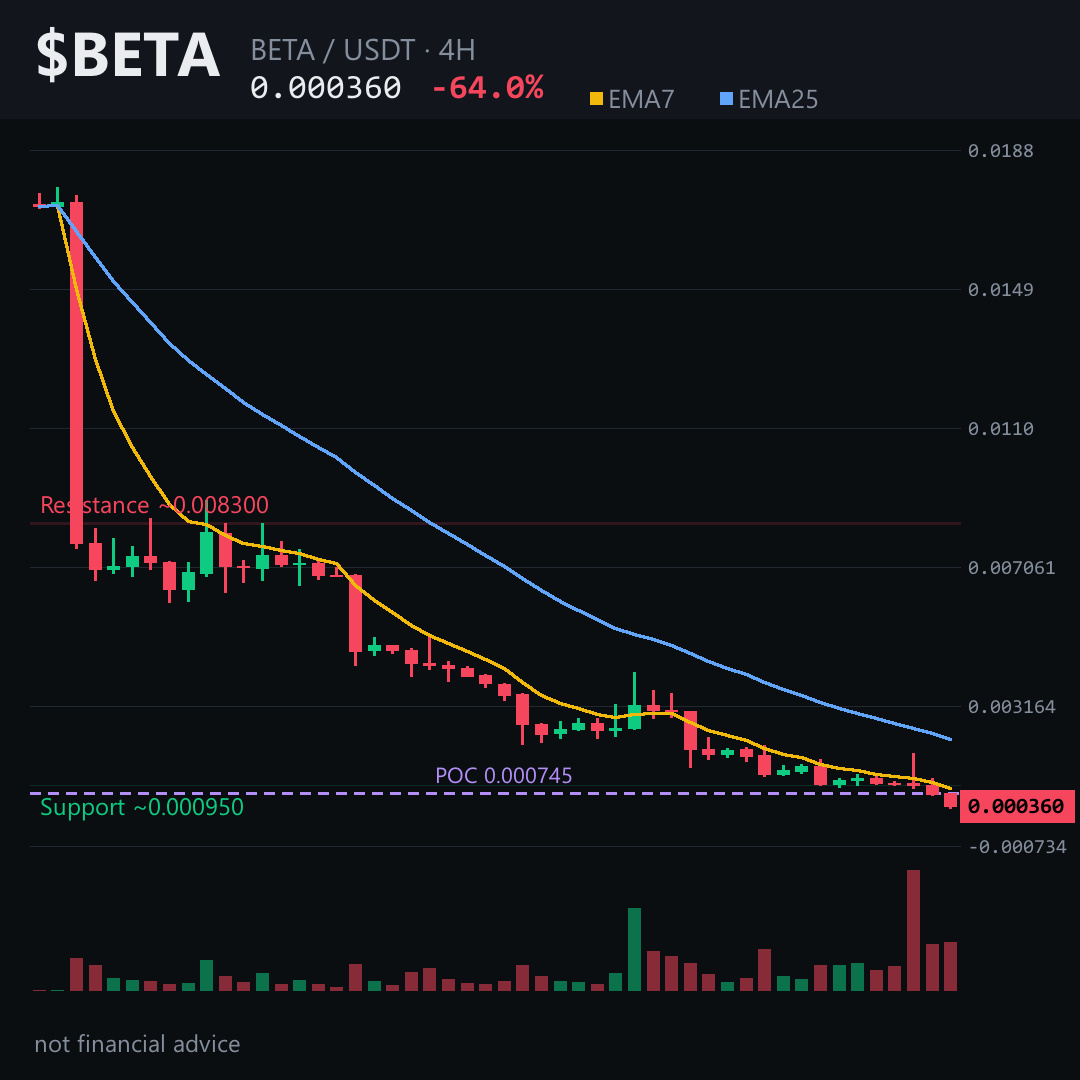
$BETA is not just bleeding; every timeframe agrees on one story: sellers are in full control. The 4H chart tells it best, so let’s zoom there.
The most honest signal is RSI at 17.5 — deeply oversold, but oversold in a downtrend often means velocity, not reversal. Price is trading far below both key EMAs, and volume profile shows no meaningful support until much lower.
The levels that matter on the 4H: the current pivot sits near 0.00036, with invalidation just above at 0.00038. A 4H close back above that zone would be the first crack in the bearish structure. Until then, the objective zone near 0.00033 remains the path of least resistance.
My read: this is a falling knife with no stabilization signal yet. The real risk is trying to catch it before the first higher low forms.
Tap $BETA to pull up the chart and read these levels yourself — the candle structure tells the story better than any narrative.
The 0.00038 area is the line I’m watching. If it flips, the conversation changes. If it holds as resistance, this downtrend likely extends. Follow for the updated read when that zone gets tested.
What level on $BETA are you watching most closely 👇
⚠️ Not financial advice. DYOR.
#BETA #Crypto #BinanceSquare
-64% in 24 hours. That’s not a dip — that’s a structural break.
$BETA is not just bleeding; every timeframe agrees on one story: sellers are in full control. The 4H chart tells it best, so let’s zoom there.
The most honest signal is RSI at 17.5 — deeply oversold, but oversold in a downtrend often means velocity, not reversal. Price is trading far below both key EMAs, and volume profile shows no meaningful support until much lower.
The levels that matter on the 4H: the current pivot sits near 0.00036, with invalidation just above at 0.00038. A 4H close back above that zone would be the first crack in the bearish structure. Until then, the objective zone near 0.00033 remains the path of least resistance.
My read: this is a falling knife with no stabilization signal yet. The real risk is trying to catch it before the first higher low forms.
Tap $BETA to pull up the chart and read these levels yourself — the candle structure tells the story better than any narrative.
The 0.00038 area is the line I’m watching. If it flips, the conversation changes. If it holds as resistance, this downtrend likely extends. Follow for the updated read when that zone gets tested.
What level on $BETA are you watching most closely 👇
⚠️ Not financial advice. DYOR.
#BETA #Crypto #BinanceSquare
$BETA is not just bleeding; every timeframe agrees on one story: sellers are in full control. The 4H chart tells it best, so let’s zoom there.
The most honest signal is RSI at 17.5 — deeply oversold, but oversold in a downtrend often means velocity, not reversal. Price is trading far below both key EMAs, and volume profile shows no meaningful support until much lower.
The levels that matter on the 4H: the current pivot sits near 0.00036, with invalidation just above at 0.00038. A 4H close back above that zone would be the first crack in the bearish structure. Until then, the objective zone near 0.00033 remains the path of least resistance.
My read: this is a falling knife with no stabilization signal yet. The real risk is trying to catch it before the first higher low forms.
Tap $BETA to pull up the chart and read these levels yourself — the candle structure tells the story better than any narrative.
The 0.00038 area is the line I’m watching. If it flips, the conversation changes. If it holds as resistance, this downtrend likely extends. Follow for the updated read when that zone gets tested.
What level on $BETA are you watching most closely 👇
⚠️ Not financial advice. DYOR.
#BETA #Crypto #BinanceSquare
What happens when a coin falls 64% in a day — and then its RSI drops to 15?
That’s the question $BETA is asking right now. And the answer isn’t as simple as “it’s dead.”
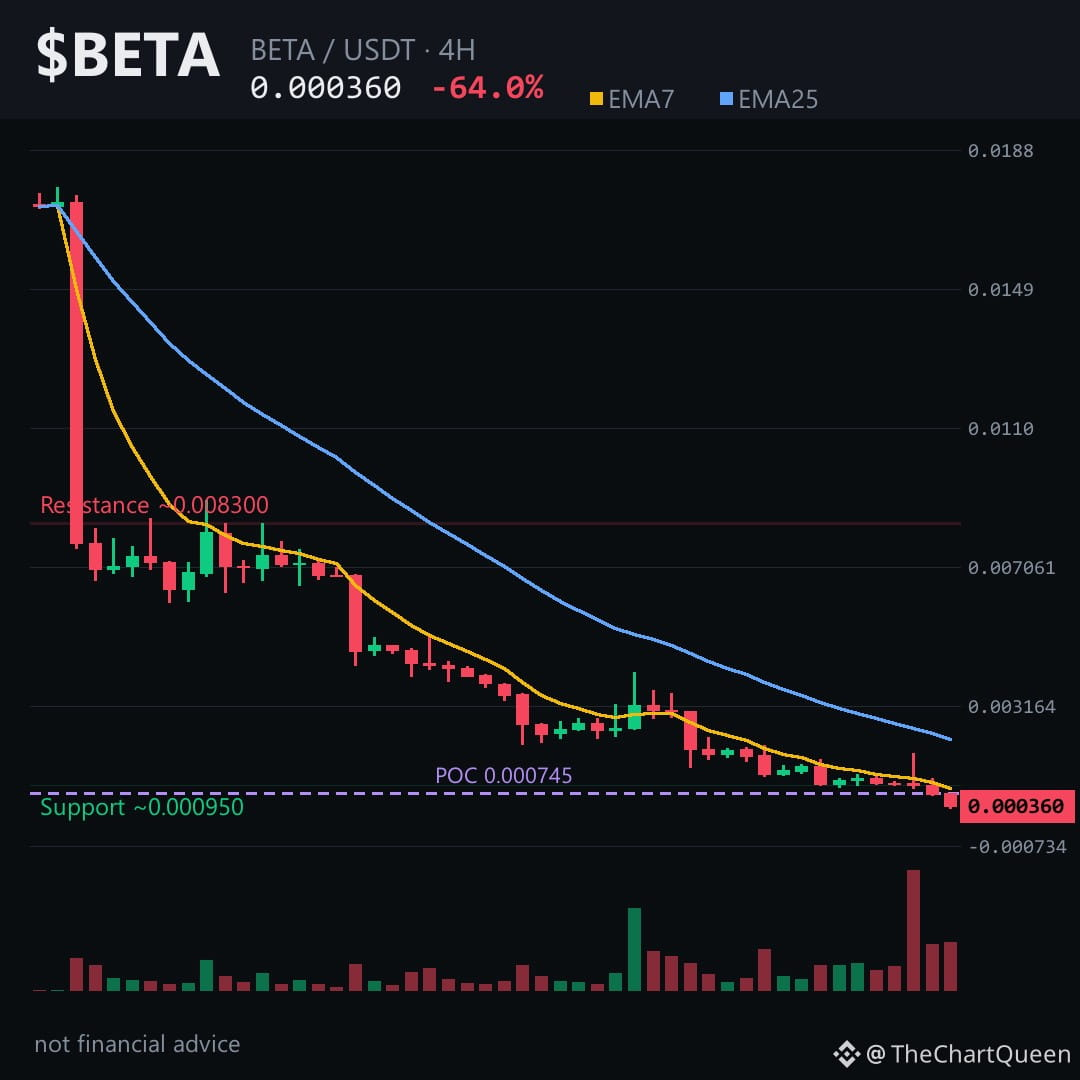
Price has been stair-stepping lower for two days straight. Eight red candles out of twelve. The last one was brutal — a 51% wipe in a single 4H close. That’s not normal selling. That’s liquidation-style capitulation.
RSI is sitting near 15 on both the 4H and daily charts. Below 30 is oversold. Below 20 is extreme. At 15, the rubber band is stretched about as far as it goes.
But here’s the trap: oversold doesn’t mean “about to bounce.” In a downtrend this violent, oversold can stay oversold for days.
The structure still leans bearish. There’s an unfilled fair value gap roughly between 0.00230 and 0.00286 — a price vacuum created by panic selling. Markets often drift back to fill those gaps eventually, but not until selling pressure exhausts itself.
The level that matters most: the 0.00038 area. If $BETA can’t reclaim that zone, the path of least resistance stays down toward 0.00033 — and below that, the 0.00031 low is the only real floor left.
My read: this is a falling knife, not a dip to buy. The bounce potential is real because RSI is so stretched, but the trend is still controlled by sellers. The risk isn’t missing the bottom — it’s catching a blade that hasn’t landed yet.
Tap $BETA to pull up the chart and see how far price is from that 0.00038 rejection zone.
Follow me for the follow-up — if the 0.00031 low breaks, the conversation changes completely. What level are you watching on this one 👇
⚠️ Not financial advice. DYOR.
#BETA #Crypto #Altcoins #BinanceSquare
What happens when a coin falls 64% in a day — and then its RSI drops to 15?
That’s the question $BETA is asking right now. And the answer isn’t as simple as “it’s dead.”
Price has been stair-stepping lower for two days straight. Eight red candles out of twelve. The last one was brutal — a 51% wipe in a single 4H close. That’s not normal selling. That’s liquidation-style capitulation.
RSI is sitting near 15 on both the 4H and daily charts. Below 30 is oversold. Below 20 is extreme. At 15, the rubber band is stretched about as far as it goes.
But here’s the trap: oversold doesn’t mean “about to bounce.” In a downtrend this violent, oversold can stay oversold for days.
The structure still leans bearish. There’s an unfilled fair value gap roughly between 0.00230 and 0.00286 — a price vacuum created by panic selling. Markets often drift back to fill those gaps eventually, but not until selling pressure exhausts itself.
The level that matters most: the 0.00038 area. If $BETA can’t reclaim that zone, the path of least resistance stays down toward 0.00033 — and below that, the 0.00031 low is the only real floor left.
My read: this is a falling knife, not a dip to buy. The bounce potential is real because RSI is so stretched, but the trend is still controlled by sellers. The risk isn’t missing the bottom — it’s catching a blade that hasn’t landed yet.
Tap $BETA to pull up the chart and see how far price is from that 0.00038 rejection zone.
Follow me for the follow-up — if the 0.00031 low breaks, the conversation changes completely. What level are you watching on this one 👇
⚠️ Not financial advice. DYOR.
#BETA #Crypto #Altcoins #BinanceSquare
That’s the question $BETA is asking right now. And the answer isn’t as simple as “it’s dead.”
Price has been stair-stepping lower for two days straight. Eight red candles out of twelve. The last one was brutal — a 51% wipe in a single 4H close. That’s not normal selling. That’s liquidation-style capitulation.
RSI is sitting near 15 on both the 4H and daily charts. Below 30 is oversold. Below 20 is extreme. At 15, the rubber band is stretched about as far as it goes.
But here’s the trap: oversold doesn’t mean “about to bounce.” In a downtrend this violent, oversold can stay oversold for days.
The structure still leans bearish. There’s an unfilled fair value gap roughly between 0.00230 and 0.00286 — a price vacuum created by panic selling. Markets often drift back to fill those gaps eventually, but not until selling pressure exhausts itself.
The level that matters most: the 0.00038 area. If $BETA can’t reclaim that zone, the path of least resistance stays down toward 0.00033 — and below that, the 0.00031 low is the only real floor left.
My read: this is a falling knife, not a dip to buy. The bounce potential is real because RSI is so stretched, but the trend is still controlled by sellers. The risk isn’t missing the bottom — it’s catching a blade that hasn’t landed yet.
Tap $BETA to pull up the chart and see how far price is from that 0.00038 rejection zone.
Follow me for the follow-up — if the 0.00031 low breaks, the conversation changes completely. What level are you watching on this one 👇
⚠️ Not financial advice. DYOR.
#BETA #Crypto #Altcoins #BinanceSquare
3

·
--
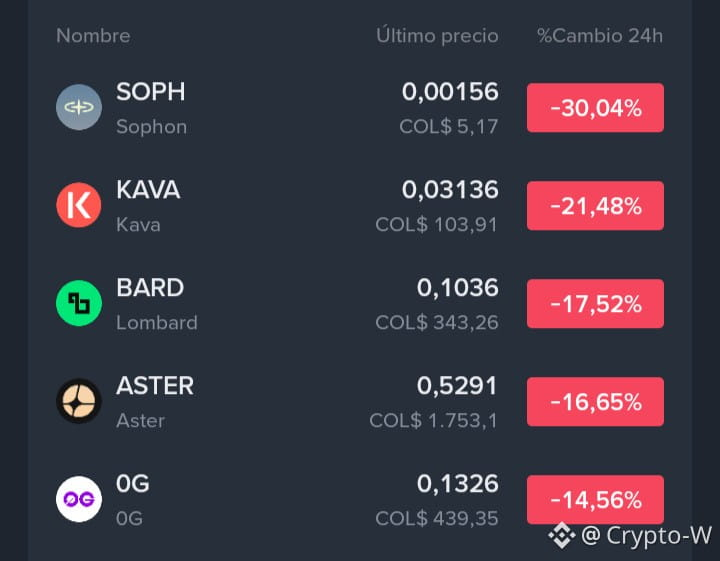
🚨🔴 ¡FUERTES CAÍDAS EN BINANCE! ESTAS CRIPTOMONEDAS ESTÁN SUFRIENDO.
📉 TOP 3 DE LAS MAYORES CAÍDAS:
🥇 $BETA: -64,00 % 💥
🥈 $VIB: -63,26 % 📉
🥉 $SOPH: -27,51 % 🔻
⚠️ El mercado está dejando movimientos extremos y estas criptomonedas muestran una fuerte presión vendedora.
🎯 ¿Oportunidad de recuperación o señal para mantenerse alejados?
Recuerda: una criptomoneda que cae mucho no necesariamente está barata. Antes de comprar, analiza volumen, liquidez y tendencia.
👇 ¿Cuál crees que podría recuperarse primero?
#Binance #beta #vib #SOPH
🚨🔴 ¡FUERTES CAÍDAS EN BINANCE! ESTAS CRIPTOMONEDAS ESTÁN SUFRIENDO.
📉 TOP 3 DE LAS MAYORES CAÍDAS:
🥇 $BETA: -64,00 % 💥
🥈 $VIB: -63,26 % 📉
🥉 $SOPH: -27,51 % 🔻
⚠️ El mercado está dejando movimientos extremos y estas criptomonedas muestran una fuerte presión vendedora.
🎯 ¿Oportunidad de recuperación o señal para mantenerse alejados?
Recuerda: una criptomoneda que cae mucho no necesariamente está barata. Antes de comprar, analiza volumen, liquidez y tendencia.
👇 ¿Cuál crees que podría recuperarse primero?
#Binance #beta #vib #SOPH
📉 TOP 3 DE LAS MAYORES CAÍDAS:
🥇 $BETA: -64,00 % 💥
🥈 $VIB: -63,26 % 📉
🥉 $SOPH: -27,51 % 🔻
⚠️ El mercado está dejando movimientos extremos y estas criptomonedas muestran una fuerte presión vendedora.
🎯 ¿Oportunidad de recuperación o señal para mantenerse alejados?
Recuerda: una criptomoneda que cae mucho no necesariamente está barata. Antes de comprar, analiza volumen, liquidez y tendencia.
👇 ¿Cuál crees que podría recuperarse primero?
#Binance #beta #vib #SOPH
22
Imagine watching a building get demolished — floor by floor, then the whole frame gives way at once. That’s $BETA right now.
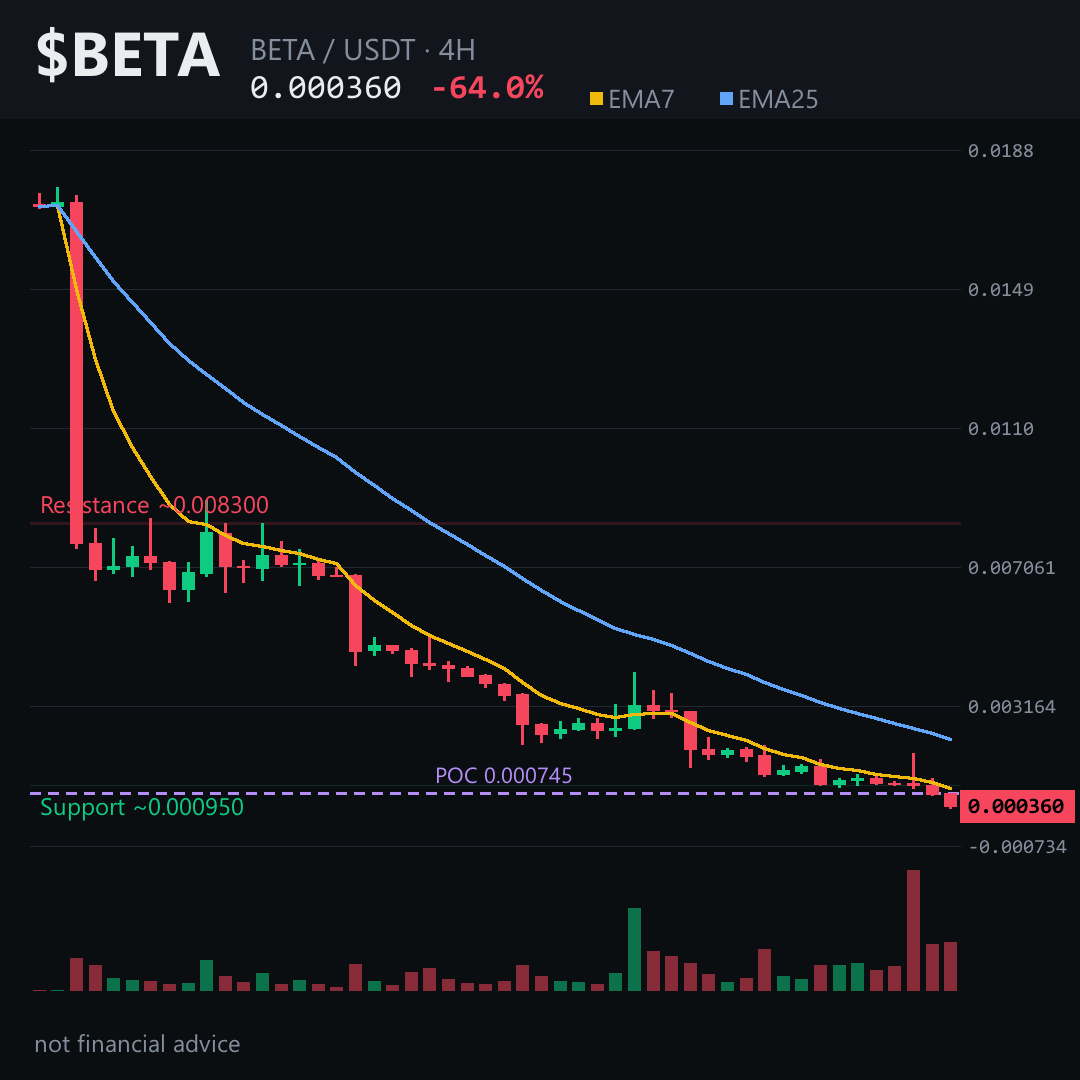
The daily chart tells the brutal truth: price traded near 0.002 just 48 hours ago, now it’s around 0.00036. That’s a collapse, not a dip. The last 4H candle printed a 51% single-candle wipeout.
Here’s the part worth leaning into: the bearish fair value gap between roughly 0.00230 and 0.00286 is a long way above current price. If price ever attempts a recovery, that’s likely where the next heavy rejection lives. But the more immediate story is the level right around 0.00037–0.00038. As long as price stays beneath it, the path of least resistance still points down toward the 0.00032–0.00033 zone. A 4H close back above 0.00038 would be the first real sign this down-leg is exhausted.
My read: this is a falling knife with almost no visible support until price finds a base near the 0.00031 area — and even that’s more of a reference than a floor.
If you’re watching $BETA, pull up the 4H and trace that gap — it’s the only clean structure left on the chart.
I’ll keep an eye on whether that 0.00037–0.00038 zone holds as resistance or finally gives way — follow along if you want the update when it resolves.
What level are you watching most closely on $BETA right now? 👇
⚠️ Not financial advice. DYOR.
#BETA #Crypto #BinanceSquare
Imagine watching a building get demolished — floor by floor, then the whole frame gives way at once. That’s $BETA right now.
The daily chart tells the brutal truth: price traded near 0.002 just 48 hours ago, now it’s around 0.00036. That’s a collapse, not a dip. The last 4H candle printed a 51% single-candle wipeout.
Here’s the part worth leaning into: the bearish fair value gap between roughly 0.00230 and 0.00286 is a long way above current price. If price ever attempts a recovery, that’s likely where the next heavy rejection lives. But the more immediate story is the level right around 0.00037–0.00038. As long as price stays beneath it, the path of least resistance still points down toward the 0.00032–0.00033 zone. A 4H close back above 0.00038 would be the first real sign this down-leg is exhausted.
My read: this is a falling knife with almost no visible support until price finds a base near the 0.00031 area — and even that’s more of a reference than a floor.
If you’re watching $BETA, pull up the 4H and trace that gap — it’s the only clean structure left on the chart.
I’ll keep an eye on whether that 0.00037–0.00038 zone holds as resistance or finally gives way — follow along if you want the update when it resolves.
What level are you watching most closely on $BETA right now? 👇
⚠️ Not financial advice. DYOR.
#BETA #Crypto #BinanceSquare
The daily chart tells the brutal truth: price traded near 0.002 just 48 hours ago, now it’s around 0.00036. That’s a collapse, not a dip. The last 4H candle printed a 51% single-candle wipeout.
Here’s the part worth leaning into: the bearish fair value gap between roughly 0.00230 and 0.00286 is a long way above current price. If price ever attempts a recovery, that’s likely where the next heavy rejection lives. But the more immediate story is the level right around 0.00037–0.00038. As long as price stays beneath it, the path of least resistance still points down toward the 0.00032–0.00033 zone. A 4H close back above 0.00038 would be the first real sign this down-leg is exhausted.
My read: this is a falling knife with almost no visible support until price finds a base near the 0.00031 area — and even that’s more of a reference than a floor.
If you’re watching $BETA, pull up the 4H and trace that gap — it’s the only clean structure left on the chart.
I’ll keep an eye on whether that 0.00037–0.00038 zone holds as resistance or finally gives way — follow along if you want the update when it resolves.
What level are you watching most closely on $BETA right now? 👇
⚠️ Not financial advice. DYOR.
#BETA #Crypto #BinanceSquare
7

·
--
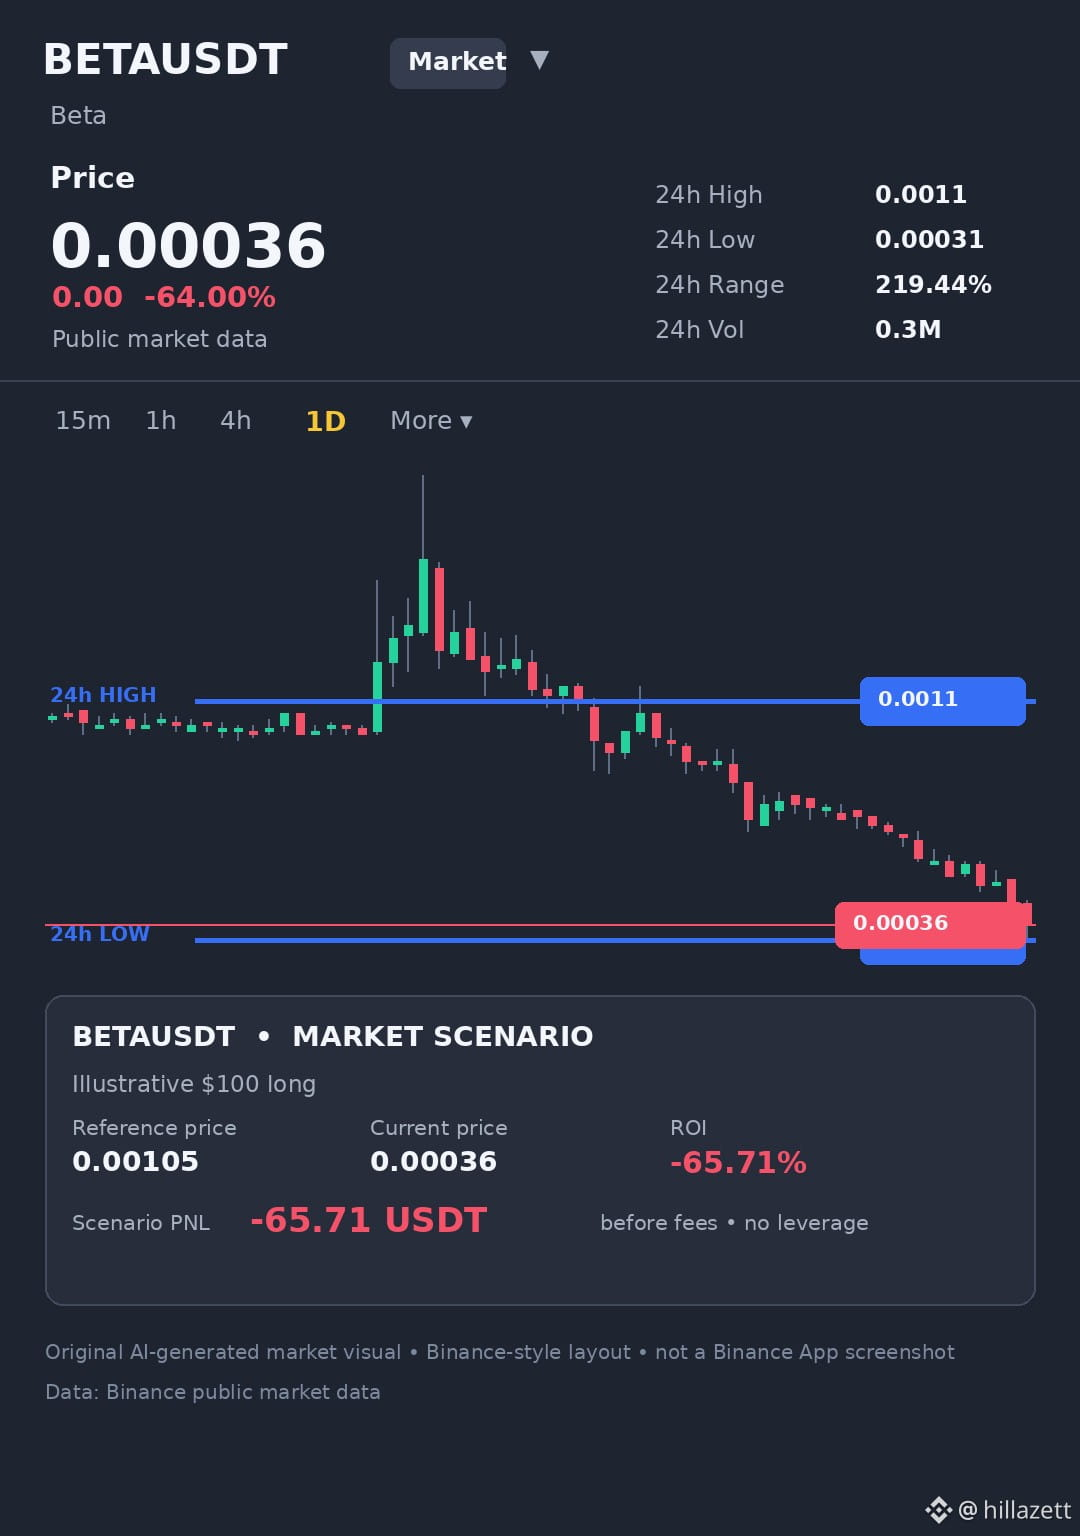
A steep drop like $BETA falling 64.00% to 0.00036 is a great reminder of how drawdown math works.
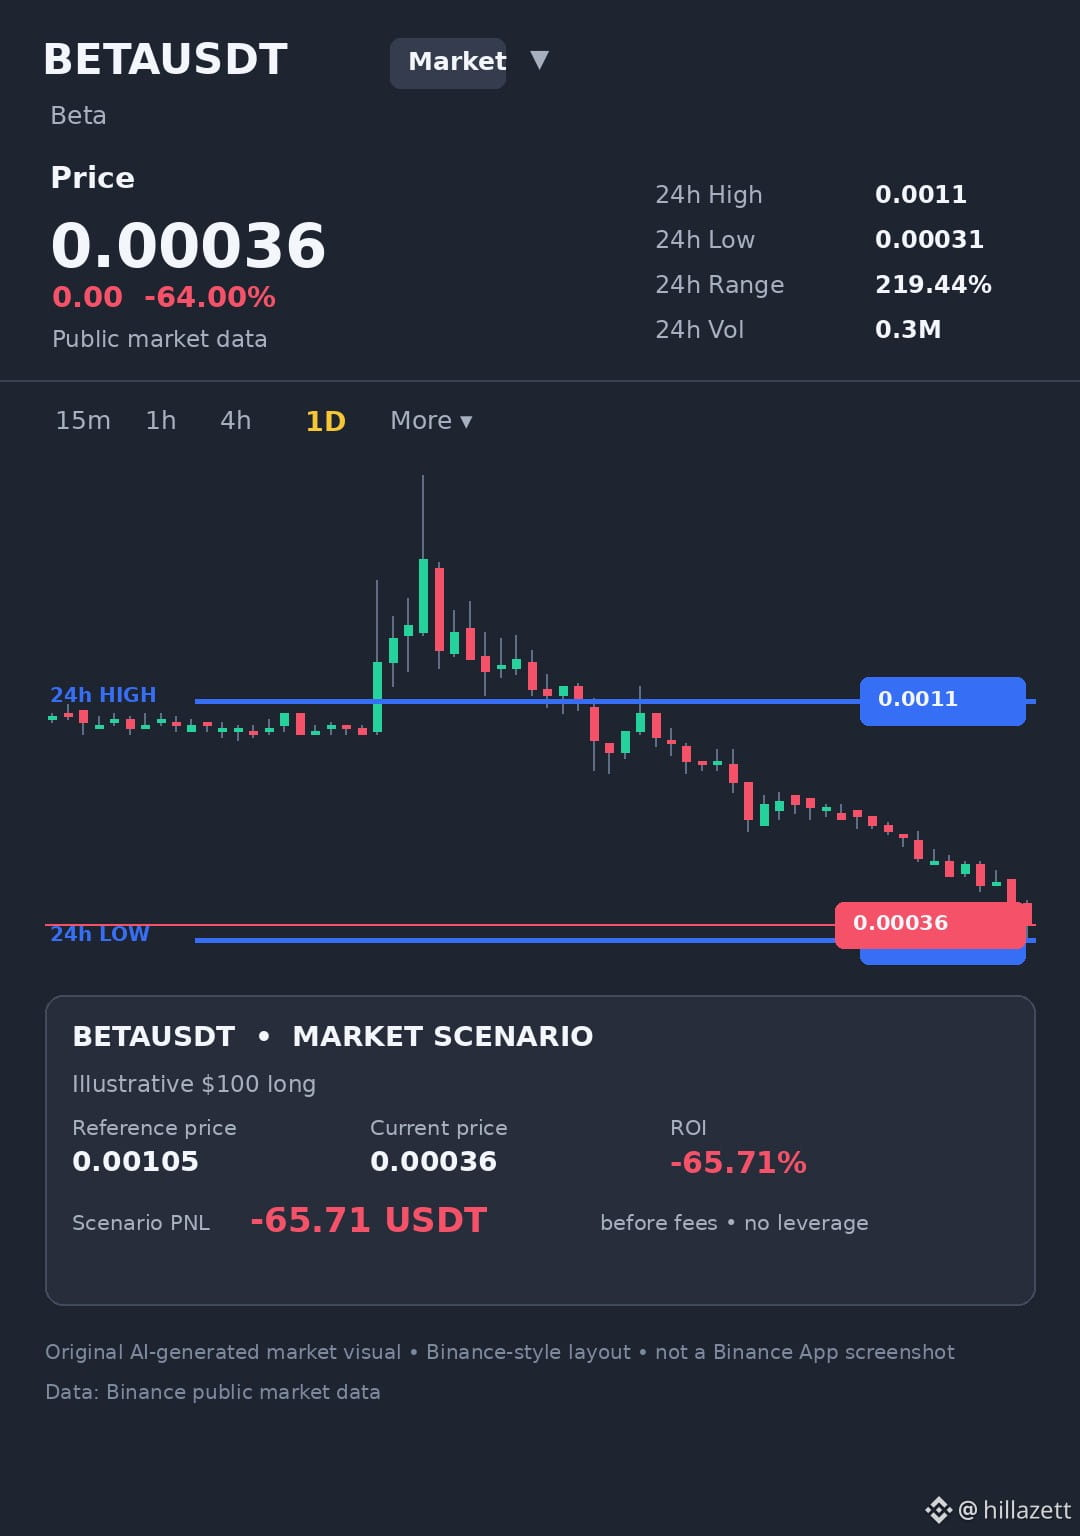
With a massive 219.44% intraday range between 0.0011 and 0.00031 on $296,136 volume, price drops much faster than it rebuilds. A heavy percentage drop always requires a substantially larger percentage gain just to return to previous highs.
How do you protect capital during extreme volatility? #BETA #CryptoTrading
A steep drop like $BETA falling 64.00% to 0.00036 is a great reminder of how drawdown math works.
With a massive 219.44% intraday range between 0.0011 and 0.00031 on $296,136 volume, price drops much faster than it rebuilds. A heavy percentage drop always requires a substantially larger percentage gain just to return to previous highs.
How do you protect capital during extreme volatility? #BETA #CryptoTrading
With a massive 219.44% intraday range between 0.0011 and 0.00031 on $296,136 volume, price drops much faster than it rebuilds. A heavy percentage drop always requires a substantially larger percentage gain just to return to previous highs.
How do you protect capital during extreme volatility? #BETA #CryptoTrading
75
The 4‑hour candle just slipped under the 0.00036 mark, and the next 30 minutes will decide if $BETA can hold the floor.
Read the setup below 👇
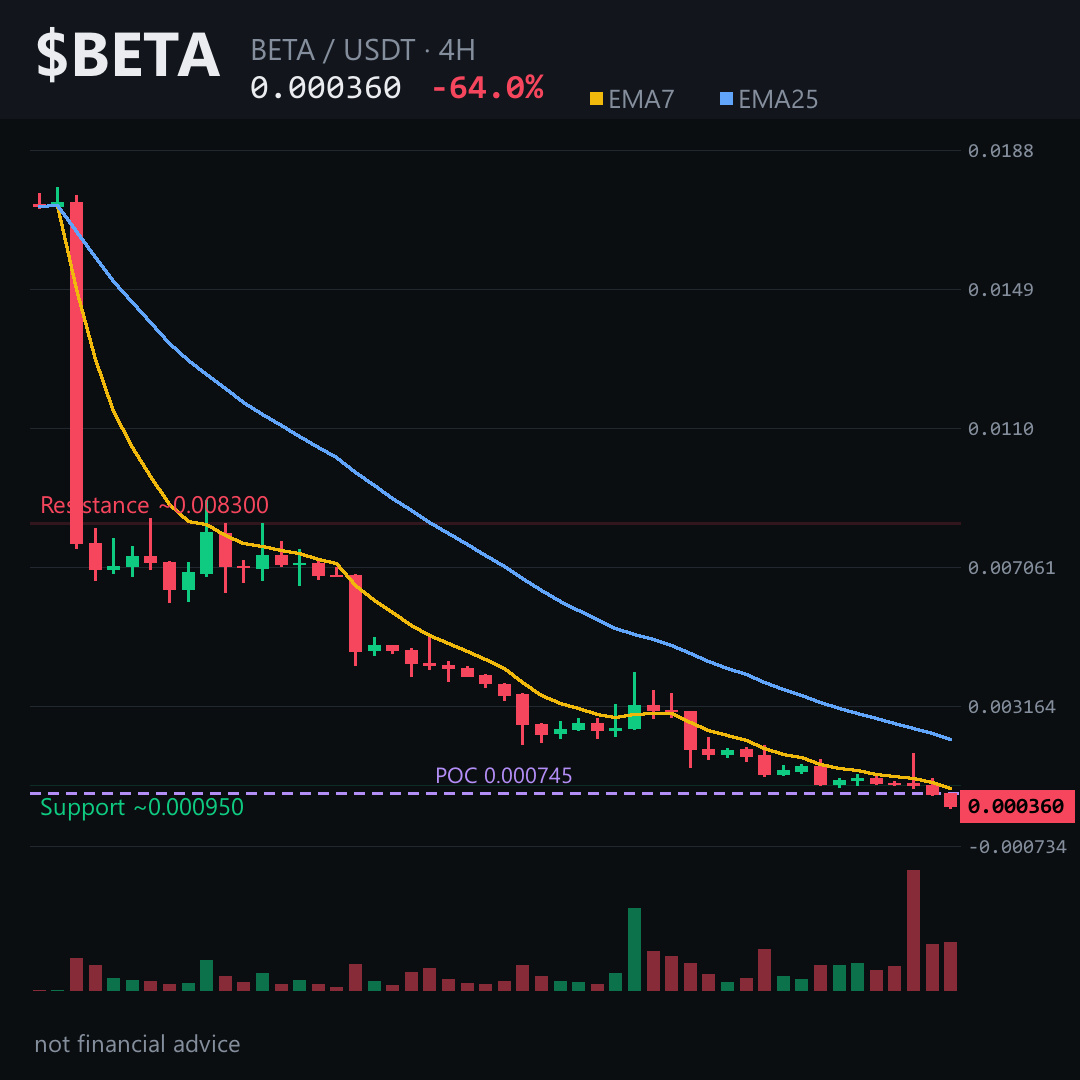
Price is screaming bearish – RSI stuck in the single‑digit teens and the EMA ribbon is sharply tilted down. Yet the volume profile shows a tiny point of control just above current price, hinting sellers are still fighting for every last tick.
On the 4H chart the pivot sits around the 0.000362 zone. If $BETA stays above the ~0.000380 invalidation line, the downside bias remains intact, targeting the ~0.000329 objective area. A clean break below the invalidation would flip the story, but the current candle closing near the pivot keeps the bearish case alive. Tap $BETA to pull up the chart and see these zones yourself.
I see the market poised to test the 0.000329 zone unless the price rebounds above the 0.00038 barrier.
Follow me for the next update when that barrier finally moves – I’ll break down what the next swing looks like. What level are you watching on BETA and why? 👇
⚠️ Not financial advice. DYOR.
#BETA #Crypto #BinanceSquare
The 4‑hour candle just slipped under the 0.00036 mark, and the next 30 minutes will decide if $BETA can hold the floor.
Read the setup below 👇
Price is screaming bearish – RSI stuck in the single‑digit teens and the EMA ribbon is sharply tilted down. Yet the volume profile shows a tiny point of control just above current price, hinting sellers are still fighting for every last tick.
On the 4H chart the pivot sits around the 0.000362 zone. If $BETA stays above the ~0.000380 invalidation line, the downside bias remains intact, targeting the ~0.000329 objective area. A clean break below the invalidation would flip the story, but the current candle closing near the pivot keeps the bearish case alive. Tap $BETA to pull up the chart and see these zones yourself.
I see the market poised to test the 0.000329 zone unless the price rebounds above the 0.00038 barrier.
Follow me for the next update when that barrier finally moves – I’ll break down what the next swing looks like. What level are you watching on BETA and why? 👇
⚠️ Not financial advice. DYOR.
#BETA #Crypto #BinanceSquare
Read the setup below 👇
Price is screaming bearish – RSI stuck in the single‑digit teens and the EMA ribbon is sharply tilted down. Yet the volume profile shows a tiny point of control just above current price, hinting sellers are still fighting for every last tick.
On the 4H chart the pivot sits around the 0.000362 zone. If $BETA stays above the ~0.000380 invalidation line, the downside bias remains intact, targeting the ~0.000329 objective area. A clean break below the invalidation would flip the story, but the current candle closing near the pivot keeps the bearish case alive. Tap $BETA to pull up the chart and see these zones yourself.
I see the market poised to test the 0.000329 zone unless the price rebounds above the 0.00038 barrier.
Follow me for the next update when that barrier finally moves – I’ll break down what the next swing looks like. What level are you watching on BETA and why? 👇
⚠️ Not financial advice. DYOR.
#BETA #Crypto #BinanceSquare
11
Everyone thinks a -64% candle is the bottom. It’s not — it’s a warning.
The 4H chart just printed a -51% collapse, closing at 0.00036000. RSI is buried at 17.5. ATR has exploded. This is not a dip — it’s a falling knife.
Futures are empty. Funding flat at zero. Open interest is nothing. No leveraged longs left to liquidate — and no short-squeeze fuel. This is spot-driven panic, and panic often overextends before the real bounce.
The bearish fair value gap between 0.00230000 and 0.00286000 is miles above. Volume profile point of control sits at 0.00074500 — roughly double current price. This zone is a vacuum.
If $BETA holds around 0.00036000, the next downside objective is 0.00032900. Lose that and the 24H low at 0.00031000 becomes the last line.
Invalidation: a 4H close back above 0.00038000 suggests the flush is exhausted. Until then, path of least resistance remains lower.
My read: broken chart in freefall, not a discount. The only trade here is patience.
Tap $BETA to see how far below fair value this has fallen. I’ll update if 0.00032900 gets tested — follow so you’re in the loop.
What level are you watching on $BETA to signal the bleeding has stopped? 👇
⚠️ Not financial advice. DYOR.
#BETA #Crypto #BinanceSquare
Everyone thinks a -64% candle is the bottom. It’s not — it’s a warning.
The 4H chart just printed a -51% collapse, closing at 0.00036000. RSI is buried at 17.5. ATR has exploded. This is not a dip — it’s a falling knife.
Futures are empty. Funding flat at zero. Open interest is nothing. No leveraged longs left to liquidate — and no short-squeeze fuel. This is spot-driven panic, and panic often overextends before the real bounce.
The bearish fair value gap between 0.00230000 and 0.00286000 is miles above. Volume profile point of control sits at 0.00074500 — roughly double current price. This zone is a vacuum.
If $BETA holds around 0.00036000, the next downside objective is 0.00032900. Lose that and the 24H low at 0.00031000 becomes the last line.
Invalidation: a 4H close back above 0.00038000 suggests the flush is exhausted. Until then, path of least resistance remains lower.
My read: broken chart in freefall, not a discount. The only trade here is patience.
Tap $BETA to see how far below fair value this has fallen. I’ll update if 0.00032900 gets tested — follow so you’re in the loop.
What level are you watching on $BETA to signal the bleeding has stopped? 👇
⚠️ Not financial advice. DYOR.
#BETA #Crypto #BinanceSquare
The 4H chart just printed a -51% collapse, closing at 0.00036000. RSI is buried at 17.5. ATR has exploded. This is not a dip — it’s a falling knife.
Futures are empty. Funding flat at zero. Open interest is nothing. No leveraged longs left to liquidate — and no short-squeeze fuel. This is spot-driven panic, and panic often overextends before the real bounce.
The bearish fair value gap between 0.00230000 and 0.00286000 is miles above. Volume profile point of control sits at 0.00074500 — roughly double current price. This zone is a vacuum.
If $BETA holds around 0.00036000, the next downside objective is 0.00032900. Lose that and the 24H low at 0.00031000 becomes the last line.
Invalidation: a 4H close back above 0.00038000 suggests the flush is exhausted. Until then, path of least resistance remains lower.
My read: broken chart in freefall, not a discount. The only trade here is patience.
Tap $BETA to see how far below fair value this has fallen. I’ll update if 0.00032900 gets tested — follow so you’re in the loop.
What level are you watching on $BETA to signal the bleeding has stopped? 👇
⚠️ Not financial advice. DYOR.
#BETA #Crypto #BinanceSquare
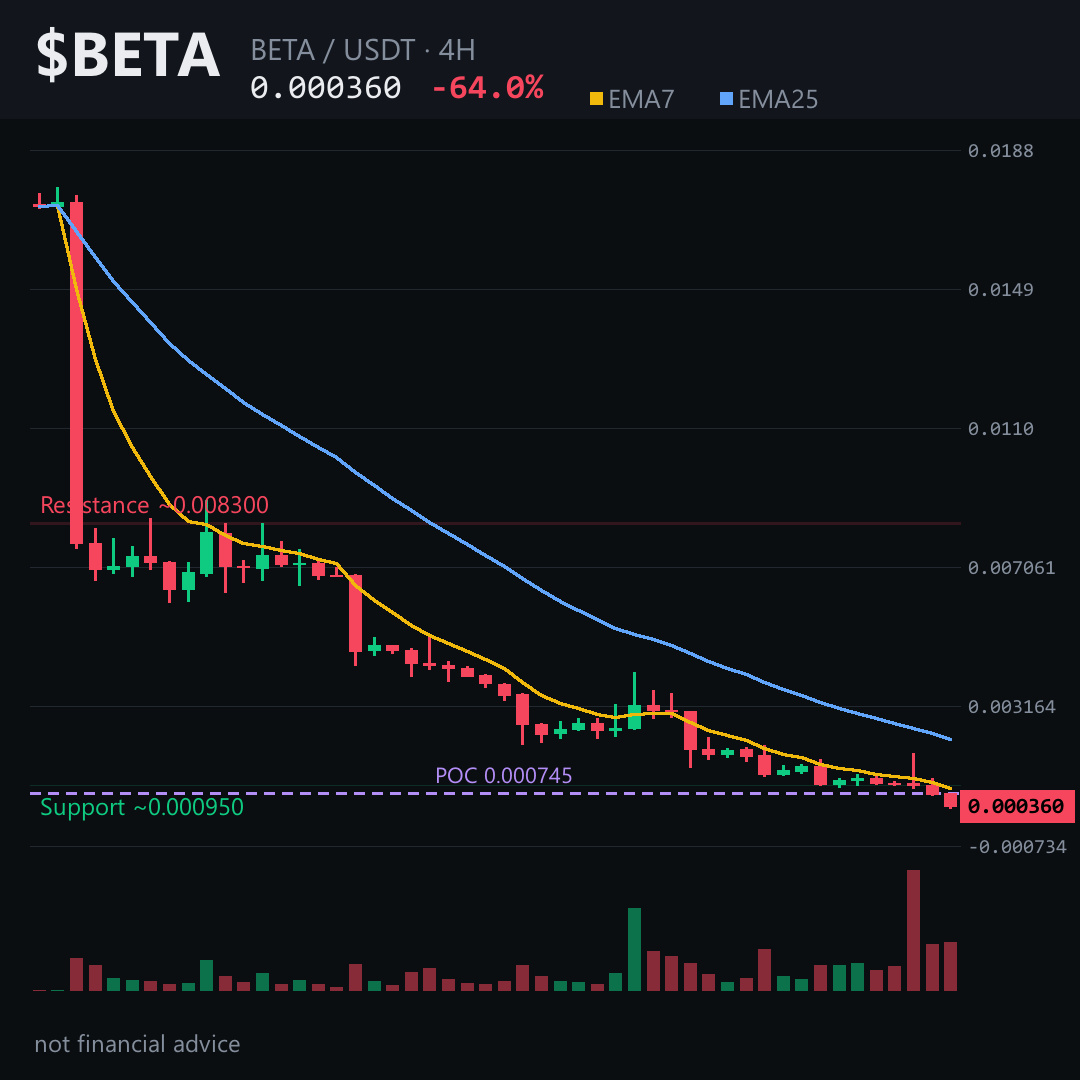
7
The 4‑hour candle just broke the tiny green candle at 0.00036 — did the market just hand you the next “stop‑run” zone? 👀
Price is screaming bearish, yet the funding line sits at zero and open interest is flat, hinting at a lack of conviction from leveraged traders. The EMA7 is well under the EMA25 and RSI is stuck in the teens, so the downside pressure is real, but the chart still holds a tiny cushion.
On the 4H picture the current area clusters around 0.000362 . Below that, the ~0.000329 zone acts as the next demand pocket, while a close above ~0.000380 would invalidate the bearish case. Think of it as a narrow hallway: once the price slips past the doorway it may wander down to the lower zone.
My read: the market is primed to test the ~0.000329 area; if it holds, the downside narrative stays intact.
Follow me for a next‑level breakdown when price either respects that zone or flips the script.
What level are you watching on $BETA? 👇
⚠️ Not financial advice. DYOR.
#BETA #Crypto #BinanceSquare #Altcoins
The 4‑hour candle just broke the tiny green candle at 0.00036 — did the market just hand you the next “stop‑run” zone? 👀
Price is screaming bearish, yet the funding line sits at zero and open interest is flat, hinting at a lack of conviction from leveraged traders. The EMA7 is well under the EMA25 and RSI is stuck in the teens, so the downside pressure is real, but the chart still holds a tiny cushion.
On the 4H picture the current area clusters around 0.000362 . Below that, the ~0.000329 zone acts as the next demand pocket, while a close above ~0.000380 would invalidate the bearish case. Think of it as a narrow hallway: once the price slips past the doorway it may wander down to the lower zone.
My read: the market is primed to test the ~0.000329 area; if it holds, the downside narrative stays intact.
Follow me for a next‑level breakdown when price either respects that zone or flips the script.
What level are you watching on $BETA? 👇
⚠️ Not financial advice. DYOR.
#BETA #Crypto #BinanceSquare #Altcoins
Price is screaming bearish, yet the funding line sits at zero and open interest is flat, hinting at a lack of conviction from leveraged traders. The EMA7 is well under the EMA25 and RSI is stuck in the teens, so the downside pressure is real, but the chart still holds a tiny cushion.
On the 4H picture the current area clusters around 0.000362 . Below that, the ~0.000329 zone acts as the next demand pocket, while a close above ~0.000380 would invalidate the bearish case. Think of it as a narrow hallway: once the price slips past the doorway it may wander down to the lower zone.
My read: the market is primed to test the ~0.000329 area; if it holds, the downside narrative stays intact.
Follow me for a next‑level breakdown when price either respects that zone or flips the script.
What level are you watching on $BETA? 👇
⚠️ Not financial advice. DYOR.
#BETA #Crypto #BinanceSquare #Altcoins
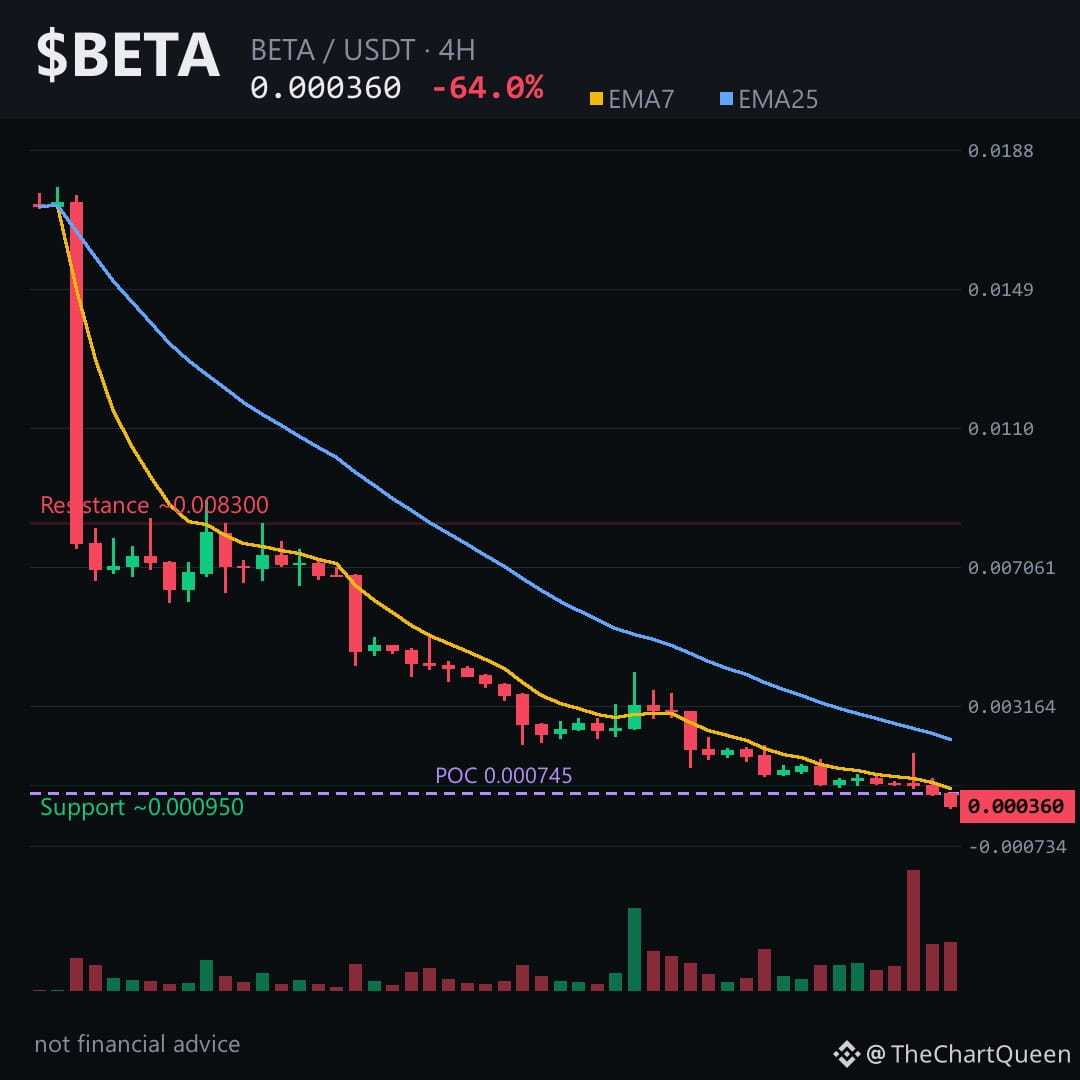
2
The 64% plunge has traders writing $BETA off as a dead coin.
But the 4‑hour chart still hides a slim cushion that could stall the fall.
Read the price action before you dismiss it 👇
Price is hugging the 4H pivot while RSI sits at 17.5, flagging extreme oversold.
The bearish unfilled gap above $0.0023 is already burnt, so the next swing targets the lower zone.
The current area sits around 0.000362; losing the ~0.000329 zone would confirm the downside.
If $BETA slides below that level, the bearish case strengthens.
Tap $BETA to pull up the chart and see these zones yourself.
I see a higher‑probability bounce off the 0.000362 area, with the real risk if it pierces the ~0.000380 ceiling.
Follow me for the next update when the price tests the 0.000380 barrier – I’ll break down what that means for the longer swing.
What level are you watching on BETA? 👇
⚠️ Not financial advice. DYOR.
#BETA #Crypto #BinanceSquare #TopLoser
The 64% plunge has traders writing $BETA off as a dead coin.
But the 4‑hour chart still hides a slim cushion that could stall the fall.
Read the price action before you dismiss it 👇
Price is hugging the 4H pivot while RSI sits at 17.5, flagging extreme oversold.
The bearish unfilled gap above $0.0023 is already burnt, so the next swing targets the lower zone.
The current area sits around 0.000362; losing the ~0.000329 zone would confirm the downside.
If $BETA slides below that level, the bearish case strengthens.
Tap $BETA to pull up the chart and see these zones yourself.
I see a higher‑probability bounce off the 0.000362 area, with the real risk if it pierces the ~0.000380 ceiling.
Follow me for the next update when the price tests the 0.000380 barrier – I’ll break down what that means for the longer swing.
What level are you watching on BETA? 👇
⚠️ Not financial advice. DYOR.
#BETA #Crypto #BinanceSquare #TopLoser
But the 4‑hour chart still hides a slim cushion that could stall the fall.
Read the price action before you dismiss it 👇
Price is hugging the 4H pivot while RSI sits at 17.5, flagging extreme oversold.
The bearish unfilled gap above $0.0023 is already burnt, so the next swing targets the lower zone.
The current area sits around 0.000362; losing the ~0.000329 zone would confirm the downside.
If $BETA slides below that level, the bearish case strengthens.
Tap $BETA to pull up the chart and see these zones yourself.
I see a higher‑probability bounce off the 0.000362 area, with the real risk if it pierces the ~0.000380 ceiling.
Follow me for the next update when the price tests the 0.000380 barrier – I’ll break down what that means for the longer swing.
What level are you watching on BETA? 👇
⚠️ Not financial advice. DYOR.
#BETA #Crypto #BinanceSquare #TopLoser
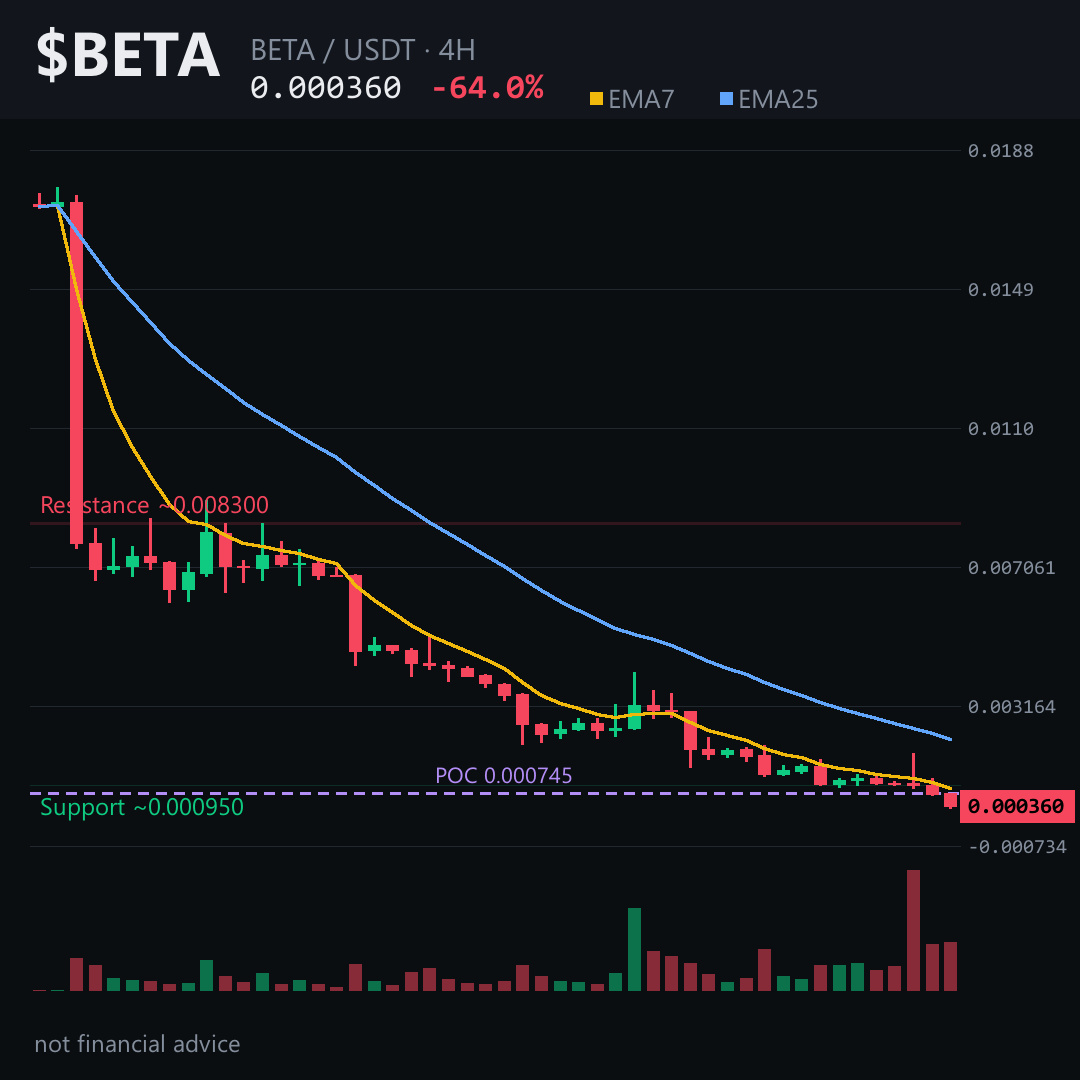
3
A wave of optimism is hanging on the $0.0011 high, hoping $BETA will sprint back.
The 4‑hour candles, however, are painting a different picture.
Read the math before you chase the hype 👇
Price sits under its 4‑hour EMA7 and RSI is stuck in the teens – a classic oversold trap that often precedes a deeper slide. A fresh bearish FVG sits just above the market, ready to swallow any false rally.
If $BETA can’t hold the ~0.000362 zone, the next hurdle is the ~0.000380 barrier; a break there would open the path toward the ~0.000329 area. Tap $BETA to pull up the chart and see these zones yourself.
The chart is whispering that the real risk lies in a slip below the ~0.000362 zone – the downside bias feels solid.
I’ll break down the next move once the price tests the ~0.000380 line, so hit follow to stay ahead.
What do you think BETA will do around the 0.00036 area? 👇
⚠️ Not financial advice. DYOR.
#BETA #Crypto #BinanceSquare #Altcoins
A wave of optimism is hanging on the $0.0011 high, hoping $BETA will sprint back.
The 4‑hour candles, however, are painting a different picture.
Read the math before you chase the hype 👇
Price sits under its 4‑hour EMA7 and RSI is stuck in the teens – a classic oversold trap that often precedes a deeper slide. A fresh bearish FVG sits just above the market, ready to swallow any false rally.
If $BETA can’t hold the ~0.000362 zone, the next hurdle is the ~0.000380 barrier; a break there would open the path toward the ~0.000329 area. Tap $BETA to pull up the chart and see these zones yourself.
The chart is whispering that the real risk lies in a slip below the ~0.000362 zone – the downside bias feels solid.
I’ll break down the next move once the price tests the ~0.000380 line, so hit follow to stay ahead.
What do you think BETA will do around the 0.00036 area? 👇
⚠️ Not financial advice. DYOR.
#BETA #Crypto #BinanceSquare #Altcoins
The 4‑hour candles, however, are painting a different picture.
Read the math before you chase the hype 👇
Price sits under its 4‑hour EMA7 and RSI is stuck in the teens – a classic oversold trap that often precedes a deeper slide. A fresh bearish FVG sits just above the market, ready to swallow any false rally.
If $BETA can’t hold the ~0.000362 zone, the next hurdle is the ~0.000380 barrier; a break there would open the path toward the ~0.000329 area. Tap $BETA to pull up the chart and see these zones yourself.
The chart is whispering that the real risk lies in a slip below the ~0.000362 zone – the downside bias feels solid.
I’ll break down the next move once the price tests the ~0.000380 line, so hit follow to stay ahead.
What do you think BETA will do around the 0.00036 area? 👇
⚠️ Not financial advice. DYOR.
#BETA #Crypto #BinanceSquare #Altcoins
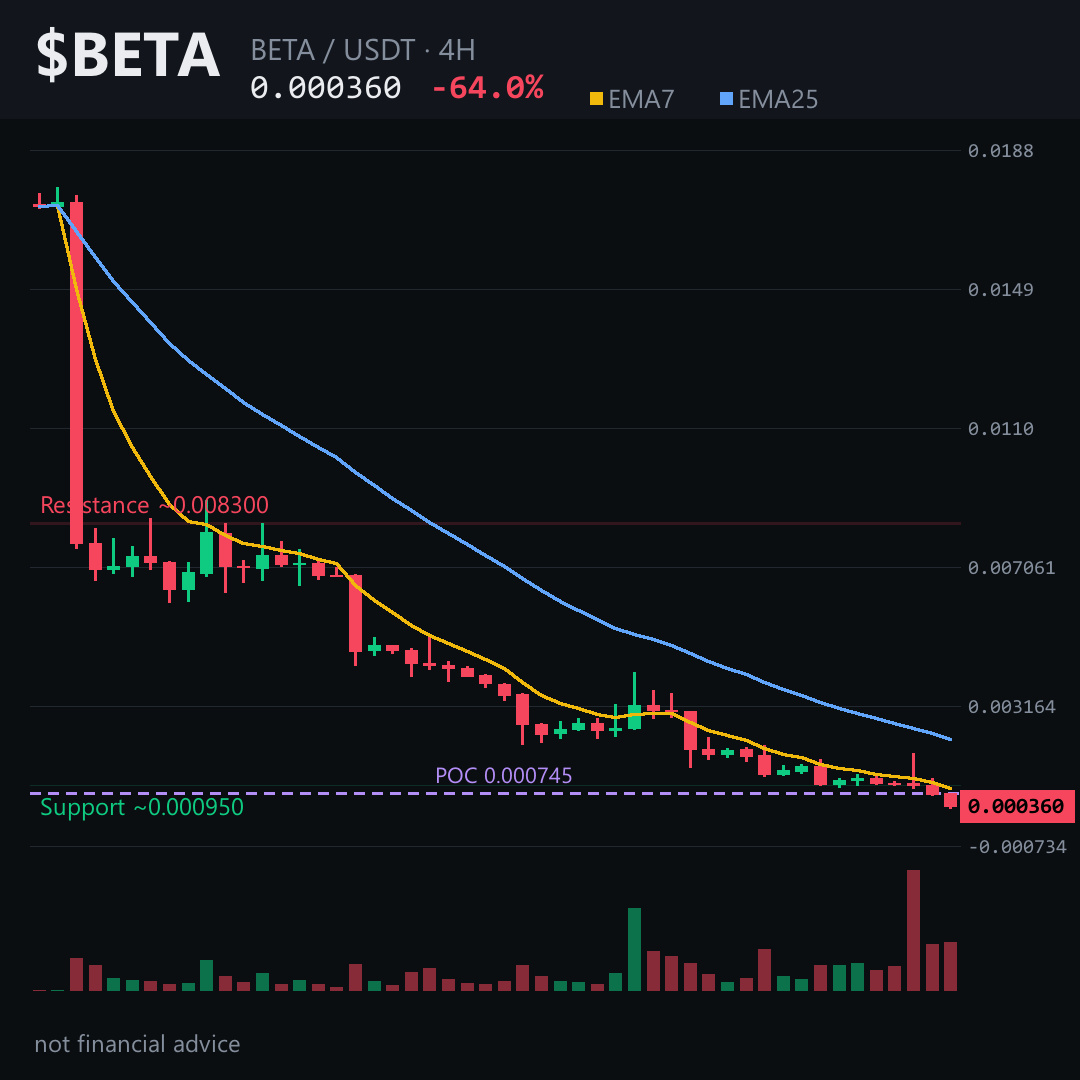
28
-64% in a day. That’s not a dip — that’s a structural reset.
$BETA just printed a 51% red candle on the 4H, closing near the lows. Daily RSI sits at 15 — often exhaustion, but sometimes still finding a floor. Futures are silent: no funding, no open interest. No conviction, just drift.
Price rejected from an unfilled bearish gap between 0.0023 and 0.00286. It never recovered. Now it’s compressing under 0.00038 — the near-term ceiling. If $BETA loses 0.00033 on a 4H close, next leg likely targets 0.00031 (24H low) — and below that, the macro objective near 0.00023.
The only invalidation that matters here: a 4H close back above 0.00038. That would signal sell-side momentum fading. Until then, path of least resistance remains lower. Tap $BETA to pull up the chart and read these levels yourself.
My read: a falling knife with no volume cushion underneath. Bounce attempts are weak, range keeps expanding lower. I’d need a higher low before trusting any recovery.
Follow me for the follow-up if BETA tests 0.00033 — that’s where the next decision gets made.
What level are you watching more closely — 0.00033 or 0.00038? 👇
⚠️ Not financial advice. DYOR.
#BETA #Crypto #BinanceSquare
-64% in a day. That’s not a dip — that’s a structural reset.
$BETA just printed a 51% red candle on the 4H, closing near the lows. Daily RSI sits at 15 — often exhaustion, but sometimes still finding a floor. Futures are silent: no funding, no open interest. No conviction, just drift.
Price rejected from an unfilled bearish gap between 0.0023 and 0.00286. It never recovered. Now it’s compressing under 0.00038 — the near-term ceiling. If $BETA loses 0.00033 on a 4H close, next leg likely targets 0.00031 (24H low) — and below that, the macro objective near 0.00023.
The only invalidation that matters here: a 4H close back above 0.00038. That would signal sell-side momentum fading. Until then, path of least resistance remains lower. Tap $BETA to pull up the chart and read these levels yourself.
My read: a falling knife with no volume cushion underneath. Bounce attempts are weak, range keeps expanding lower. I’d need a higher low before trusting any recovery.
Follow me for the follow-up if BETA tests 0.00033 — that’s where the next decision gets made.
What level are you watching more closely — 0.00033 or 0.00038? 👇
⚠️ Not financial advice. DYOR.
#BETA #Crypto #BinanceSquare
$BETA just printed a 51% red candle on the 4H, closing near the lows. Daily RSI sits at 15 — often exhaustion, but sometimes still finding a floor. Futures are silent: no funding, no open interest. No conviction, just drift.
Price rejected from an unfilled bearish gap between 0.0023 and 0.00286. It never recovered. Now it’s compressing under 0.00038 — the near-term ceiling. If $BETA loses 0.00033 on a 4H close, next leg likely targets 0.00031 (24H low) — and below that, the macro objective near 0.00023.
The only invalidation that matters here: a 4H close back above 0.00038. That would signal sell-side momentum fading. Until then, path of least resistance remains lower. Tap $BETA to pull up the chart and read these levels yourself.
My read: a falling knife with no volume cushion underneath. Bounce attempts are weak, range keeps expanding lower. I’d need a higher low before trusting any recovery.
Follow me for the follow-up if BETA tests 0.00033 — that’s where the next decision gets made.
What level are you watching more closely — 0.00033 or 0.00038? 👇
⚠️ Not financial advice. DYOR.
#BETA #Crypto #BinanceSquare
4
·
--
The sheer scale of today's slide on $BETA is hard to ignore.
The token sank 64.00% down to 0.00036, trading right near its 0.00031 session low after reaching 0.0011 earlier. That is a massive 219.44% range on $296,136 in volume.
When prices compress this close to the floor, are you waiting for structure to build or staying clear? #BETA #Altcoins
The sheer scale of today's slide on $BETA is hard to ignore.
The token sank 64.00% down to 0.00036, trading right near its 0.00031 session low after reaching 0.0011 earlier. That is a massive 219.44% range on $296,136 in volume.
When prices compress this close to the floor, are you waiting for structure to build or staying clear? #BETA #Altcoins
The token sank 64.00% down to 0.00036, trading right near its 0.00031 session low after reaching 0.0011 earlier. That is a massive 219.44% range on $296,136 in volume.
When prices compress this close to the floor, are you waiting for structure to build or staying clear? #BETA #Altcoins
79
A 64% single-day flush isn't a dip — it's a liquidation cascade that already happened. And the scary part? The chart shows no sign it's done.
RSI is buried at 17 on the 4H. That's not "oversold bounce territory." That's what a coin looks like when sellers step away only because there's no one left to sell to. 8 red out of the last 12 candles, with the final one slicing through 0.00067 like it wasn't there. That was a structural break.
Price is hovering around 0.00036, and the only thing between here and 0.00033 is thin air. That lower zone is the 4H objective — a natural continuation if the bounce stalls. The invalidation is clean: a 4H close back above 0.00038 and this bearish read starts losing teeth. Until then, every pump attempt this week has been sold. Tap $BETA and watch how price keeps rejecting the 0.00095–0.0010 band on the way down. That's not accumulation. That's distribution disguised as hope.
My read: trend broken, bounce weak, and only a decisive reclaim of 0.00038 on real volume changes the picture. Until then, downside pressure remains the path of least resistance.
If this level breaks or the bounce holds, I'll walk through which side of the tape is winning — follow so that update lands in your feed.
What's the one level you're watching on $BETA right now 👇
⚠️ Not financial advice. DYOR.
#BETA #Crypto #BinanceSquare #Altcoins
A 64% single-day flush isn't a dip — it's a liquidation cascade that already happened. And the scary part? The chart shows no sign it's done.
RSI is buried at 17 on the 4H. That's not "oversold bounce territory." That's what a coin looks like when sellers step away only because there's no one left to sell to. 8 red out of the last 12 candles, with the final one slicing through 0.00067 like it wasn't there. That was a structural break.
Price is hovering around 0.00036, and the only thing between here and 0.00033 is thin air. That lower zone is the 4H objective — a natural continuation if the bounce stalls. The invalidation is clean: a 4H close back above 0.00038 and this bearish read starts losing teeth. Until then, every pump attempt this week has been sold. Tap $BETA and watch how price keeps rejecting the 0.00095–0.0010 band on the way down. That's not accumulation. That's distribution disguised as hope.
My read: trend broken, bounce weak, and only a decisive reclaim of 0.00038 on real volume changes the picture. Until then, downside pressure remains the path of least resistance.
If this level breaks or the bounce holds, I'll walk through which side of the tape is winning — follow so that update lands in your feed.
What's the one level you're watching on $BETA right now 👇
⚠️ Not financial advice. DYOR.
#BETA #Crypto #BinanceSquare #Altcoins
RSI is buried at 17 on the 4H. That's not "oversold bounce territory." That's what a coin looks like when sellers step away only because there's no one left to sell to. 8 red out of the last 12 candles, with the final one slicing through 0.00067 like it wasn't there. That was a structural break.
Price is hovering around 0.00036, and the only thing between here and 0.00033 is thin air. That lower zone is the 4H objective — a natural continuation if the bounce stalls. The invalidation is clean: a 4H close back above 0.00038 and this bearish read starts losing teeth. Until then, every pump attempt this week has been sold. Tap $BETA and watch how price keeps rejecting the 0.00095–0.0010 band on the way down. That's not accumulation. That's distribution disguised as hope.
My read: trend broken, bounce weak, and only a decisive reclaim of 0.00038 on real volume changes the picture. Until then, downside pressure remains the path of least resistance.
If this level breaks or the bounce holds, I'll walk through which side of the tape is winning — follow so that update lands in your feed.
What's the one level you're watching on $BETA right now 👇
⚠️ Not financial advice. DYOR.
#BETA #Crypto #BinanceSquare #Altcoins
5
Everyone thinks a -64% day means the bottom is in.
Flip that: the most dangerous knife on Binance right now is the one still falling at terminal velocity.
$BETA didn’t just dip — it erased two-thirds of its value in 24 hours.
RSI on the 4H is buried near 17. That’s not “oversold bounce” territory yet — that’s a market with no bid under it.
Here’s the part that should make you pause:
The last 4H candle closed at 0.000360 after tagging 0.000310.
Volume is thin. The only real liquidity pool sits far below.
This is a falling asset with no floor nearby — just air.
My levels on the 4H:
Support is the old low zone around 0.000310.
If that gives way, the next natural magnet is the mid-0.00032 area and lower.
The only level that would tell me the bleed is stalling is a 4H close back above 0.000380.
Until then, bounces are exits, not entries.
My read: this is a chart that punishes optimism. The risk isn’t missing a rebound — it’s catching a falling brick before the volume confirms a real reversal.
Tap $BETA and look at the 4H close yourself — the level is obvious once you see it.
Follow for the follow-up when this range either reclaims or collapses — that’s the only signal that matters.
Which level are you watching on $BETA — the reclaim zone or the breakdown? 👇
⚠️ Not financial advice. DYOR.
#BETA #Crypto #BinanceSquare
Everyone thinks a -64% day means the bottom is in.
Flip that: the most dangerous knife on Binance right now is the one still falling at terminal velocity.
$BETA didn’t just dip — it erased two-thirds of its value in 24 hours.
RSI on the 4H is buried near 17. That’s not “oversold bounce” territory yet — that’s a market with no bid under it.
Here’s the part that should make you pause:
The last 4H candle closed at 0.000360 after tagging 0.000310.
Volume is thin. The only real liquidity pool sits far below.
This is a falling asset with no floor nearby — just air.
My levels on the 4H:
Support is the old low zone around 0.000310.
If that gives way, the next natural magnet is the mid-0.00032 area and lower.
The only level that would tell me the bleed is stalling is a 4H close back above 0.000380.
Until then, bounces are exits, not entries.
My read: this is a chart that punishes optimism. The risk isn’t missing a rebound — it’s catching a falling brick before the volume confirms a real reversal.
Tap $BETA and look at the 4H close yourself — the level is obvious once you see it.
Follow for the follow-up when this range either reclaims or collapses — that’s the only signal that matters.
Which level are you watching on $BETA — the reclaim zone or the breakdown? 👇
⚠️ Not financial advice. DYOR.
#BETA #Crypto #BinanceSquare
Flip that: the most dangerous knife on Binance right now is the one still falling at terminal velocity.
$BETA didn’t just dip — it erased two-thirds of its value in 24 hours.
RSI on the 4H is buried near 17. That’s not “oversold bounce” territory yet — that’s a market with no bid under it.
Here’s the part that should make you pause:
The last 4H candle closed at 0.000360 after tagging 0.000310.
Volume is thin. The only real liquidity pool sits far below.
This is a falling asset with no floor nearby — just air.
My levels on the 4H:
Support is the old low zone around 0.000310.
If that gives way, the next natural magnet is the mid-0.00032 area and lower.
The only level that would tell me the bleed is stalling is a 4H close back above 0.000380.
Until then, bounces are exits, not entries.
My read: this is a chart that punishes optimism. The risk isn’t missing a rebound — it’s catching a falling brick before the volume confirms a real reversal.
Tap $BETA and look at the 4H close yourself — the level is obvious once you see it.
Follow for the follow-up when this range either reclaims or collapses — that’s the only signal that matters.
Which level are you watching on $BETA — the reclaim zone or the breakdown? 👇
⚠️ Not financial advice. DYOR.
#BETA #Crypto #BinanceSquare
55
·
--
Markets are busy debating if Amazon’s massive tech bets will pay off, but crypto isn't waiting around to de-risk.
$BETA slid 64.00% to trade at 0.00036, spanning a wild 219.44% range from 0.0011 down to 0.00031 on just $296,136 volume.
When broader risk sentiment turns defensive, smaller caps get hit double hard. Are you holding cash or looking for setups? #BETA #CryptoTrading
Markets are busy debating if Amazon’s massive tech bets will pay off, but crypto isn't waiting around to de-risk.
$BETA slid 64.00% to trade at 0.00036, spanning a wild 219.44% range from 0.0011 down to 0.00031 on just $296,136 volume.
When broader risk sentiment turns defensive, smaller caps get hit double hard. Are you holding cash or looking for setups? #BETA #CryptoTrading
$BETA slid 64.00% to trade at 0.00036, spanning a wild 219.44% range from 0.0011 down to 0.00031 on just $296,136 volume.
When broader risk sentiment turns defensive, smaller caps get hit double hard. Are you holding cash or looking for setups? #BETA #CryptoTrading

61
·
--
Looking closely at the $BETA chart today.
Price got hammered down 64.00% to 0.00036, stretching across a 219.44% spread between 0.0011 and 0.00031 on $296,136 volume.
When a candle pins this close to the lows without building any reclaim structure, trying to catch the knife usually hurts.
Are you waiting for a confirmed base here, or staying completely clear? #BETA #CryptoTrading
Looking closely at the $BETA chart today.
Price got hammered down 64.00% to 0.00036, stretching across a 219.44% spread between 0.0011 and 0.00031 on $296,136 volume.
When a candle pins this close to the lows without building any reclaim structure, trying to catch the knife usually hurts.
Are you waiting for a confirmed base here, or staying completely clear? #BETA #CryptoTrading
Price got hammered down 64.00% to 0.00036, stretching across a 219.44% spread between 0.0011 and 0.00031 on $296,136 volume.
When a candle pins this close to the lows without building any reclaim structure, trying to catch the knife usually hurts.
Are you waiting for a confirmed base here, or staying completely clear? #BETA #CryptoTrading
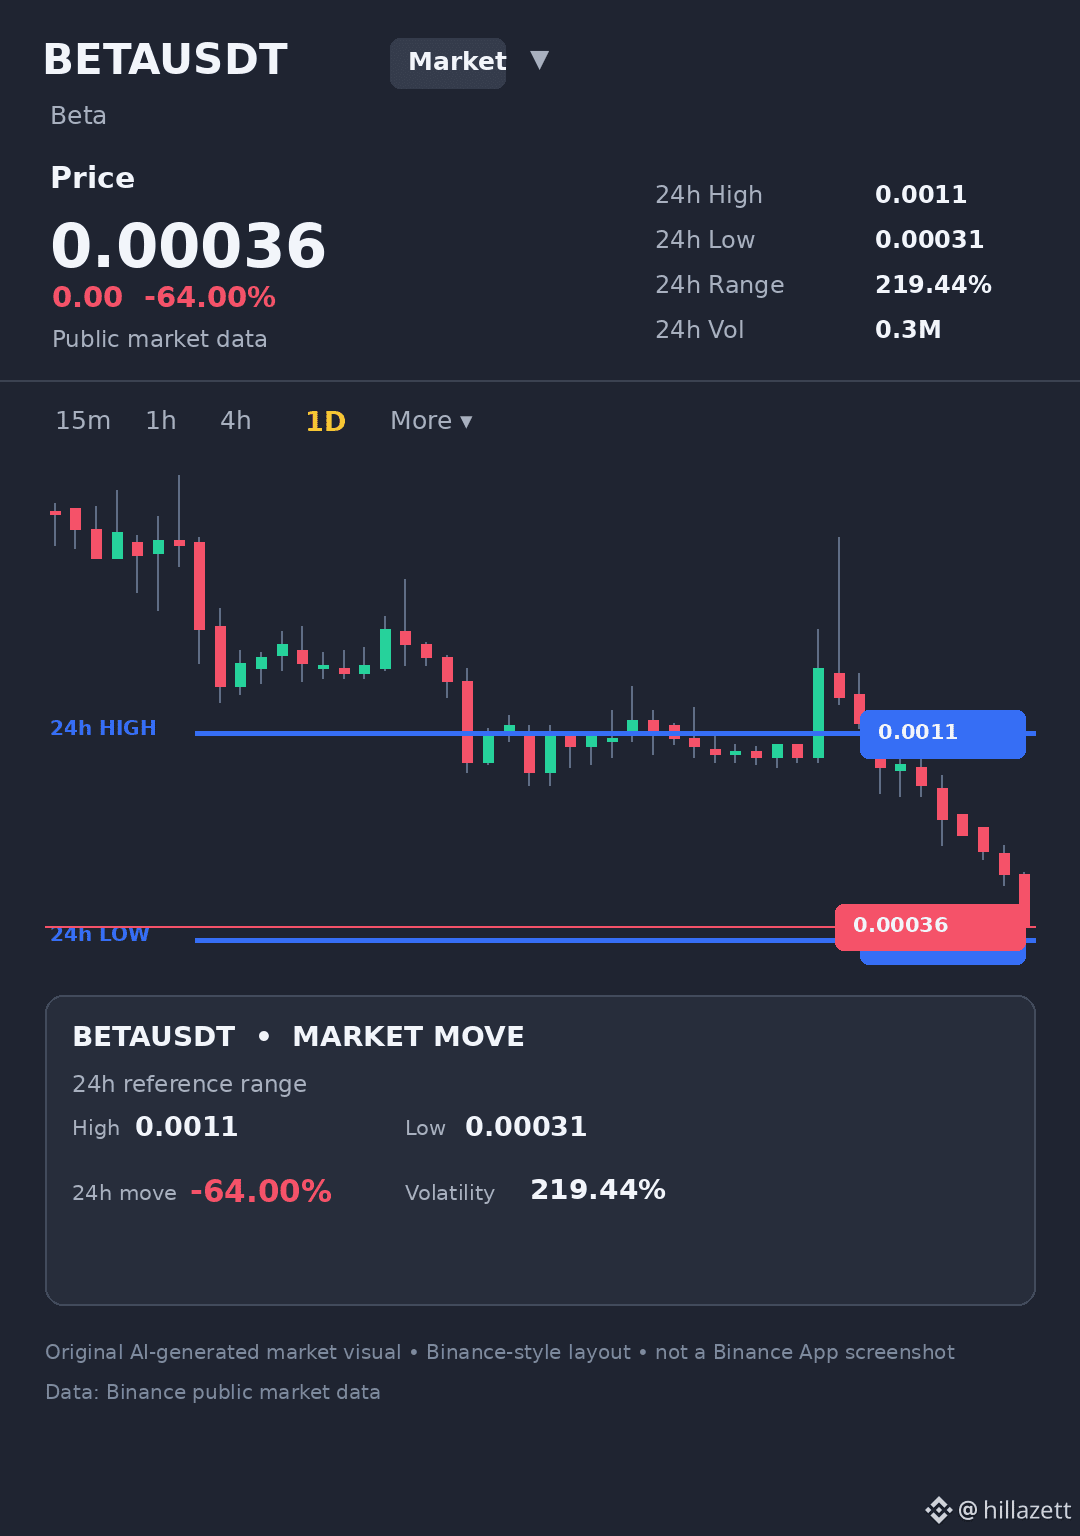
76
·
--
Thin liquidity turns ordinary selling into massive price swings.
$BETA collapsed 64.00% to 0.00036, carving out a 219.44% range between 0.0011 and 0.00031 on just $296,136 in volume.
When volume is thin across such a wide spread, market orders often trigger severe slippage. Limit orders protect your fill when depth dries up.
Do you stick strictly to limit orders on days like this? #BETA #CryptoEducation
Thin liquidity turns ordinary selling into massive price swings.
$BETA collapsed 64.00% to 0.00036, carving out a 219.44% range between 0.0011 and 0.00031 on just $296,136 in volume.
When volume is thin across such a wide spread, market orders often trigger severe slippage. Limit orders protect your fill when depth dries up.
Do you stick strictly to limit orders on days like this? #BETA #CryptoEducation
$BETA collapsed 64.00% to 0.00036, carving out a 219.44% range between 0.0011 and 0.00031 on just $296,136 in volume.
When volume is thin across such a wide spread, market orders often trigger severe slippage. Limit orders protect your fill when depth dries up.
Do you stick strictly to limit orders on days like this? #BETA #CryptoEducation
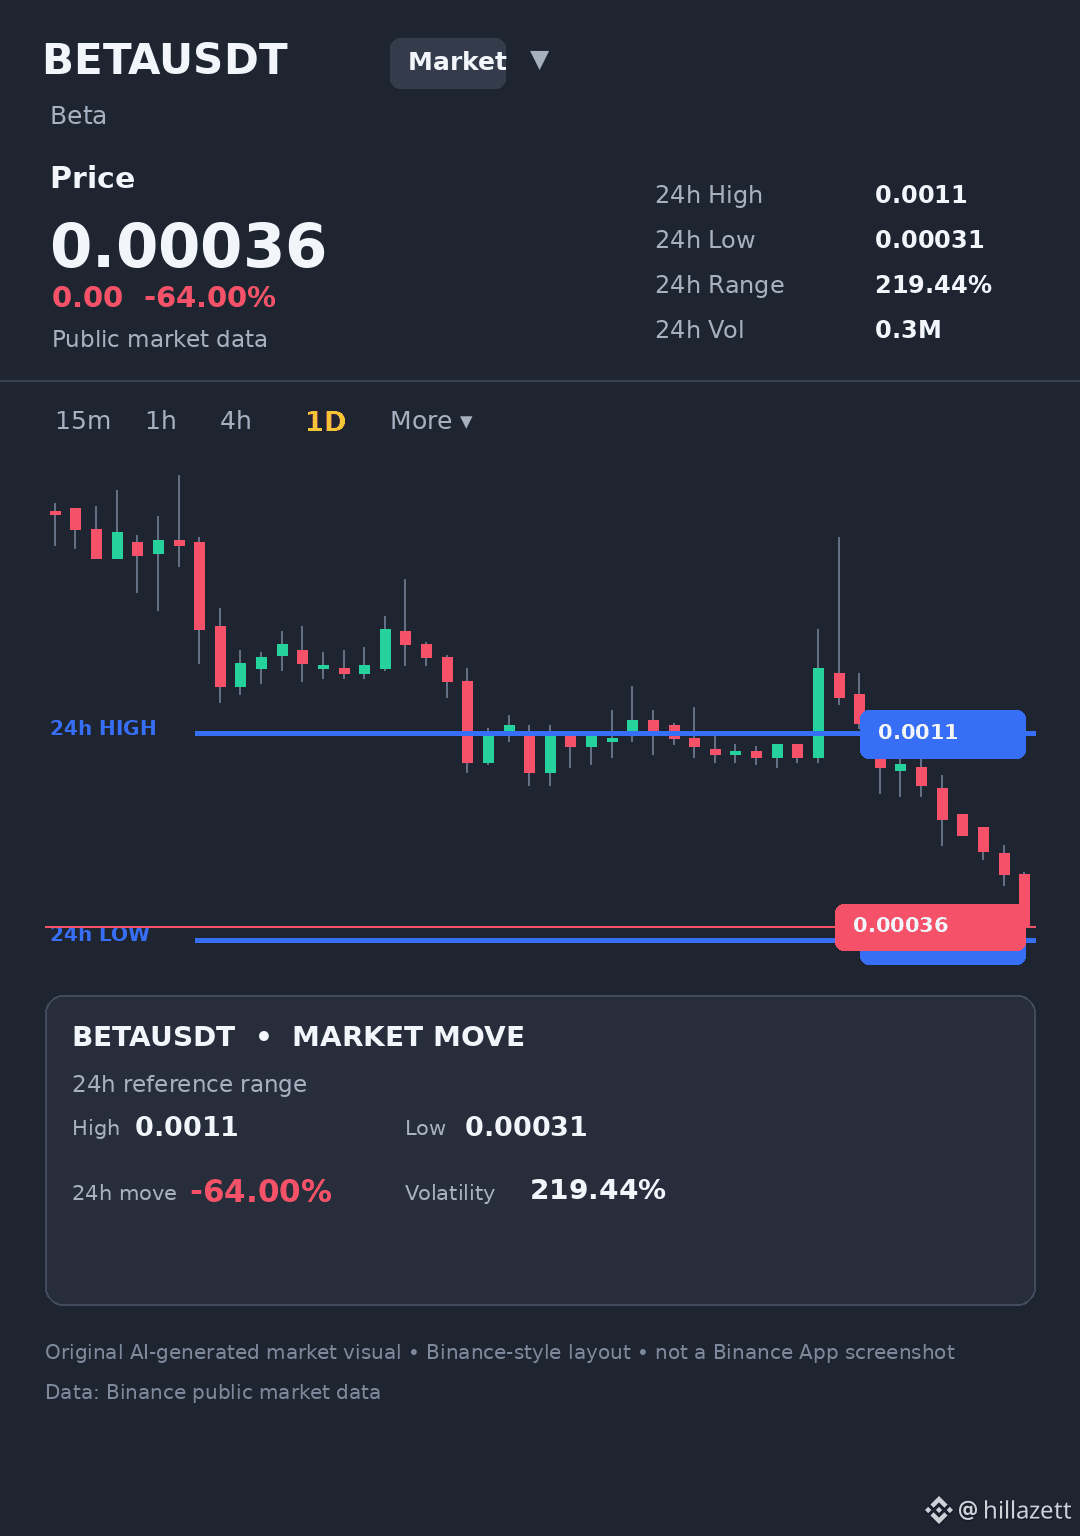
11
What actually happens when a coin loses 64% in a single day?
The chart looks destroyed — but the internals whisper something stranger.
$BETA is trading around the 0.00036 area after a brutal 24 hours. Price gapped from 0.00074 down to 0.00031 in one 4-hour candle. That's not a dip. That's a liquidation event.
RSI on the 4H is near 17. On the daily, around 15. Below 20 is rare. Below 15 is the kind of exhaustion you see right before violent bounces.
But here's the trap.
There's an unfilled bearish gap between 0.00230 and 0.00286. Markets often revisit those gaps. Not today. But eventually.
The heaviest traded level sits around 0.000745 — nearly double the current price. That's now overhead resistance. Any bounce into the 0.00070s likely meets sellers who want out at breakeven.
The bearish case stays intact while price holds below roughly 0.00038. That's the line in the sand — a 4H close above it and the "continuation down" story weakens fast. Below it, the objective zone sits near 0.00033, with a deeper macro target around 0.00023 if momentum refuses to cool.
Tap $BETA to pull up the chart.
My read: this is a falling knife with a coiled spring underneath. Oversold doesn't mean "done dropping." The real risk is catching a bounce before price reclaims the 0.00038 area.
Where do you think $BETA finds its first real floor? 👇
Follow for the next read on this chart.
⚠️ Not financial advice. DYOR.
#BETA #Crypto #BinanceSquare #Altcoins
What actually happens when a coin loses 64% in a single day?
The chart looks destroyed — but the internals whisper something stranger.
$BETA is trading around the 0.00036 area after a brutal 24 hours. Price gapped from 0.00074 down to 0.00031 in one 4-hour candle. That's not a dip. That's a liquidation event.
RSI on the 4H is near 17. On the daily, around 15. Below 20 is rare. Below 15 is the kind of exhaustion you see right before violent bounces.
But here's the trap.
There's an unfilled bearish gap between 0.00230 and 0.00286. Markets often revisit those gaps. Not today. But eventually.
The heaviest traded level sits around 0.000745 — nearly double the current price. That's now overhead resistance. Any bounce into the 0.00070s likely meets sellers who want out at breakeven.
The bearish case stays intact while price holds below roughly 0.00038. That's the line in the sand — a 4H close above it and the "continuation down" story weakens fast. Below it, the objective zone sits near 0.00033, with a deeper macro target around 0.00023 if momentum refuses to cool.
Tap $BETA to pull up the chart.
My read: this is a falling knife with a coiled spring underneath. Oversold doesn't mean "done dropping." The real risk is catching a bounce before price reclaims the 0.00038 area.
Where do you think $BETA finds its first real floor? 👇
Follow for the next read on this chart.
⚠️ Not financial advice. DYOR.
#BETA #Crypto #BinanceSquare #Altcoins
The chart looks destroyed — but the internals whisper something stranger.
$BETA is trading around the 0.00036 area after a brutal 24 hours. Price gapped from 0.00074 down to 0.00031 in one 4-hour candle. That's not a dip. That's a liquidation event.
RSI on the 4H is near 17. On the daily, around 15. Below 20 is rare. Below 15 is the kind of exhaustion you see right before violent bounces.
But here's the trap.
There's an unfilled bearish gap between 0.00230 and 0.00286. Markets often revisit those gaps. Not today. But eventually.
The heaviest traded level sits around 0.000745 — nearly double the current price. That's now overhead resistance. Any bounce into the 0.00070s likely meets sellers who want out at breakeven.
The bearish case stays intact while price holds below roughly 0.00038. That's the line in the sand — a 4H close above it and the "continuation down" story weakens fast. Below it, the objective zone sits near 0.00033, with a deeper macro target around 0.00023 if momentum refuses to cool.
Tap $BETA to pull up the chart.
My read: this is a falling knife with a coiled spring underneath. Oversold doesn't mean "done dropping." The real risk is catching a bounce before price reclaims the 0.00038 area.
Where do you think $BETA finds its first real floor? 👇
Follow for the next read on this chart.
⚠️ Not financial advice. DYOR.
#BETA #Crypto #BinanceSquare #Altcoins
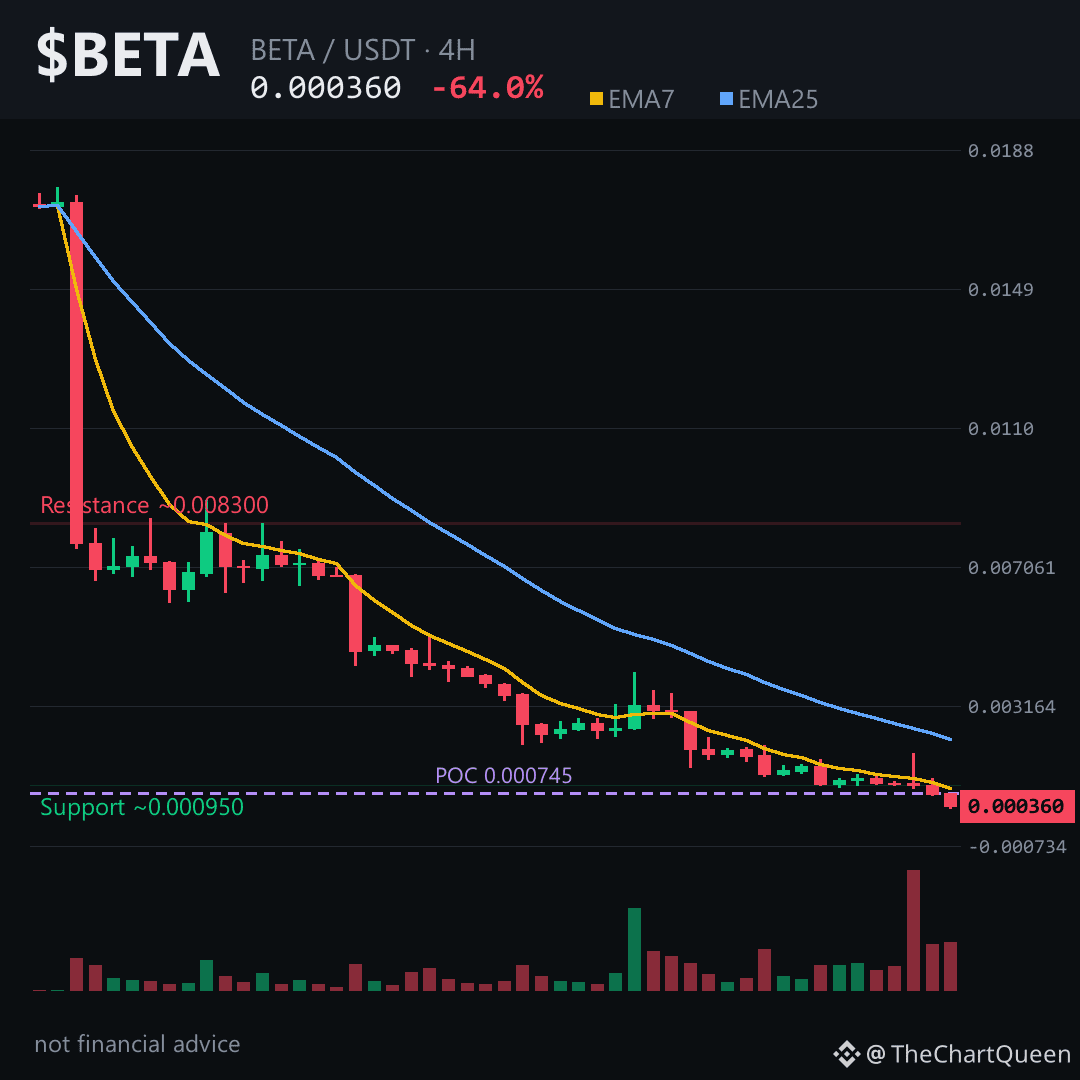
78
Войдите, чтобы посмотреть больше материала
Присоединяйтесь к пользователям криптовалют по всему миру на Binance Square
⚡️ Получайте новейшую и полезную информацию о криптоактивах.
💬 Нам доверяет крупнейшая в мире криптобиржа.
👍 Получите достоверные аналитические данные от верифицированных создателей контента.
Эл. почта/номер телефона
В тренде
1
#NvidiaBeatsEstimatesWith$130BQ4Outlook
Просмотров: 17,261
222 обсуждают
2
#AnthropicIPOPriceCouldExceed$80
Просмотров: 22,019
191 обсуждают
3
#RussiaCentralBankAddsAlfaBankToCryptoExchangeRegister
Просмотров: 0
16 обсуждают
4
#RussianCentralBankPlansToAllowFundsToHoldCryptoIn2027
Просмотров: 0
10 обсуждают
5
#VisaPlansStablecoinPrefundingForAPACCrossBorderPayments
Просмотров: 0
12 обсуждают
6
#CanNvidia’sDataCenterGrowthContinue?
Просмотров: 65,350
1,065 обсуждают
7
#CanadaAndUSLaunchOperationNiagaraAgainstApprovalPhishing
Просмотров: 5,807
49 обсуждают
8
#BankOfEnglandUnveilsClearingHousePathwayCoveringDLTFirms
Просмотров: 2,628
59 обсуждают
9
#DBSAndCirclePartnerToExpandAsianInstitutionsUSDCAccess
Просмотров: 3,856
60 обсуждают
10
#LedgerHardwareImplantReportsExtendToDubai
Просмотров: 31,123
551 обсуждают